
Our funding comes from our readers, and we may earn a commission if you make a purchase through the links on our website.
Packet Capture – What is it and a How-To Guide
UPDATED: August 29, 2023
Have you ever been in a difficult position as a Network Engineer where you keep troubleshooting a problem but you are not making headway? In certain instances like that, you just wish you can see what is really happening with each packet in the traffic flow.
If you are on a Cisco router, you may want to use the debug ip packet IOS Command but then you have probably heard (and experienced?) that turning on debugging on a production network can have serious performance impacts. So what do you do in times like that when you feel your hands are tied?
Enter Packet Capture.
With Packet capture, you can look into individual packets as they flow across a network and use the information gleaned from this process for several purposes – whether you trying to investigate high bandwidth usage or Monitor your network for suspicious traffic – we'll see the benefits of this as we continue with our lab.
In this article, we will discuss packet capture in detail by looking at its uses, challenges associated with capturing packets, tools that can help with packet capture, and also configure a lab that focuses on packet capture using Wireshark and analyzing the packets we sniffed to understand what they are doing.
What is a “Packet”?
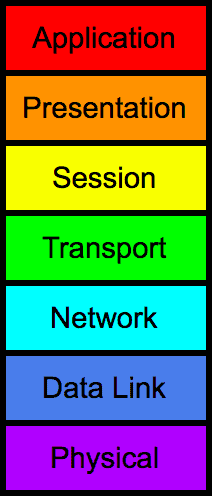
Before we continue in this article, let’s first talk about what we mean by “packets”. If you have been in the networking world for even a short while, then you will be familiar with the OSI model:
7 layers, from Application down to the Physical layer.
So what happens when two devices on a network want to communicate? Let’s take the example of a client that wants to access a particular page on a web server. From a high level, the client will make an HTTP request for that particular page on the web server.
However, for that HTTP request to get to the server, the data needs to be “encapsulated” across the various layers of the OSI model. For example, the HTTP request will be encapsulated in a TCP header, and then an IP header, and then becomes an Ethernet frame, until it is sent out over the wire to the server. The server will then perform the reverse process (decapsulation) until it retrieves the HTTP request from the client and then processes it.
Note: This is an oversimplification of the process. Before the HTTP request can be sent, other forms of communication like ARP and TCP Handshake will have taken place.
In most cases, several “packets” will be sent between the client and the server to form the communication/conversation between these devices. What packet capture does is to capture each packet that makes up the conversation so that these packets can be looked into at a deeper level.
Note: In networking terminology, we call data at the transport layer a segment, data at the network layer a packet, and data at the data link layer a frame. However, when talking about packet capture, a “packet” refers to data that has been encapsulated at the upper layers (e.g application layer) all the way down to when the packet is ready to exit/enter an interface.
Packet Capture Use-Cases
Now that we have gotten definitions out of the way, let us discuss some use cases for packet capture – why would you want to perform a packet capture?
Network Troubleshooting
At the start of this article, I described an all too common scenario where packet captures can be very useful which is when troubleshooting problems on a network, including packet loss and network congestion.
For troubleshooting, packet capture is not only about what you are seeing; it is also about what you are not seeing. For example, if some users on a particular network segment are complaining that they cannot access a server, packet capture can help you drill down into the problem.
Perhaps, the users who can access the server are using a different default gateway than the ones who can’t. If you capture packets on one of the gateways, you may discover the packets that are not coming through that gateway.
Security incident investigation
During one of my troubleshooting exercises for a company, we noticed that certain devices were being crippled by some traffic passing through them. The problem was so bad that it was affecting the console connection to the devices and we could hardly troubleshoot the devices on the spot.
Thankfully, this company was monitoring all traffic going through their network and keeping the backup of all these packet captures.
When we looked through the packet capture, we noticed a particular IP address that was sending a large number of packets. Further investigation revealed that this IP address was being used to perform a Denial of Service (DoS) attack on the company’s network. Blocking that IP address temporarily solved the problem.
This is one of the uses of Packet Capture, to help investigate security incidents such as the one described above. By capturing packets flowing through a network, it is possible to identify viruses, spyware, and other forms of malware and security threats.
Learning
One of my favorite uses of packet captures is for learning purposes. When I’m learning a new technology and perhaps read the RFC on that technology, it is usually helpful to use packet capture to see the technology in action.
For example, we commonly hear that the TCP handshake is made up of three packets: SYN, SYN+ACK, ACK, but have you ever seen a TCP handshake happen between two devices?
By capturing packets between devices communicating via TCP, you can learn and see the TCP Handshake process.
Packet Capture Tools
So you have decided you want to perform a packet capture, how do you go about it? The first thing you need to do is decide what your goal is. Are you only interested in capturing packets or you also want to analyze the captured packets?
An example of the first instance is the company I talked about above. At the time of capturing the packets, they were only interested in storing the packets for backup purposes to be used possibly for forensics or as a regulatory requirement. However, in a case like network troubleshooting, you want to capture the packets and also analyze them immediately to discover what the problem on the network is.
There are several tools that can be used to capture (and analyze) packets (Including Netflow and other flow protocols) and many of them rely on some form of pcap implementation to capture live network traffic. For Unix-based systems, the libpcap library is used while Windows uses a port of libpcap called WinPcap. There are still other implementations like Npcap and Win10Pcap.
Wireshark
The first on our list of tools is Wireshark, formerly known as Ethereal. Wireshark is probably the most famous packet capturing tool, also known as a network protocol analyzer because it goes beyond just capturing.
With Wireshark, you can capture packets on various media (Ethernet, wireless, etc.), analyze them, configure filters, search packets, and so on. Wireshark also has some cool advanced features like the ability to follow TCP streams, perform analysis on TCP, and reassemble packets.
Wireshark is GUI-based which may be an issue in cases where a GUI cannot be used, like on some Linux servers that are terminal-based. There are two ways to get around this issue. One way is to use another tool to capture the packets and then use Wireshark to analyze the captured packets (as long as the packets are stored in a file format readable by Wireshark, usually pcap).
The second way to get around the non-GUI issue with Wireshark is to use the terminal-based version of Wireshark called Tshark. It supports the same options as Wireshark and is not limited/inferior in any way.
tcpdump
An older tool than Wireshark itself is tcpdump which can also be used for packet capture and analysis. While Wireshark works across several operating systems including Windows, Mac and Unix-based systems, tcpdump works only on Unix-based systems (including Mac). Unlike Wireshark, tcpdump is strictly a command line tool and has very low overhead. This allows tcpdump to be run remotely over, say, an SSH login.
Note: There is a port of tcpdump called WinDump that works on Windows.
On the other hand, one advantage of Wireshark over tcpdump is the number of protocols that Wireshark can provide detailed information on. tcpdump is more focused on TCP/IP even though it can be used to capture all forms of packets. Therefore, some administrators prefer to use tcpdump to capture packets, save it as a pcap file, and then import into Wireshark for analysis.
Network Monitoring tools
Various Network Monitoring Tools like SolarWinds Network Performance Monitor also implement some form of packet capture which they use for their internal analysis. It does not seem like these tools provide the option of exporting the packet capture to be analyzed by other tools.
There are other packet capture tools like Colasoft Capsa, and some devices also implement an inbuilt packet capture feature (e.g. Cisco Embedded Packet Capture).
Packet Capture Considerations
To successfully perform a packet capture, there are a couple of things to be considered including what to capture, where to capture, and where to store the captured packets.
What to Capture
What packets do you intend to capture? Do you want packets only from/to the particular device on which the packet capture tool is running or you want to capture packets from other devices as well? The reason this is important is that most interfaces on a device will by default only provide the device with packets destined to that device (including multicast and broadcast). To capture packets meant for other devices, the interface must run in “promiscuous” mode (or “monitor” mode in the case of wireless).
It is important to note that some interfaces do not support promiscuous mode and even if they do, some operating systems do not support it.
Where to Capture
Even if an interface is placed in promiscuous mode, you may not be receiving traffic to/from other devices. This is especially true on switched networks. Unlike hubs which flood packets on all their interfaces (somewhat like Network traffic generators do), switches will usually ensure a packet is sent out only to the port to which the packet belongs.
This means that even if you connect the device on which the packet capture tool is running to a switch port and place the interface in promiscuous mode, you will not get packets destined to other devices.
A common way to overcome this issue is to configure something called “Port Mirroring”. With port mirroring, a switch can be configured to copy the packets on one interface/VLAN to another port, usually to which a device running a packet capture tool is connected.
Note: Different vendors use different terminologies for this feature including Port Mirroring, Switched Port Analyzer (SPAN), etc.
Storage concerns
The last factor to consider is where to store the captured packets. Depending on the size of the network segment to be captured on and how busy that segment is, the size of a packet capture can grow very quickly, into hundreds of Megabytes and even Gigabytes.
Several options exist to overcome this concern. Firstly, you can capture packets for a short period of time. Secondly, you can configure a filter to capture only a specific subset of packets e.g. only HTTP traffic to a particular web server.
Finally, you can use external storage drives to keep files of captured packets. This last option is especially useful for those that want to keep backups of all the traffic flowing through their network.
Lab: Wireshark in GNS3
Let’s see how useful Wireshark can be using a simple lab setup in GNS3:
To Follow along, Download GNS3 Free!

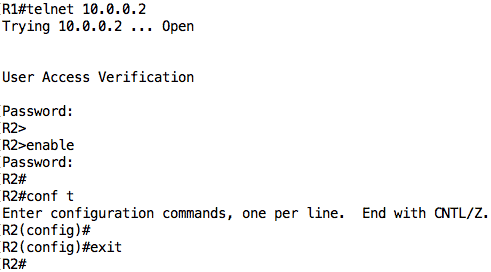
The configuration on the routers are very simple. R1 is configured with an IP address of 10.0.0.1 on its Fa0/0 interface while R2 is configured with an IP address of 10.0.0.2 on its Fa0/0 interface. There is also a VTY password of “cisco” configured on R2 along with an enable secret of “cisco”.
One of the really cool things about GNS3 is the ability to capture packets directly from GNS3 and see those packets in Wireshark.
Note: The GNS3 setup comes with a Wireshark setup included by default. However, I noticed that the Wireshark setup included in recent GNS3 Windows setup fails for some reason. If that happens to you, just download Wireshark and install it normally.
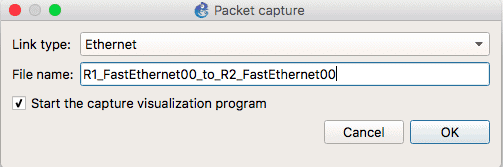
To capture in GNS3, right-click on the link you want to capture on and select “Start capture”. Accept the default in the dialog box that opens up or customize it as appropriate.

If everything goes well, Wireshark should automatically start and you should see packets being captured. We will now generate some packets between R1 and R2. Let us open a telnet connection from R1 to R2 and just play around a little (you can see some of the most common IOS Cisco commands here):
Now for the fun part. If you look at Wireshark, you should see some packets related to the telnet session you just did, packets like ARP, TCP, and Telnet.
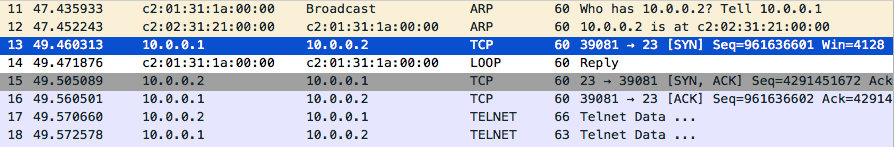
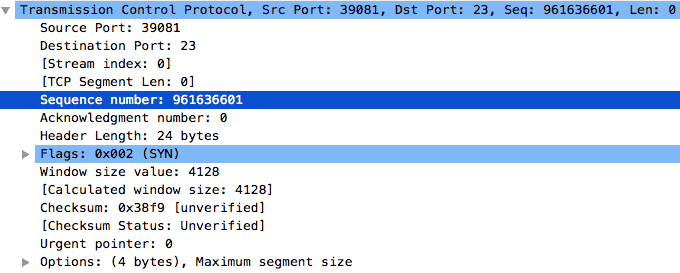
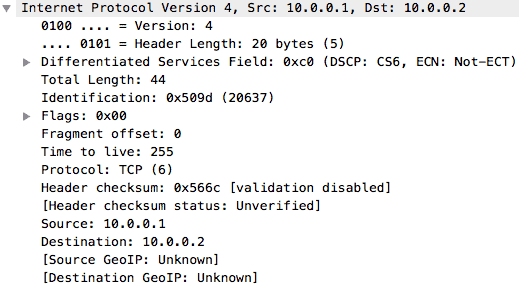
Let’s take a look at one of such packets e.g. the first TCP packet (part of the TCP handshake). The first thing you will notice is the encapsulation we talked about earlier in this article. The TCP data is encapsulated in an IP packet, which is encapsulated in an Ethernet frame, and finally sent out on the wire.

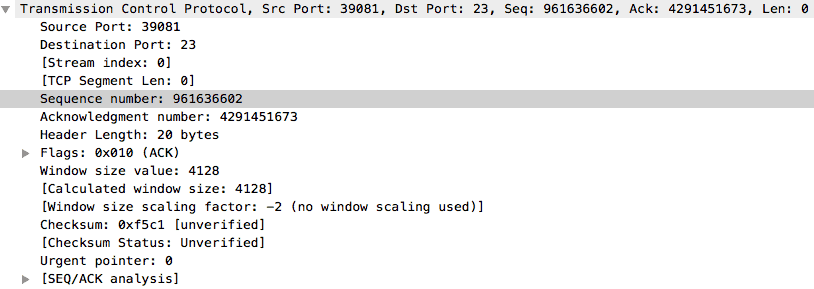
We can drill down into the details of the packet and take a look at each layer in the packet. First up is the TCP header. You can compare this to the TCP header as detailed in RFC 793 and it should be very similar.
A couple of things stand out like the destination port of 23 (Telnet), a randomly generated sequence number (961636601), and a header length of 24 bytes.
If we go to the Network layer, we can see the IPv4 header which shows the source and destination IP addresses, the protocol being carried, the header length, and so on.
Next is the Ethernet header which shows us the MAC addresses of the devices involved in this conversation, along with the EtherType.
Finally, we see the packet being sent out on the wire.
Do you remember when we talked about the TCP Handshake? Good. We have already seen the first packet which is a SYN packet. According to knowledge, the next packet should be a SYN+ACK packet with a random sequence number and an acknowledgment number which is 1 higher than the sequence number of the previous SYN packet i.e. 961636601 + 1.
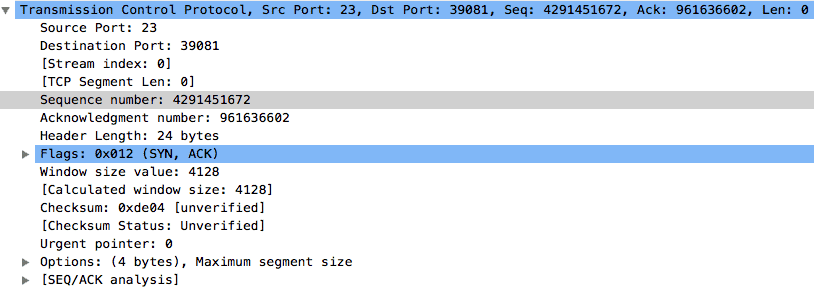
Finally, the last packet in the TCP Handshake should be an ACK packet with a sequence number equal to the acknowledgment number of the previous SYN+ACK packet, and an acknowledgment number which is 1 higher than the sequence number of the SYN+ACK packet.
As you can see, Wireshark can be helpful for understanding technical topics. However, let’s go a step further. Let us follow the TCP stream and see why you should be wary of Telnet.

As you can see, we are able to see the telnet and enable password in clear-text! This is one of the reasons why Telnet is not recommended as it is insecure except it is used over a secure medium such as a VPN tunnel.
Conclusion
This brings us to the end of this article where we have discussed packet capture and seen how it can be useful for learning, network troubleshooting, and investigating security incidents. We have also highlighted some tools that can be used for packet capture and analysis including Wireshark, tcpdump, and some network monitoring tools like SolarWinds NPM.
Finally, we looked at a simple lab in GNS3 and saw how Wireshark captures and analyzes packets.
Packet Capture FAQs
What are some common tools for packet capture?
- Wireshark: a popular open-source packet capture and analysis tool
- tcpdump: a command-line packet capture tool for Unix-based systems
- Microsoft Network Monitor: a packet capture tool for Windows-based systems
- SolarWinds Network Performance Monitor: a commercial packet capture and analysis tool
What are some common use cases for packet capture?
- Troubleshooting network issues and outages
- Detecting and analyzing security threats and breaches
- Performance tuning and optimization
- Compliance with regulatory requirements (such as HIPAA or GDPR)
How can I use packet capture for troubleshooting network issues?
You can use packet capture to identify the root cause of network issues such as slow performance, packet loss, or application failures. By capturing and analyzing network traffic, you can identify the source of the issue and take appropriate corrective action
How can I use packet capture for detecting security threats and breaches?
Packet capture can help you detect and analyze security threats such as malware, viruses, and unauthorized access attempts. By capturing and analyzing network traffic, you can identify patterns of suspicious activity and take appropriate remedial action.
How can I use packet capture for compliance with regulatory requirements?
Packet capture can help you demonstrate compliance with regulatory requirements such as HIPAA or GDPR by providing a record of network traffic and activity. By capturing and storing network traffic, you can show that you are taking appropriate measures to protect sensitive data and ensure the integrity of your network.
How do I get started with packet capture?
You can get started with packet capture by installing a packet capture tool such as Wireshark or tcpdump on your network, configuring it to capture traffic on specific interfaces or IP addresses, and analyzing the captured data using filters and analysis tools.
Related Post: Introduction to Supernetting


We'll setup the configuration as seen below: