
Our funding comes from our readers, and we may earn a commission if you make a purchase through the links on our website.
Linux Network Monitor Software & Tools for Managing & Monitoring Unix/Linux Systems!

UPDATED: January 9, 2024
Finding a Linux Network Monitor tool or Software package for your Critical servers and services that are running on those systems is one of the most (if not the most) important things you should have on your to-do list.
With the ever-growing need for high-performance Linux systems in our everyday network infrastructures, monitoring their network connections has become a priority for many of us network admins.
Here's our list of the Top Linux Network Monitor Tools & Software:
- NetFlow Traffic Analyzer by SolarWinds – EDITOR'S CHOICE A network bandwidth analyzer that can extract traffic data from switches and routers. Runs on Windows Server. Start a 30-day free trial.
- ManageEngine OpManager – FREE TRIAL A package of network and server monitoring tools that can operate across a network or even across the internet to monitor remote sites. Available for Windows Server and Linux. Download a 30-day free trial.
- Site24x7 – FREE TRIAL Excels in Linux network monitoring, offering a unified platform to monitor network performance, server health, and application performance in real-time. Its cloud-based nature is well-suited for the dynamic Linux environments, providing customizable dashboards, advanced alerting systems, and automated device discovery, all while eliminating the need for on-premise hardware. Start a 30-day free trial.
- Paessler PRTG Linux Network Monitor – FREE TRIAL A package of monitoring systems for networks, servers, and applications that can track network device health, traffic statistics, and Linux endpoint metrics over a network. Runs on Windows Server. Download a 30-day free trial.
- Zabbix A free monitoring system for networks, servers, and applications that can monitor on-premises resources and also cloud services. Available for Linux.
- Nagios Core A free monitoring system for networks, servers, and applications that can be extended by thousands of plugins. Runs on Linux or over a hypervisor on Windows.
- OpenNMS A free monitoring system for networks that runs on Linux hosts.
- Zenoss Core A free monitoring system for networks, servers, and applications that can be extended by Zen Packs and Nagios plugins. Runs on Linux.
- Cacti A free network monitor based around charts of network performance that are based on SNMP reports. Installs on Linux.
- ntopNG A free network monitoring system that is based on a packet sniffer. Available for Linux, FreeBSD, Windows, macOS, and RaspbianOS.
Some of these packages have other capabilities and options, such as monitoring Windows based servers as well as your Routers and Firewall devices. Click on their Official sites to read more about them.
Some critical Linux Network Services that you should consider monitoring include (but not limited too):
- Network Interfaces & Ports
- Critical Network Services (DNS, DHCP, Bindings, etc)
- Firewall/IPTable Logs/Rules
- Linux Web Server Services (Nginx/Apache, etc)
- Network Bandwidth
- Network Usage/Traffic Stats
- and much more!
Related Post: Best Network Traffic Generator and Stress Testing Tools
What should you look for in Linux network monitoring systems?
We reviewed the market for Linux monitoring tools and analyzed the options based on the following criteria:
- A package that will run on Linux or install on other operating systems but monitor Linux devices across a network
- A tool that includes a service for tracking endpoint performance
- A live display of all resource activity
- A tool that can monitor networks as well as Linux hosts
- Systems for network traffic analysis and network device performance monitoring
- A risk-free assessment period or a free tool
- Free tools that are worth installing or paid tools that offer value for money
With these selection criteria in mind, we have identified monitoring packages that can track the performance of networks and applications as well as endpoints.
The Best Linux Monitor Tools & Software
1. NetFlow Traffic Analyzer – FREE TRIAL
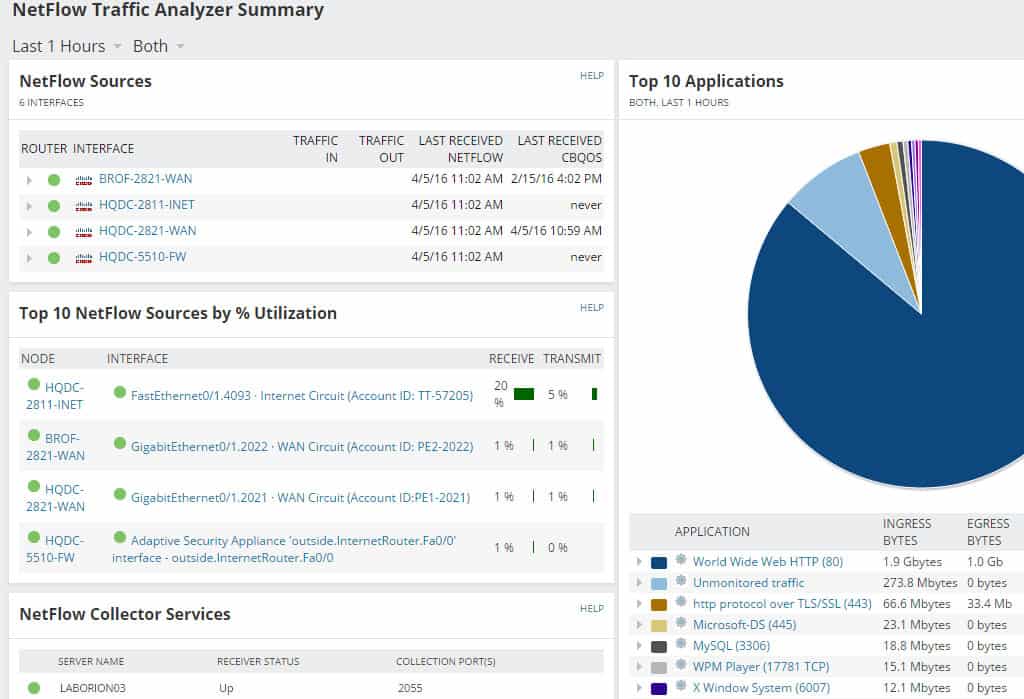
SolarWinds creates a suite of complete network monitoring and management software. Among their products, NetFlow is one of the most popular. Netflow Traffic Analyzer (NTA) is a complete traffic diagnostic and bandwidth monitoring software.
Key Features
- Support VMware vSphere Distributed Switch (VDS)
- Track bandwidth usage and analyze which applications consume the most
- Collects data and provides clear visibility into network traffic
- Allows assigning particular applications the right levels of service
- Users can view and report on historical as well as real-time network traffic data with NTA
- The user device tracker helps discover traffic patterns and avoid bottlenecks
Why do we recommend it?
The tool makes it easier to keep track of bandwidth usage, incoming/outgoing traffic, and network congestion in real-time. Further, it supports NetFlow, Huawei Netstream, and other technologies that ease the communication process with network devices.
The tool allows you to monitor your Linux-based network, find new traffic patterns and avoid bandwidth hogs using NTA with a User Device Tracker. The best thing about this tool is that it can analyze your network in real-time down to the interface level.
Who is it recommended for?
Organizations that handle large volumes of data can make the best use of this tool. However, NTA is not a great option for home users or small LANs.
Pros:
- Excellent user interface, easy to navigate and remains uncluttered even when used on high volume networks
- Supports multiple networking technologies such as Cisco Netflow, Juniper Networks J-Flow, and Huawei Netstream, making it a hardware-agnostic solution
- Pre-built templates allow you to pull insights from packet capture right away
- Installs on Windows as well as on multiple flavors of Linux
- Built for the enterprise, offers SLA tracking and monitoring features
Cons:
- Built for enterprise companies who process a lot of data, not the best fit for small LANs or home users
Official Website: https://www.solarwinds.com/netflow-traffic-analyzer
Download a 30-day free trial: https://www.solarwinds.com/netflow-traffic-analyzer/registration
EDITOR'S CHOICE
SolarWinds NetFlow Traffic Analyzer is our top pick for a network monitoring software package because it communicates with network devices using NetFlow but it also has the capabilities of using IPFIX, J-Flow, sFlow, and NetStream. This comprehensive package can even communicate with VMWare vSwitches to gather statistics on performance. The 30-day free trial shows that SolarWinds is confident this tool will win in head-to-head real-world comparisons.
Download: Start 30-day Free Trial
Official Site: solarwinds.com/netflow-traffic-analyzer/registration
OS: Windows Server
2. ManageEngine OpManager – FREE TRIAL
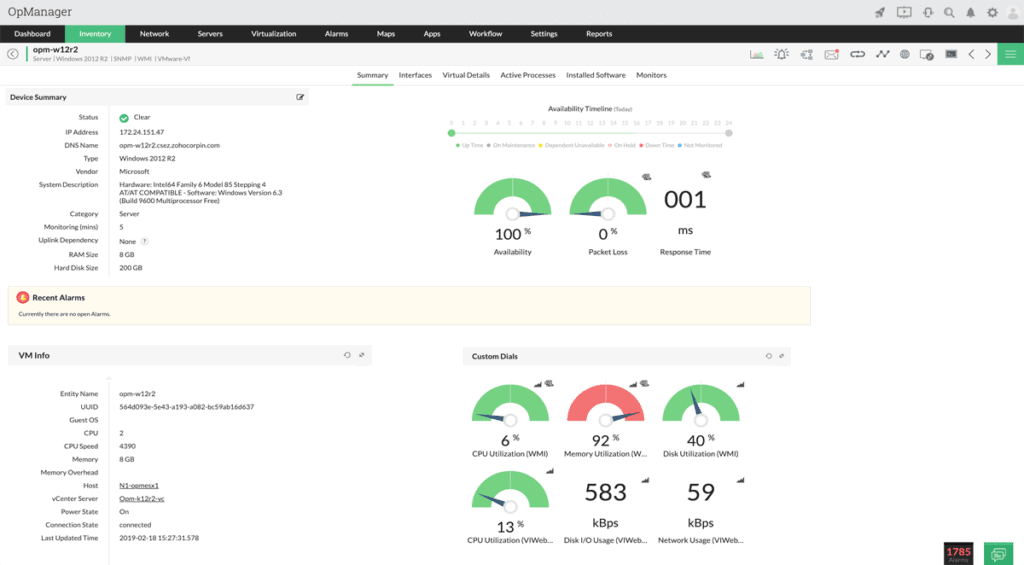
ManageEngine OpManager tool is a great all-around monitoring tool that you can implement into a Windows or Linux network infrastructure!
This tool provides deep insights in your Linux Servers and Machines and allows you to monitor them quickly and efficiently within one single dashboard!
Get a thorough and deep analysis of your Linux systems, as well as monitor major interfaces and system vitals from one location
Key Features
- Real-Time Performance and Network Monitoring
- Monitor Physical & Virtual Servers
- Monitor Perimeter WAN Links
- Customize Dashboards and more!
- Setup Alerting and Reports
- Monitor Vital Hardware Components and More!
Why do we recommend it?
The powerful tool offers deep visibility into network components that help identify any connected devices, map them, and watch over resources on different servers all at the same time. Further, it comes with various advanced features, such as an intelligent alert system, autodiscovery, and traffic management options.
Who is it recommended for?
If you are not looking for a SaaS package but a bundle of software for Linux or Windows Server, go for ManageEngine OpManager. It even offers access to the free edition that allows for monitoring Ping-based availability.
Pros:
- Designed to work right away, features over 200 customizable widgets to build unique dashboards and reports
- Features traffic management options alongside DPI tools
- Uses intelligent alerting to reduce false positives and eliminate alert fatigue across larger networks
- Supports email, SMS, and webhook for numerous alerting channels
- Can set up SLAs based on network, application, or process
Cons:
- Is a feature-rich tool that will require a time investment to properly learn
Click the Link below to download now and get started monitoring your infrastructure within hours with a 30-day free trial download!
Download: https://www.manageengine.com/network-monitoring/
3. Site24x7 – FREE TRIAL
In the realm of Linux network monitoring, Site24x7 stands out as a comprehensive and versatile tool. It seamlessly fits into the context of Linux network monitoring by offering a unified solution to track network performance, server health, and application performance in real-time. This cloud-based platform is particularly adept at catering to the dynamic and diverse environments characteristic of Linux systems, ensuring that network administrators can efficiently monitor their infrastructure without the hassle of managing on-premise hardware.
Key Features
- Monitors network, server, and application performance in a unified platform
- Provides customizable dashboards for real-time data visualization and analytics
- Offers an advanced alerting system that minimizes false positives
- Automatically discovers and maps network devices for easier management
- Eliminates the need for on-premise hardware, facilitating remote monitoring
Why do we recommend it?
Site24x7 is recommended for its ability to deliver an all-in-one monitoring solution that is both scalable and user-friendly. Its cloud-based nature ensures easy deployment and maintenance, making it an ideal choice for diverse Linux environments.
Who is it recommended for?
Site24x7 is ideal for network administrators and IT professionals who manage complex Linux-based networks. Its comprehensive monitoring capabilities make it suitable for organizations of all sizes, particularly those looking for a cloud-based solution to monitor multiple network components.
Pros:
- Extensive monitoring capabilities across network, server, and applications
- User-friendly interface with customizable dashboards for better data visualization
- Cloud-based, ensuring easy deployment and scalability
Cons:
- May require a learning curve for users new to network monitoring tools
4. Paessler PRTG Linux Network Monitor – FREE TRIAL
PRTG (Paessler Router Traffic Grapher) creates innovative and easy-to-use network and bandwidth monitoring software. PRTG Network Monitor can manage Linux-based networks in a secure and efficient way.
Key Features
- Automated alerts on exceeding threshold value or bandwidth overloading
- Updates about Linux network performance status in real-time
- Critical weak point discovery
- Monitor free disk space and memory error
- Supports pre-configured device templates
Why do we recommend it?
Users can choose from the wide range of services provided by Paessler PRTG, i.e., monitoring networks, virtualizations, applications, servers, and endpoints. Based on the requirement, a user can activate any particular package and tailor the service. It helps stabilize the network and supports integration for alert systems and different channels.
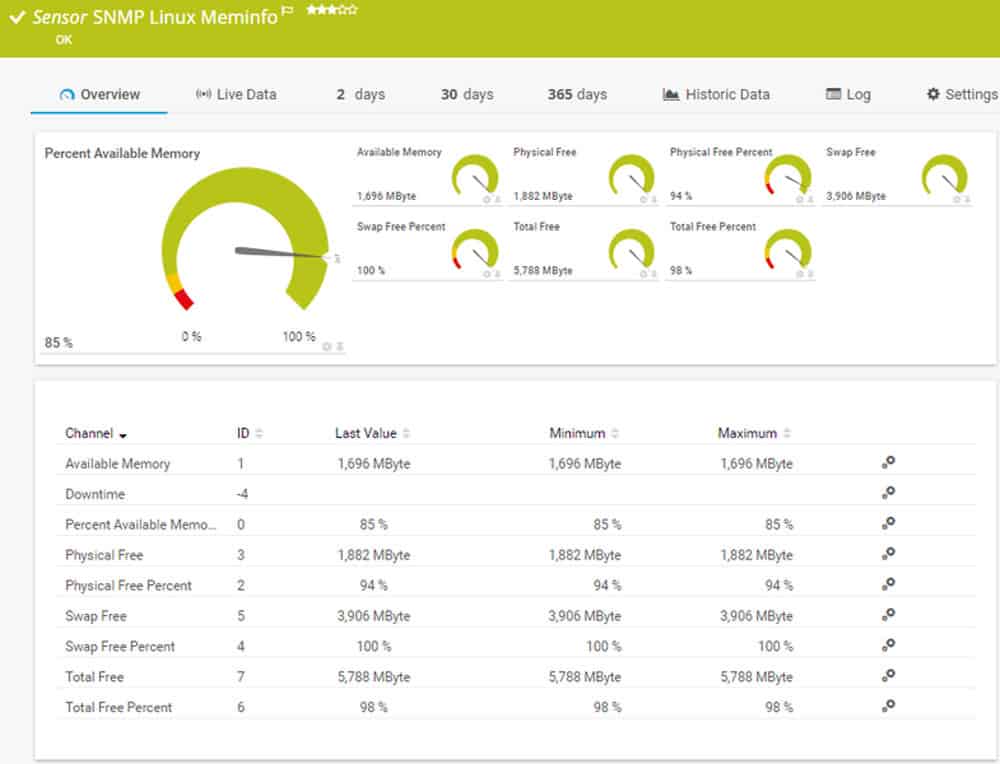
The PRTG dashboard displays an overview of the status of your Linux network. It also shows the performance, hard drives, memory and NTP.
With PRTG, you can define threshold values for certain parameters such as bandwidth, and set automatic notifications when those values are exceeded.
Who is it recommended for?
Businesses of all sizes can invest in the tool and activate the package as per their requirement. As a result, they won't have to pay for any additional service that they do not require and eliminate from the package. Also, if they merely activate 100 sensors, the package is free of charge.
Pros:
- Designed to be an infrastructure monitoring tool that supports multiple sensor types such as NetFlow, sFlow, and J-Flow
- Offers additional monitoring on the same platform, supporting infrastructure, network, and application performance monitoring
- Supports multiple channels and integrations for alerts
- Uses easy-to-read graphing for traffic visualization
Cons:
- Very detailed platform takes time to learn and fully utilize all of the features available
Official Website: https://www.paessler.com/linux_network_monitoring
Download 30-day FREE Trial: https://www.paessler.com/download/prtg-download
5. Zabbix

Zabbix is an enterprise-type open source advanced network and application monitoring solution that handles millions of different metrics. It can be used in your Linux servers, network devices, and network services. Zabbix is commonly known for being easy to install, configure and use.
Key Features
- Track network performance and bandwidth usage
- SNMP metrics monitoring
- Integrated Alert System
- Monitor Device uptime
- CPU and memory insights
- Automated Network Device Discovery
Why do we recommend it?
With the open-source tool, users can keep track of all their network metrics which aids businesses in delivering better network performance. Apart from tracking the traffic and bandwidth usage, users can keep watch on packet loss, interface speed, TCP connections, and other SNMP metrics.
This tool is based on a server-agent system; You install the agent on a client and this is monitored by the Zabbix Server. All the data is gathered by the Zabbix agent running on the host and sent over to the server, where it is stored in a relational database.
Who is it recommended for?
Small businesses or startup companies tight on budget might find Zabbix a useful tool. Subscriptions to professional support packages are also available for big corporations. Additionally, employees can use the system with Linux, Docker as well as cloud platforms.
Pros:
- Open-source transparent tool
- Uses both SNMP and IPMP for a broader monitoring range
- Can detect new devices and configuration changes immediately
- Offers useful templates for quick insights
- Robust notification system supports SMS, email, custom script, and webhook
Cons:
- Could use updated and modernized
- Would like to see better-alerting features, specifically more intelligent alerting features
Official Website: https://www.zabbix.com/
Download: https://www.zabbix.com/download
6. Nagios Core
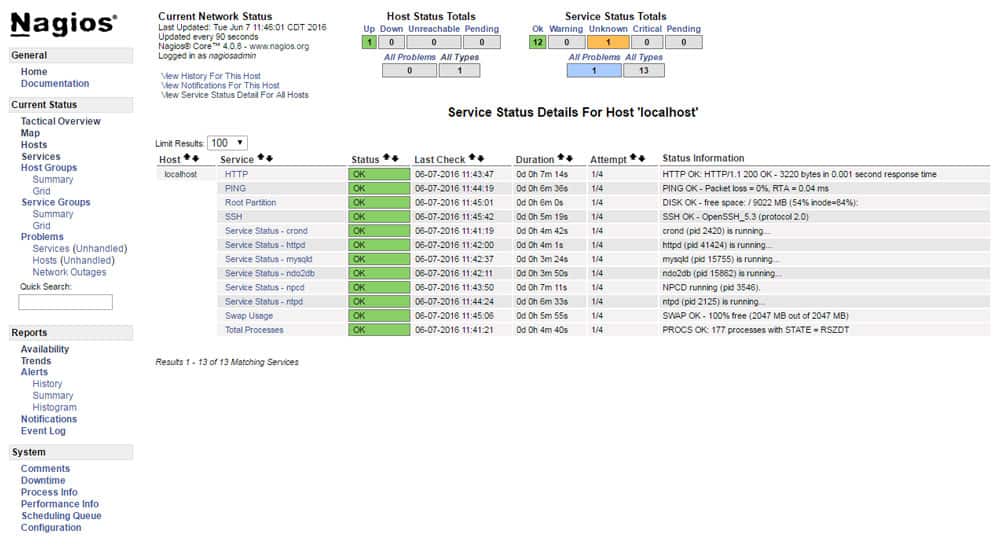
Nagios is a 100% free and open-source tool used for monitoring infrastructure, networks, and systems. When monitoring elements, Nagios Core can schedule events, process the events, and alert when a certain threshold is reached.
Key Features
- Nagios Core offers API support
- Robust monitoring options
- Frontend configurations and setups
- Performance Graphing
- Distributed Monitoring
Why do we recommend it?
Nagios Core comes with advanced monitoring capabilities that help businesses track network problems and other connected devices to the network. Users can gain quick insights into the response time, uptime, and network availability with the tool. Further, it supports flexible alert features.
When comparing with other monitoring tools, Nagios Core has been designed especially for flexibility and scalability. The provided APIs allow easy expandability through the use of additional add-ons and plug-ins. Another benefit is that Nagios Core also offers forum support for free.
Who is it recommended for?
Non-technical users might find it a bit challenging as the installation process is complex and requires expertise. Apart from Linux, Windows users can also use the open-source tool for monitoring network infrastructure.
Pros:
- Open-source transparent tool
- Simple, yet informative interface
- Flexible alerting options support SMS and email
- Available on both Windows and Linux operating systems
Cons:
- Open-source version lacks quality support found in paid products
- Installation can be technical and complex
Official Website: https://www.nagios.org/projects/nagios-core/
Download: https://www.nagios.org/downloads/nagios-core/
7. OpenNMS
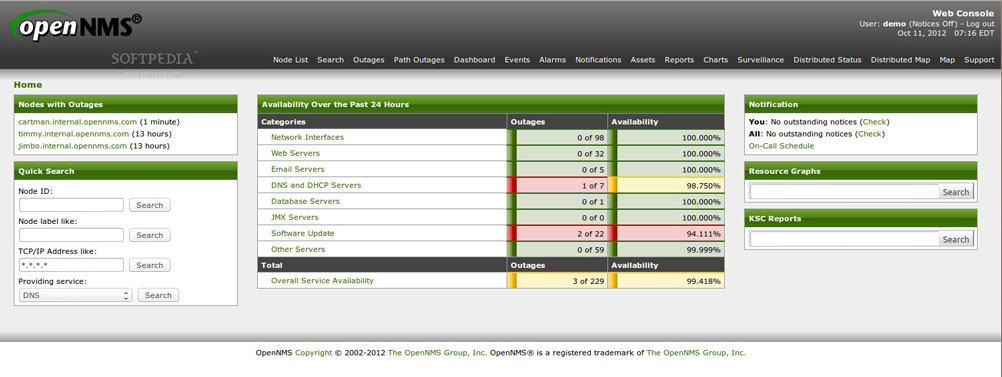
OpenNMS is a free and open source network management system that monitors Linux servers, applications, and services. The tool is useful when initially installed but it can be highly customized to work in different network environments.
Key Features
- Proper network traffic monitoring and analysis
- Large community support is available for users
- Flexible alert and workflow integrations
- Substantial amount of documentation is available
Why do we recommend it?
With OpenNMS, organizations can visualize and keep a better track of the performance and traffic of distributed networks. It supports different data collection protocols and integrates well with core business applications.
As soon as a new device enters the network, the auto-discovery function will add it to the management system. OpenNMS can be configured to raise alarms and/or notify its users through emails, SMS, or XMPP when an event occurs.
Who is it recommended for?
The open-source tool is a highly scalable and extensible network monitoring solution for both local and distributed networks. Even non-technical users can benefit from the tool thanks to its large community of users and support documentation available for guidance.
Pros:
- Open source projects, lots of room for customization, and personalized add-ons
- Has a large amount of documentation available
- Features two versions, a stable version and a beta test version for new features
- Offers a wide range of monitoring options and flexible alert notifications
Cons:
- Is more complicated to set up than paid tools that focus on streamlining the onboarding process
- Users rely on help documents and forums for support, which isn’t always the quickest way to resolve issues
- It can take a long time to get things working the way you want them on the platform
Official Website: https://www.opennms.org/
Download: https://www.opennms.org/en/install
Related Post: Best Open Source NMS Software and Tools
8. Zenoss Core
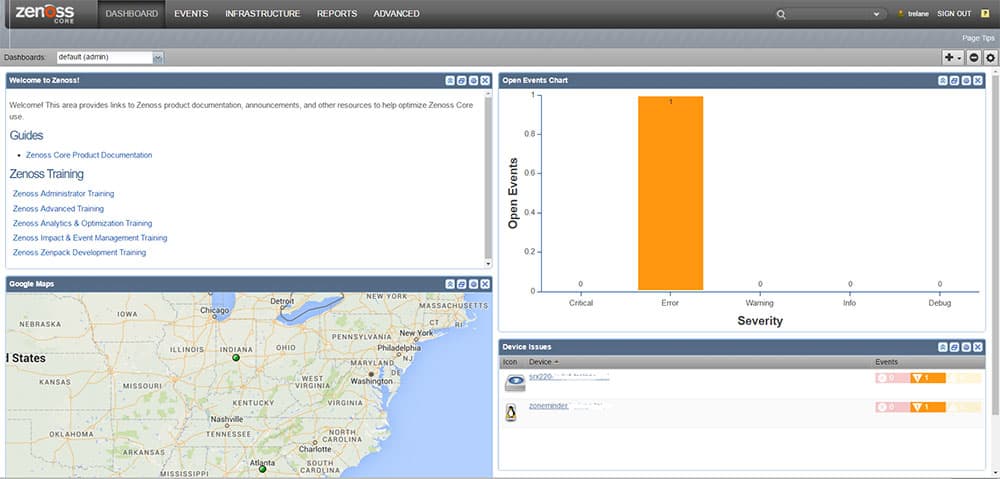
It is a free and open-source basic network monitoring software especially for small to medium businesses. The software can be used to manage up to 500 devices through its web interface. The administrator can monitor the network’s availability, configuration, inventory, performance, and events.
Key Features
- Monitor 500+ devices and network availability
- Provides access to Performance metrics insights
- Supports cloud and on-premises systems
- Auto-discovery features are available
Why do we recommend it?
No matter which protocol or technology your business relies on, Zenoss offers a network solution that provides insights into all performance metrics. With real-time IT service modeling and visibility into physical and virtual network components, Zenoss Cloud streamlines your monitoring onto a single platform.
When initially setting up the tool, or when bringing a new device into the network, Zenoss Core has the ability to auto-discover the new element including (device, server, OS, configuration, application, and process), and update the inventory accordingly.
Who is it recommended for?
SMBs might find it a suitable option as it allows businesses to monitor 500 devices free of charge. Also, it comes with community support that might provide SMBs with better assistance and collaboration options.
Pros:
- Open-source, completely free tool with two paid options
- Uses network discovery to automatically pull in new devices that enter the network
- Can support multi-site networks encompassing both LAN and WAN
Cons:
- Support only for paid tiers
- Dashboard interface needs improvement, specifically the nested menu options on the home screen
- Free version is limited to 100 devices
Official Website: https://www.zenoss.com/get-started
Download: https://www.zenoss.com/get-started
9. Cacti
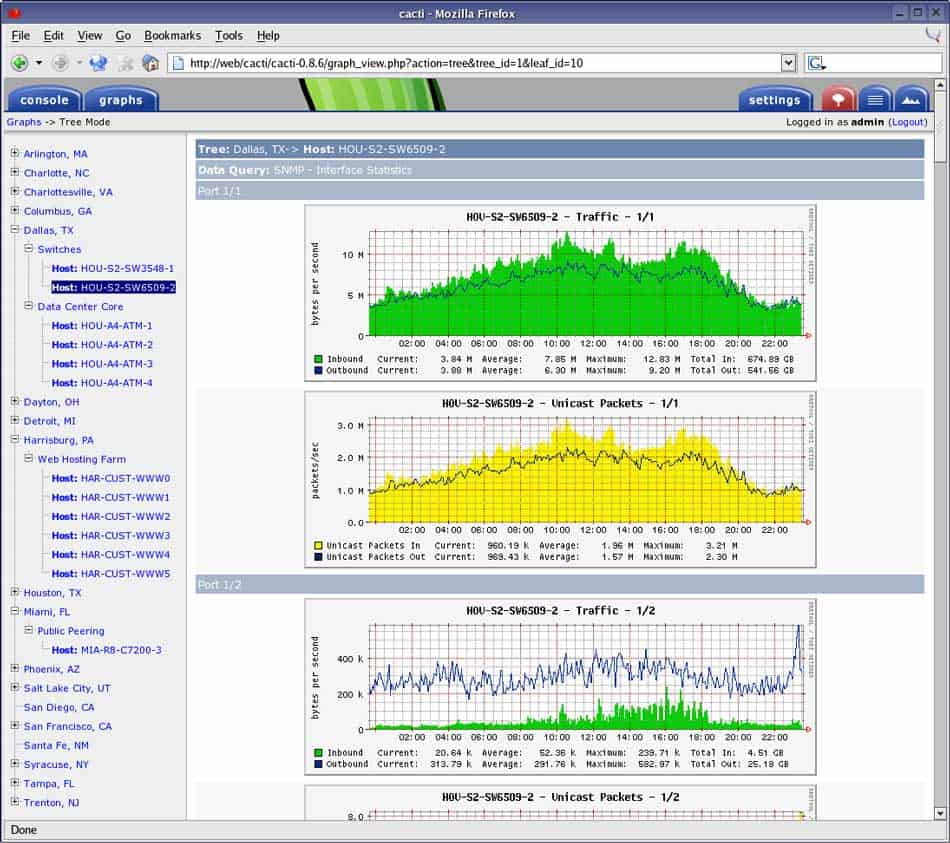
A comprehensive open-source network graphing and web-based monitoring tool, designed to be the front-end application for data storage tool, RDDTool. Among the most important features of Cacti, are its adjustable fast poller and the graph of the resulting data based on templates.
Key Features
- Large community for guidance
- Adjustable fast poller
- Open-source tool with a simple interface
Why do we recommend it?
With Cacti, users can keep track of all the network data and graph over time its usage and speed. This free network monitoring tool further helps analyze the behavior of performance variables over time.
The user interface makes it easy to manage small-medium and large networks. Cacti is commonly used to graph metrics that are based on time, like network utilization and CPU load.
Who is it recommended for?
Both small and large networks can use the open-source tool for monitoring and data storage purposes. It lacks a few paid support options but is a great choice for web-based monitoring and tracking traffic over time.
Pros:
- Highly customizable monitor with a focus on data visualization
- Large dedicated community of over 20,000 members
- Simple interface
- Ideal for researchers looking for more flexibility in their data collection
Cons:
- Has a steer learning curve than competing products
- Like most open source products, Cacti lacks a paid support option
Official Website: https://www.cacti.net/
Download: https://cacti.net/download_cacti.php
10. ntopng
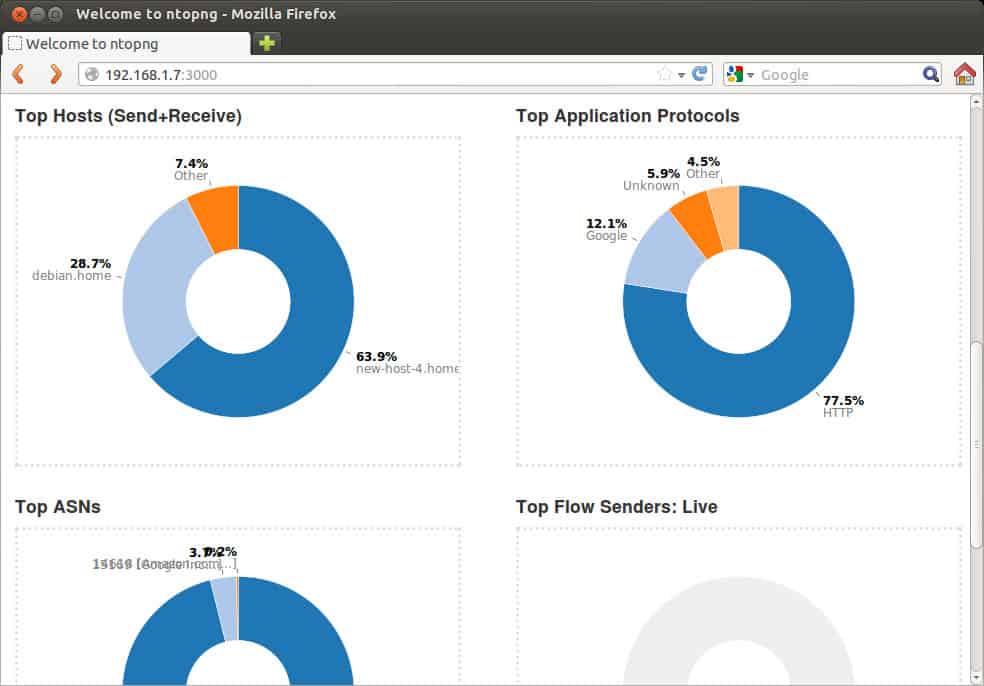
It is an open-source, high-speed web-based traffic analyzer, and security monitoring software. ntopng is the next-generation version of ntop (from 1998), now renovated with higher performance, more usability and better features.
Key Features
- Deep browsing capabilities
- Sort and filter traffic options
- Supports a wide range of protocols
Why do we recommend it?
ntopng is a powerful tool that allows users to monitor network devices and traffic by capturing all data from different sources. It is a transparent tool that further enables team members to view and browse through historic as well as real-time data.
This tool allows deep browsing of the historic and real-time traffic information from its encrypted web user interface. ntopng is a top player for traffic analysis because it can allow you sort out traffic according to different criteria, such as IP, Port, Layer 7 protocol, bandwidth and traffic Throughput, and AS (Autonomous System), among many other features.
Who is it recommended for?
Larger multi-site networks might not find ntopng a best suit as it comes with limited packet capturing features and scalability issues. Also, the configuration process can be a bit complex for multiple sites. However, it is quite different in the case of SMBs and smaller networks.
Pros:
- Open-source project with full transparency
- Free version available alongside the enterprise version
- Special licensing options for nonprofits and educational institutions
Cons:
- Not the best option for larger multi-site networks
- Packet capture features are a bit limited
- User interface is easy to use, but could be improved upon
Official Website: https://www.ntop.org/products/traffic-analysis/ntop/
Download: https://www.ntop.org/get-started/download/
11. Htop
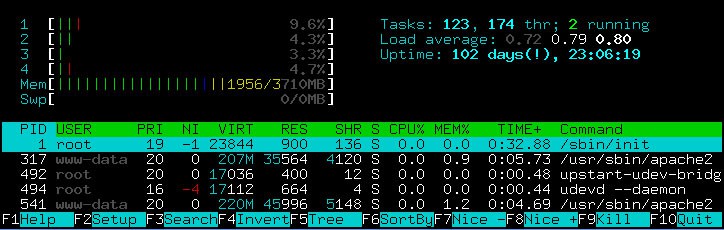
Htop is a project by Hisham Muhammad. It is an interactive process viewer and manager for Unix systems. Htop was designed to be an alternative for the UNIX program top (Table of Process Tool). Htop is a more advanced process tracking Linux tool than “top”, because it is more complete, interactive and in real-time.
Key Features
- Clear visibility and intuitive interface
- Filtering options are supported
- Identify and troubleshoot issues
Why do we recommend it?
The text-mode application displays all resource consumption statistics using color-coded visuals. It even comes with an intuitive interface that makes it easy for businesses to manipulate processes.
This tool has an easy to use UI for managing processes, vertical and horizontal viewing of processes, shortcut keys, etc.
Who is it recommended for?
Linux and Unix users can run the tool to view and manage system performance and resources. Its intuitive interface and management features make it a great option for DevOps professionals and administrators who are looking for a powerful solution.
Official Website: http://hisham.hm/htop/
Download: http://hisham.hm/htop/index.php?page=downloads
12. ibMonitor
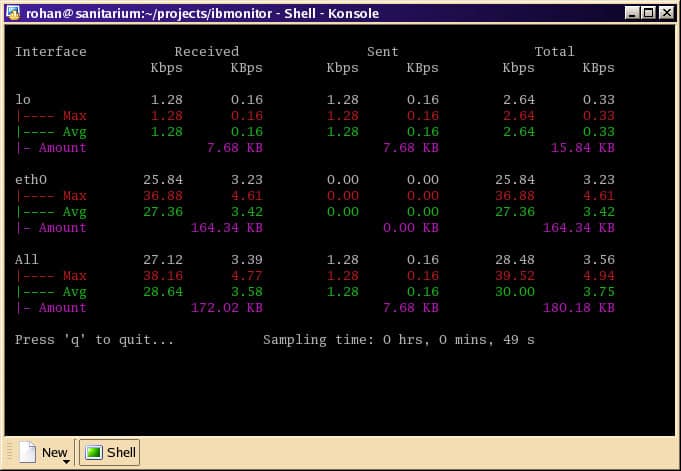
It is an interactive Linux bandwidth monitor which gives you access to real-time statistics on the utilization of the network. The tool is not graphical; it works through a console app with a CLI.
It is commonly used to view received, sent and the total bandwidth of each network interface in a Linux system, in KBps or Kbps. It can also determine and show the added value of all the interfaces.
Key Features
- Offers real-time statistics on network usage
- Allows tracking bandwidth consumption on every interface
- Displays data transfer attribute in KB/MB/GB
Why do we recommend it?
Businesses can gain a quick update on the network usage stats with ibMonitor. It is scalable and capable of discovering potential threats and responding to them. Further, if it notices any unusual behavior or traffic pattern, it will send an immediate alert to admins.
Who is it recommended for?
IT professionals and DevOps teams can use the tool to track the bandwidth consumption and display the total amount of data transferred across all interfaces.
Official Website: http://ibmonitor.sourceforge.net/
Download: http://ibmonitor.sourceforge.net/download.html
13. bwm-ng:
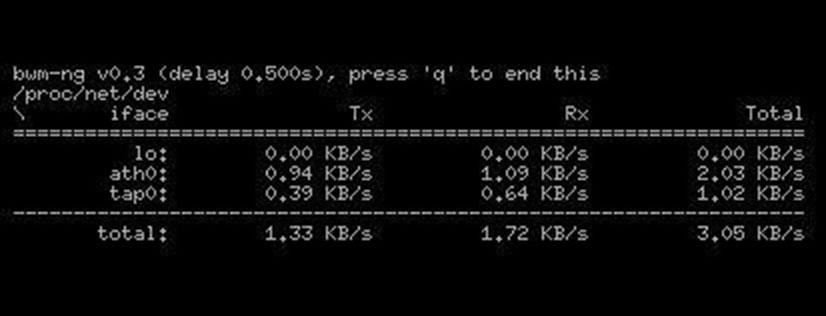
Bandwidth Monitor NG (Next Generation) is an upgrade of the old “bwm” which was too simple and had many problems with modern and fast interfaces. Bwm-ng is basically an easy-to-use network bandwidth and Disk I/O monitoring console with real-time network and disk information for Linux (and other UNIX distributions).
Key Features
- Custom display formats
- Filter traffic and monitor specific addresses
- Minimal resource usage
Why do we recommend it?
The upgraded version of bwm is easy to use and supports several interfaces. You can customize the display formats, color-code the network traffic representation, and filter traffic for detailed analysis.
This tool is pretty straightforward; the installation is a 2-minute process and the CLI very easy to use. You can display the output information in KBps, MBps, packets, errors, avg, max and total sum.
Who is it recommended for?
Linux, BSD, Solaris, and Mac OS X users can use the console-based live network monitoring tool for tracking errors and packets. It is easy to install and comes with various customizable display options.
Official Website: http://sourceforge.net/projects/bwmng/
Download: https://sourceforge.net/projects/bwmng/files/latest/download
14. Dstat
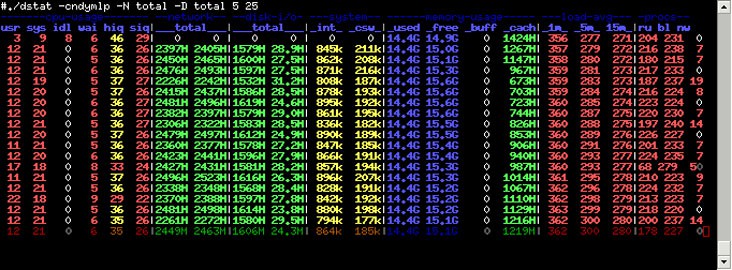
It is a monitoring tool for overseeing network, memory, utilization and processing performance of a Linux system. Dstat is an adjustable metrics tool. It basically combines the power of traditional Linux system components, vmstat, iostat, netstat, and ifstat.
Key Features
- Displays statistics within the exact same time frame
- Modular design and extensible
- Supports external plugins
Why do we recommend it?
Get a quick review of all the system resources in real-time with Dstat. Users can even color-code outputs and watch over different metrics on a single screen for quick analysis.
Dstat overcomes the weaknesses of all these components and improves the performance with more metric counters and flexibility (with external plugins). An improvement is that this tool can allow you to view the resources in real-time.
Who is it recommended for?
DevOps and system administrators can invest in the extensible tool that will help fulfill all the monitoring requirements of diverse applications.
Official Website: http://dag.wiee.rs/home-made/dstat/
Download: http://dag.wiee.rs/home-made/dstat/#download
15. Monitorix
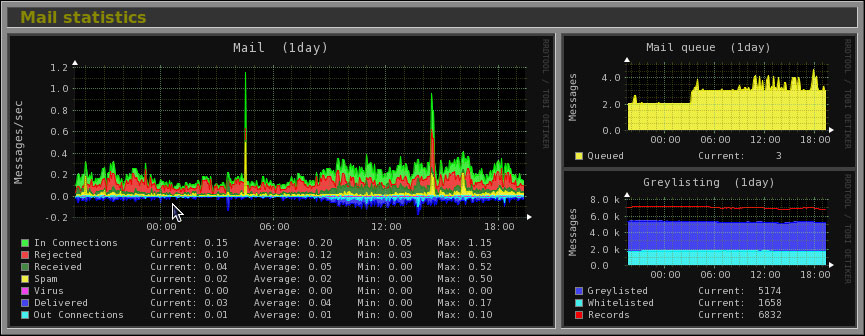
It is a free and open source network monitoring tool which periodically checks services and system resources and uses its web interface to display the data in graphs.
Key Features
- Monitoring of network resources in real-time
- Track multiple servers from a single console
- Stores historical information for analysis
Why do we recommend it?
Monitorix is a lightweight system monitoring tool with which you can discover all traffic bottlenecks, failures, and other issues that might affect your system performance. It has a built-in HTTP server that helps view statistics graphs.
With Monitorix you can check overall system performance, find traffic bottlenecks, and flow failures. The tool is ultra-light so it can be used in embedded devices to monitor as many system resources as it can.
Who is it recommended for?
It is a free tool that works well on embedded devices. In fact, SMBs and IT managers can make the best use of it for comprehensive monitoring of their server infrastructure.
Official Website: http://www.monitorix.org/
Download: https://www.monitorix.org/downloads.html
16. IPTraf
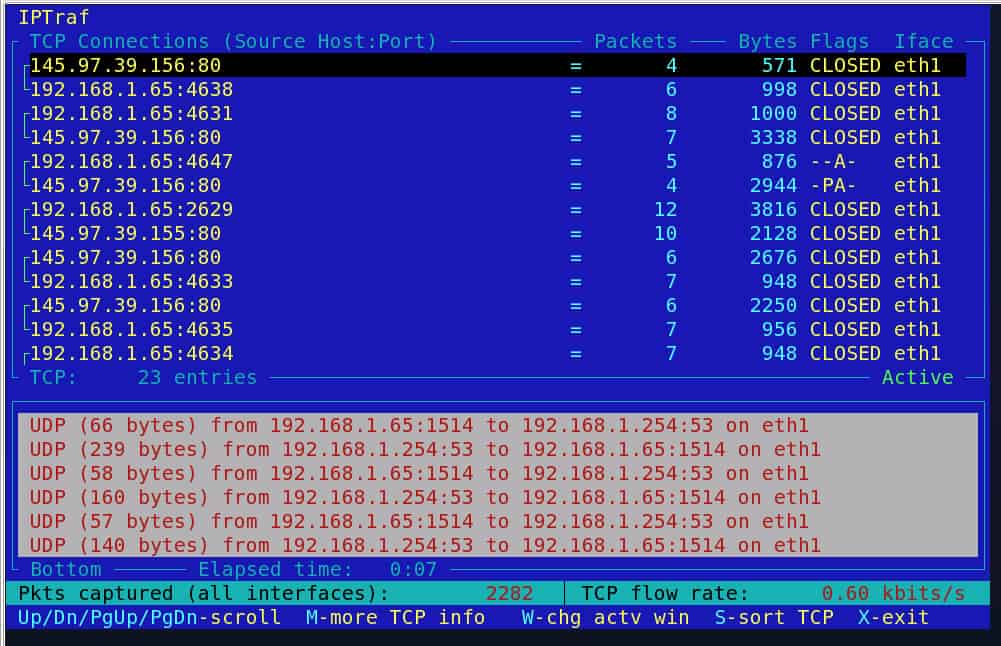
It is an open source and simple CLI network monitoring tool that provides statistics of Linux systems. With IPTraf you can oversee inbound and outbound connections of traffic passing through a network interface.
Key Features
- It allows the creating network statistics logs for future analysis
- Filter options are available with IPTraf
- Supports a wide range of network protocols
Why do we recommend it?
Get detailed statistics in real-time for Linux systems with IPTraf. The user-friendly console-based interface provides quick insights into inbound as well as outbound traffic and their connections.
IPTraf works by gathering interface information and showing the detailed statistics of IP, TCP, UDP, packet size, counts, and IP checksum errors. You can also monitor other information such as ICMP details and OSPF packet types.
Who is it recommended for?
IT Professionals and Network administrators can use the tool for monitoring and troubleshooting issues in real-time as well as detect potential security threats.
Official Website: http://iptraf.seul.org/
Download: http://iptraf.seul.org/download.html
17. vnStat
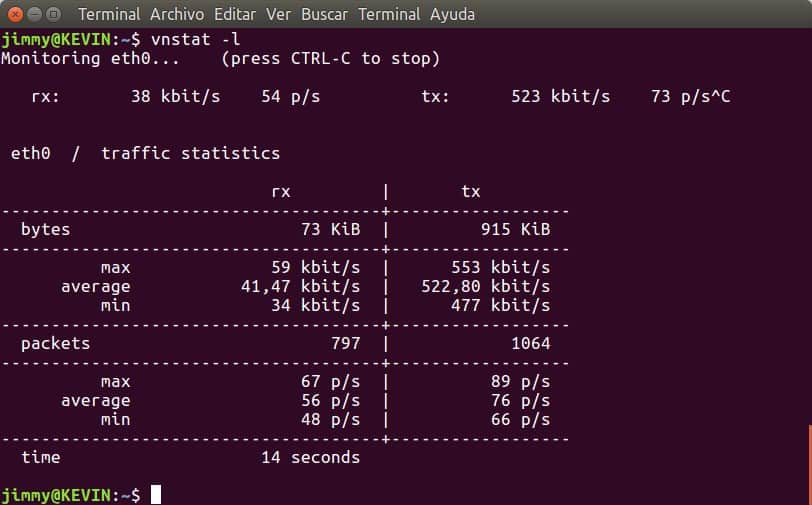
It is an open source CLI Linux/BSD utility used to monitor and store network statistics. vnStat can monitor traffic and keep logs of a specific interface. The tool is popular because it is ultra-light and consumes light resources to run. It is also easy to install and use.
Key Features
- Supports color configuration editor
- Track several interfaces simultaneously
- Lightweight and open-source tool
Why do we recommend it?
With the help of this Linux monitoring tool, you can watch over all the network traffic for the chosen interface and store all the stats. Regardless of the rate of network traffic, this guarantees that vnStat will not actually be sniffing any traffic and will only use minimal system resources.
VnStat can monitor many interfaces at the same time and collect statistics accordingly. There are multiple output options, like summary, time-based, or image.
Who is it recommended for?
The versatile, lightweight tool is a perfect option for businesses with complex network configurations that require persistent storage.
Official Website: http://humdi.net/vnstat/
Download: https://humdi.net/vnstat/
18. Iftop
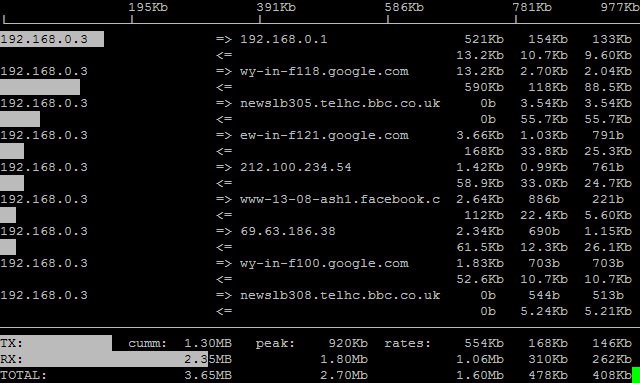
It is a free and open source CLI monitoring UNIX tool that generates an updated list of the network interfaces and its connections. Iftop listens to traffic on an interface (or all interfaces) and displays the bandwidth usage on each one.
Key Features
- You can represent collected network traffic stats with color codes
- Support network traffic filters
- Bandwidth monitoring and usage display
Why do we recommend it?
Iftop is an efficient solution that helps track bandwidth usage on a network and activities in real-time. Additionally, it is lightweight and displays all the traffic using color-coded bars that help quickly spot issues.
To run iftop you require libpcap, libcurses, and sufficient permissions. You can create filters to show determined output information. For example, Iftop by default will display Hostname information on all packets, but you can remove DNS information by creating a filter code.
Who is it recommended for?
Organizations looking for a free tool that helps collect all information related to the network infrastructure and their connections might find Iftop a suitable option. All Linux and Unix Users can invest in the tool to gain quick insights into network traffic patterns and troubleshoot issues quickly.
Official Website: http://www.ex-parrot.com/pdw/iftop/
Download: http://www.ex-parrot.com/pdw/iftop/
19. EtherApe
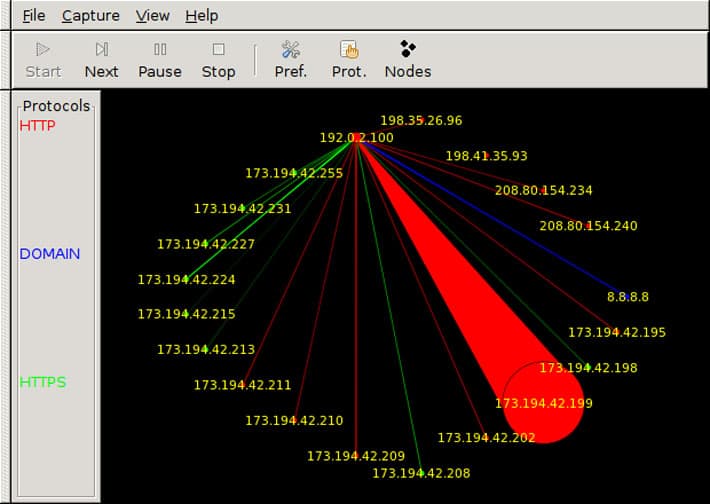
It is a free and open-source graphical network monitoring software developed especially for UNIX systems. It graphically displays layer 2, 3 and 4 (Data Link, IP, and TCP/UDP) activity. In the graphical interface, each host is represented by a node and the connections by links.
Key Features
- Graphically represents data flow between devices
- Protocol-based traffic display
- Spots anomalies and suspicious traffic pattern
- Network troubleshooting and analysis
Why do we recommend it?
EtherApe provides a visual representation of network traffic and different OSI model layers in real time. It even helps filter traffic and graphically represent the relationship between devices to network administrators.
The different types of traffic on a network are generated by different protocols so EtherApe color codes each node and links differently according to the protocol. The nodes and links grow and shrink dynamically to represent an increase or decrease in the traffic volume.
Who is it recommended for?
IT professionals and network administrators who require a visual tool for displaying all their network monitoring data can go in for EtherApe.
Official Website: https://etherape.sourceforge.io/
Download: https://etherape.sourceforge.io/download.html#binaries
20. RRDtool
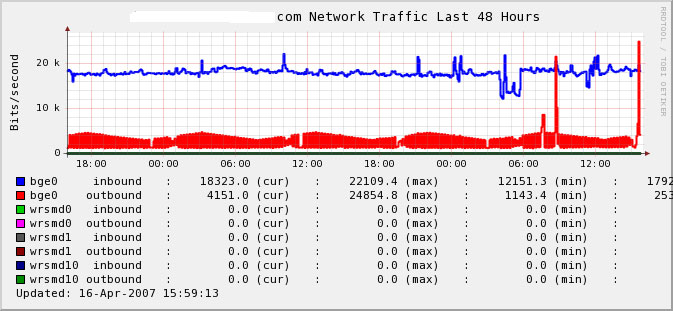
It is an open-source high-performance logging and graphing tool, used for time series data, like network bandwidth and CPU load. RRDTool stands for “Round-Robin Database Tool”, because it stores the data in a circular buffer, making it a very efficient storage system.
Key Features
- Stores consolidated as well as summarized data over time intervals
- Graphing and Visualization features are available
- Integrates well with monitoring systems
- Supports several operating systems
Why do we recommend it?
If your business wants to track time series data, CPU usage, and other key performance metrics of a network, the RRD tool is a great option. It integrates well with programming languages and shell scripts.
The data logged by RRDTool can be extracted and displayed in a graphical layout. The tool can be integrated into shell scripts applications running with ruby, perl, python, tcl, lua and PHP.
Who is it recommended for?
Network Administrators and DevOps teams can leverage the tool for monitoring network infrastructure components and performing analysis over time.
Official Website: https://oss.oetiker.ch/rrdtool
Download: https://oss.oetiker.ch/rrdtool/download.en.html
Conclusion
Whew – That was a ton of tools to go through – we hope you find a good Linux Network Monitoring Tool/Software that suits your needs. There's quite a few of them and I'm sure we've missed some. If you have any other suggestions, please feel free to send us an email and we'll be sure to add it to the list!
If you're looking for a fully supported, paid solution that not only monitors Linux Network Traffic, we suggest your Download Solarwinds NPM or PRTG by Paessler – They are both extremely well known in the community have a strong reputation for having great products. If you don't mind getting your hands dirty, then give Nagios Core, Zabbix or OpenNMS a try for an open-source solution.

