
Our funding comes from our readers, and we may earn a commission if you make a purchase through the links on our website.
Best Server Monitoring Tools & Software for Windows/Linux (FREE & PAID)
UPDATED: February 28, 2024
Server Monitoring is, hands down, the most important task any IT professional will do in their daily routine to ensure that all production servers and applications are running at peak performance without any hiccups.
Employing the best server monitoring tools and software in your environment will not only ensure that your machines are running smoothly, but will keep your job secure as well. There's an old saying about Backups in IT departments: “Have Good Backups, Or a Good Resume” – this holds true for keeping servers up and healthy as well.
With all that said, we're going to go through a large list of software that will help you keep an eye on your infrastructure. We're hoping that our list will help you determine which software suite will work in your environment, as each is wildly different than the next.
Here is our list of the top server monitoring tools:
- SolarWinds Server & Application Monitor – FREE TRIAL Service that watches the resources on a server as applications use them and reports on capacity problems through an alerting mechanism. Installs on Windows Server. Start a 30-day free trial.
- Paessler PRTG – FREE TRIAL A bundle of monitoring tools that cover server performance issues as well as network and application performance. Installs on Windows Server. Access the 30-day free trial.
- Atera – FREE TRIAL This SaaS package is produced in editions for IT departments and managed service providers and it provides full system monitoring that includes server activity tracking. Access a 30-day free trial.
- Datadog Server Monitoring – FREE TRIAL Great for monitoring processors and resources on physical servers. Cloud-based system that watches over servers and provides detailed logs. Get a 14-day free trial.
- NinjaOne Endpoint Management – FREE TRIAL This SaaS platform provides monitoring and management services for workstations, mobile devices, network devices, and servers. Start a 14-day free trial.
- Site24x7 Server Monitoring – FREE TRIAL A cloud-based monitoring platform that covers networks, servers, and applications that includes hypervisor monitoring.
- SentryOne SQL Sentry – FREE TRIAL A monitoring system for SQL Server that also covers the underlying support structure including Windows and Linux servers. Available for Windows Server or as an Azure service.
- ManageEngine OpManager – FREE TRIAL A server and network monitoring package that includes virtualization performance tracking. Installs on Windows Server and Linux.
- ITRS OP5 Monitor An infrastructure monitoring system that includes business tracking procedures. Installs on Linux and can run on Windows Server over a hypervisor or on cloud platforms.
- Incinga 2 A free infrastructure monitor that was developed from a fork of Nagios Core that includes server monitoring. Installs on Linux.
- Zabbix A free systems monitoring package that includes server monitoring. Runs on Linux, macOS, and Unix.
- Nagios XI an infrastructure monitoring system that includes server monitoring functions and is based on the free Nagios Core.
- OpenNMS Horizon A free system monitoring package that is primarily a network monitor but also has server monitoring capabilities.
In terms of monitoring capabilities, many of these software suites provide the functionality, reports and alert systems that are needed to ensure that everything is running top notch. We've included some open-source options as well, as some engineers and administrators are using them in their environments on a daily basis – although we like to have a support team behind the product if questions or support issues arise, as our main job is to keep servers healthy and running at all times, not configuring open-source software to do what we want it to do.
Our methodology for selecting server monitoring tools:
If you strive for optimal performance and reliability of the server, we have made a list of key factors you must keep in mind before choosing the best server monitoring tools.
- Verify versions and compatibility of tools for your Windows and Linux
- Look for essential features like memory utilization, disk space, and network performance
- The number of servers the tool can handle
- Evaluate the alerting capabilities of the tools
- Consider integrations of tools and collaboration features
- sensitive monitoring data and secure communication protocols.
- Checkout for security vulnerabilities, maintenance, and compatibility issues.
Best Tools for Server Monitoring and Management
Below you'll find a list of our top choices and a detailed description about them and some screenshots of their Interfaces and options.
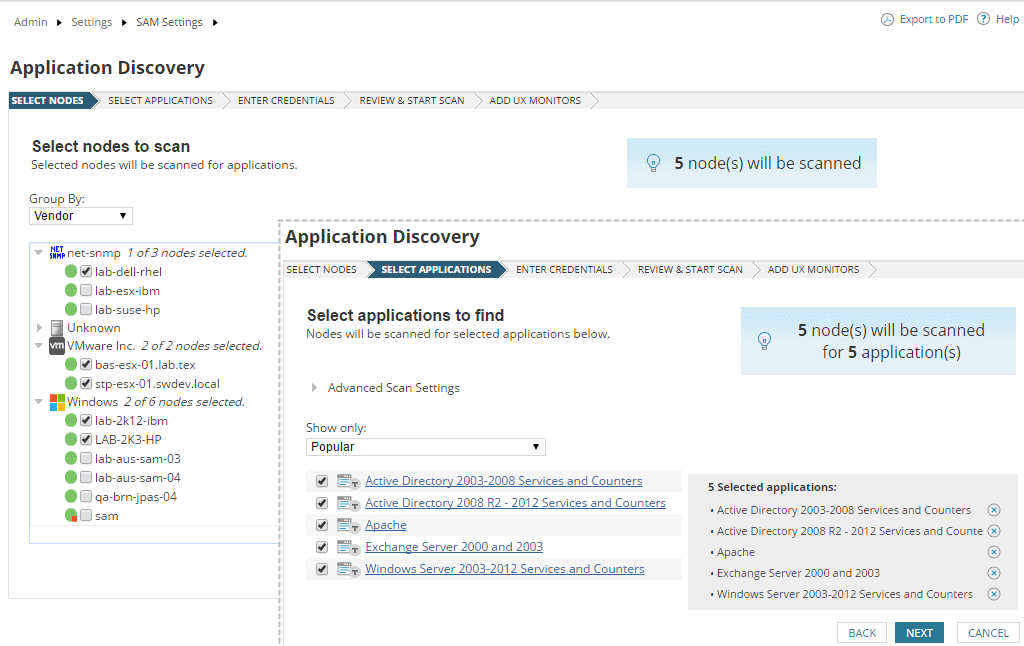
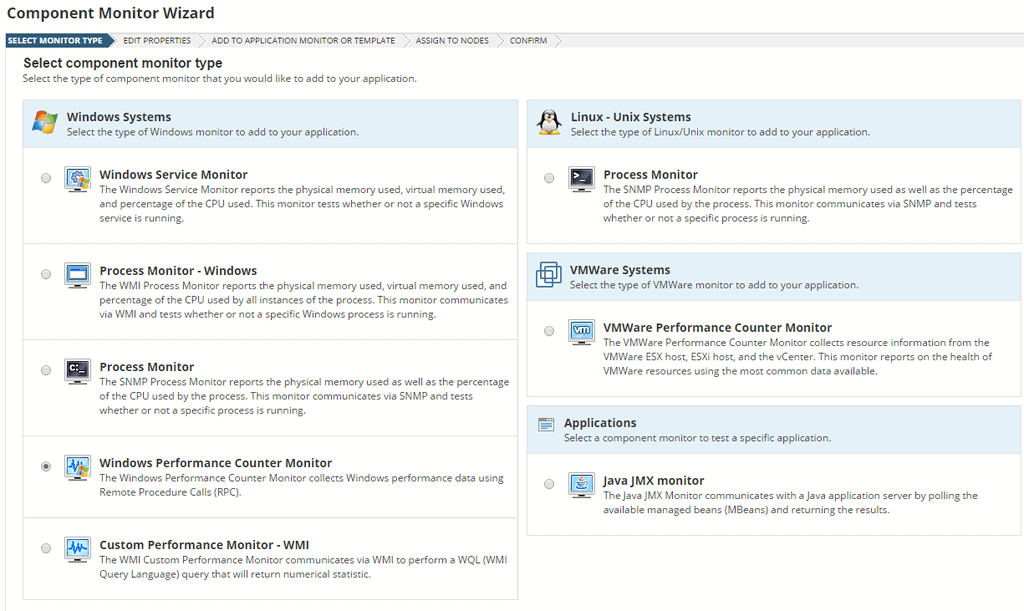
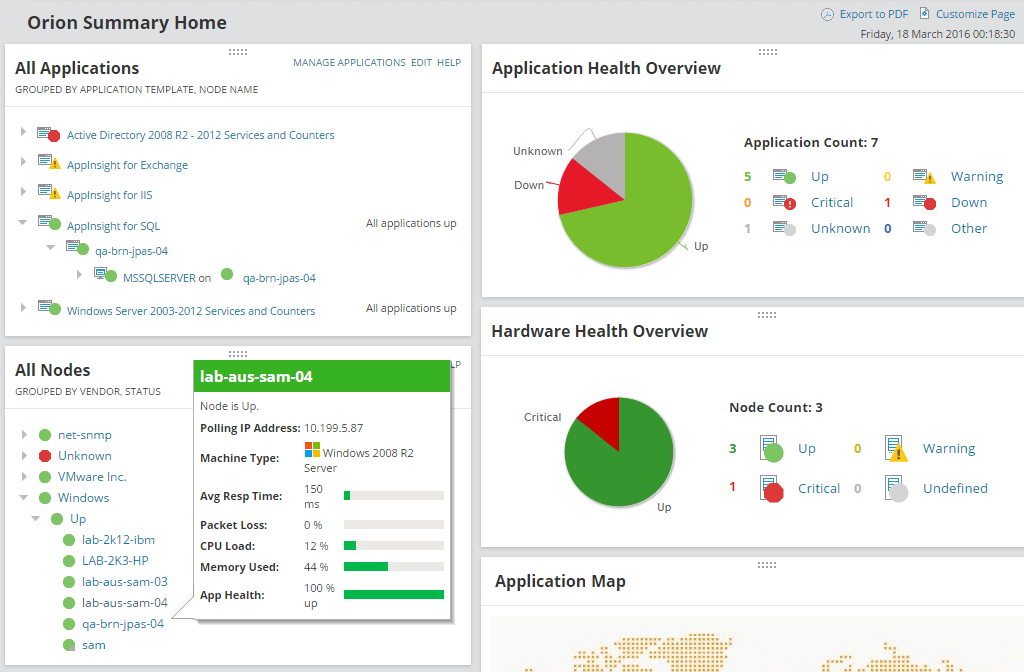
1. SolarWinds Server & Application Monitor – Recommended Choice!
The capabilities that SolarWinds SAM has in terms of flexibility and features gives it the clear advantage when it comes to finding a solution for your monitoring needs. We recently did an article on some alternatives to nagios and the only software package that had the ability to Import Nagios Scripts natively was SolarWinds SAM. Many of the other software packages had nice templates for creating/replicating the functionality of Nagios scripts, but only SAM was able to import them directly in and start monitoring within a matter of MINUTES!
On top of the migration functionality it offers, here are some of the top features that come with Solarwinds SAM that make it stand ahead of the competition.
Key Features:
- Automatic Mapping and Discovery of Applications and Dependencies
- Pre-packaged and Pre-Built Reports and Alerts for quick Setup
- Out-of-the-Box support for over 200 Applications (Windows and Linux)
- Agent or Agentless Monitoring for Public, Private or Cloud Applications/Servers
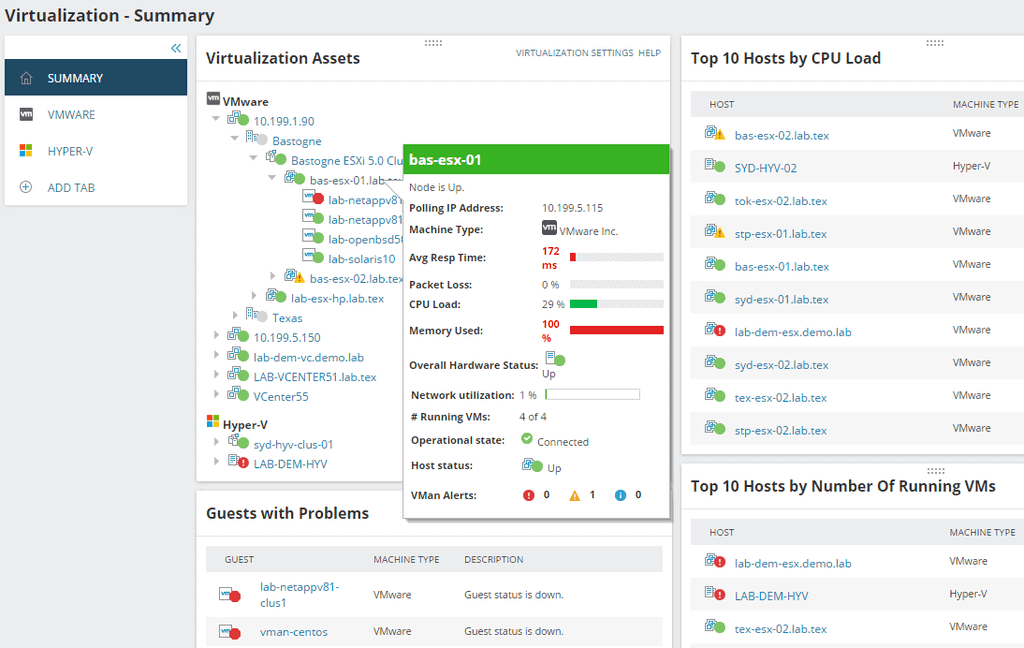
- Monitor Virtualized Environments including products and VM's from VMware, Hyper-V and SANS devices
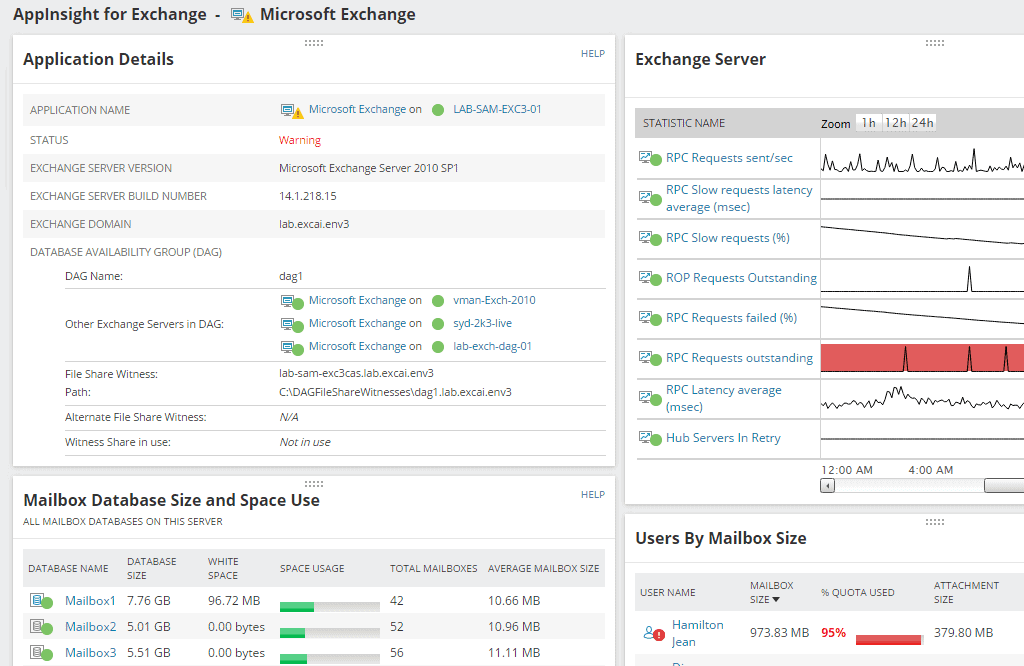
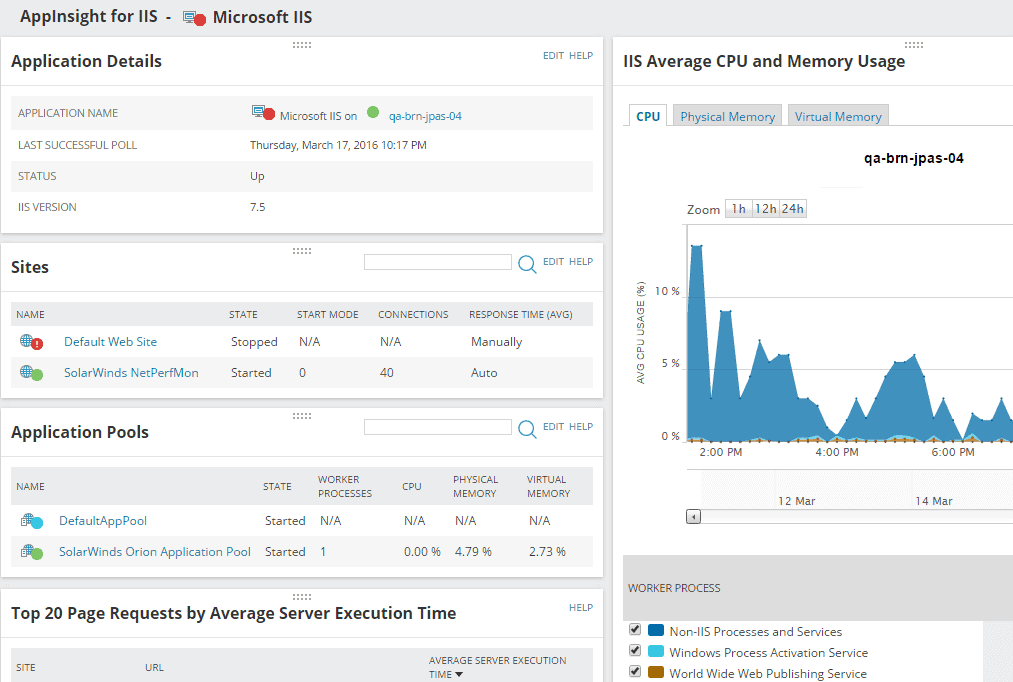
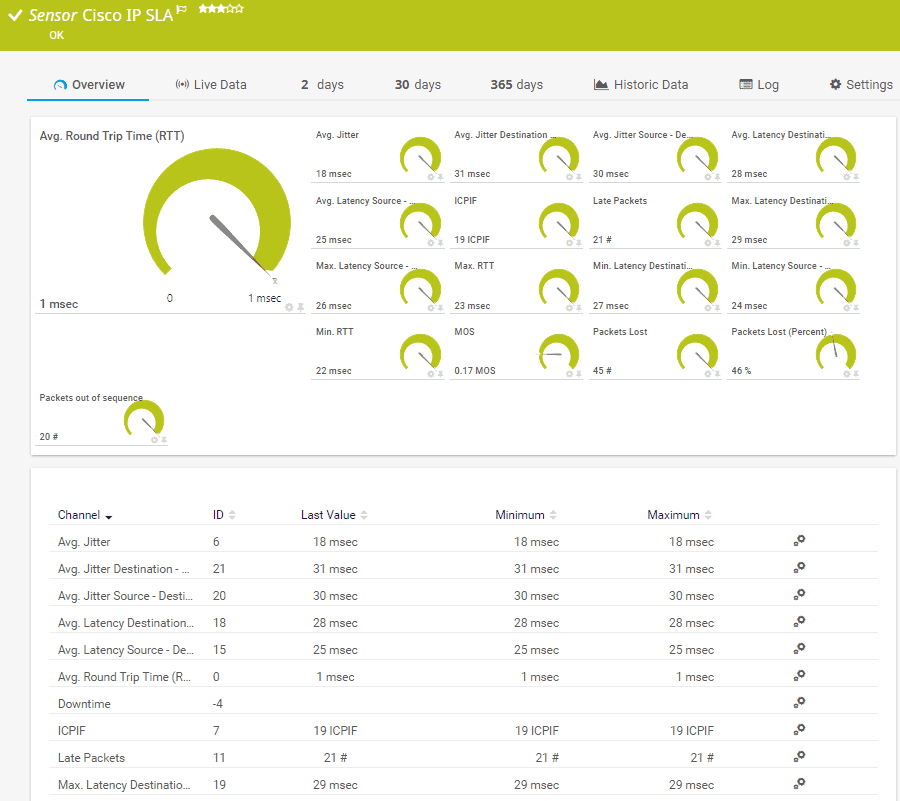
- AppInsight™ feature for intricate visibility into specific Microsoft Processes including Exchange Server, IIS and SQL Server
- 800+ Custom User Generate Monitoring Templates
- Automatic Discovery of IT Asset for Tracking and Management
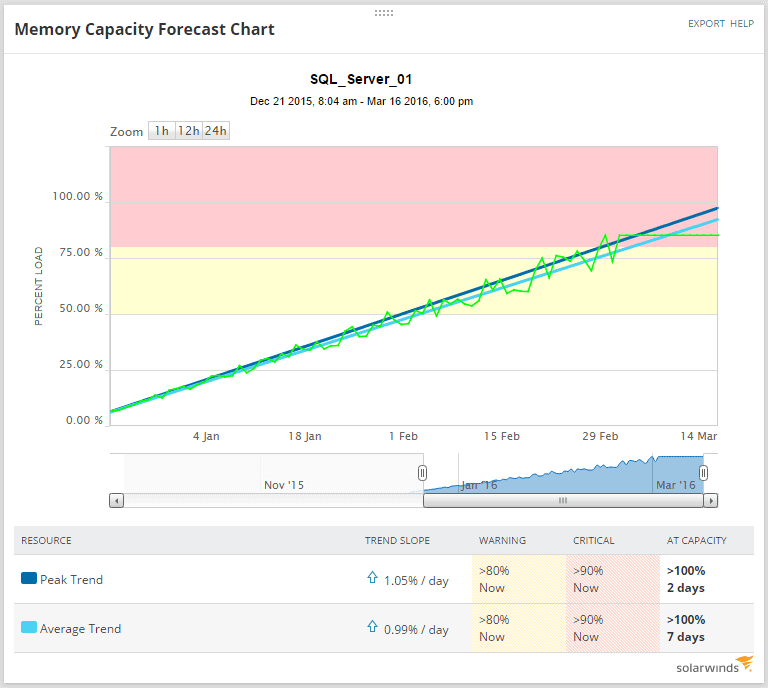
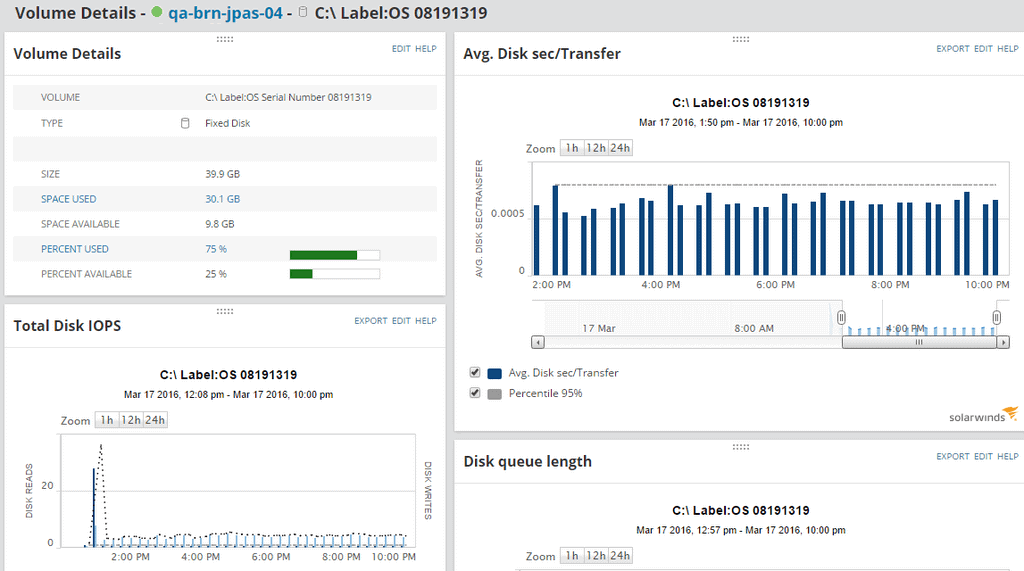
- Monitor Server Volumes and Storage Capacity for Proper capacity Planning
- Fix Server Problems remotely with built-in Troubleshooting Features and Tools
- Support Operating Systems and Applications include: Windows Servers, Linux, Java, Active Directory, Citrix and many more
- Deep Analysis and Monitoring of SQL Server, including Connections, Sessions, Disk I/O, Storage Capacity, DB Transactions, CPU Usage and much more
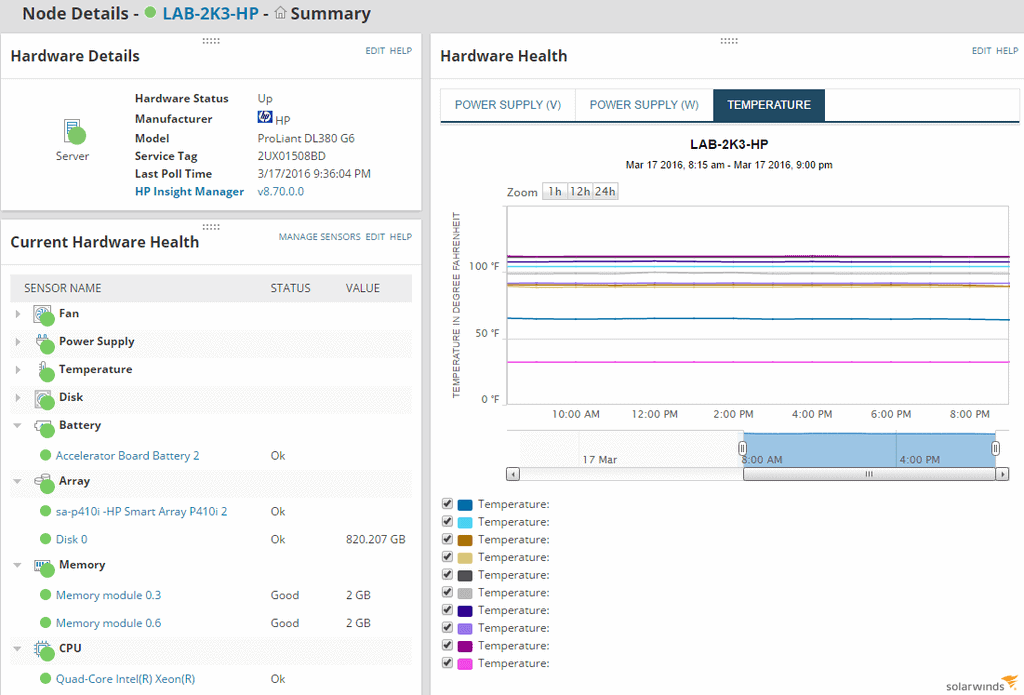
- Granular monitoring of Memory (RAM), Hard Disk Usage, CPU/Processor Usage, Critical Services, and general Hardware within Servers.
- Cloud Monitoring including Amazon EC2, Microsoft Azure and Rackspace out-of-the-box
- Easy to Use and Access Web based interface
Why do we recommend it?
SolarWinds Server & Application Monitor is recommended because it efficiently tracks vital server details like CPU usage, hard drive status, power supply, and more. You can easily monitor performance with its user-friendly color-coded system, which shows green for normal conditions and red for critical conditions. This makes it easy for users to keep an eye on their server and application performance.
Who is it recommended for?
This tool is useful for experts who need tailored monitoring. It allows quick template creation for custom applications, IoT devices, and web-based apps. Besides this, it offers out-of-the-box support for diverse applications, using various protocols like PowerShell, WMI, SNMP, and REST APIs.
Minimum System Requirements:
- CPU: 2.4Ghz
- Memory/RAM: 4GB
- HDD: 4GB
- OS: Windows Server 2008 R2 , 2012 and 2012 R2 – All require .Net Framework 4.5
- Database: SQL Server Express/Standard/Enterprise
- SQL Server 2008, 2008 SP1, 2008 SP2, 2008 SP3, or 2008 SP4
- SQL Server 2008 R2, 2008 R2 SP1, 2008 R2 SP2, or 2008 R2 SP3
- SQL Server 2012, 2012 SP1, 2012 SP2, or 2012 SP3
- SQL Server 2014, or 2014 SP1
- SQL Server 2016
- IIS v7.5 or Higher
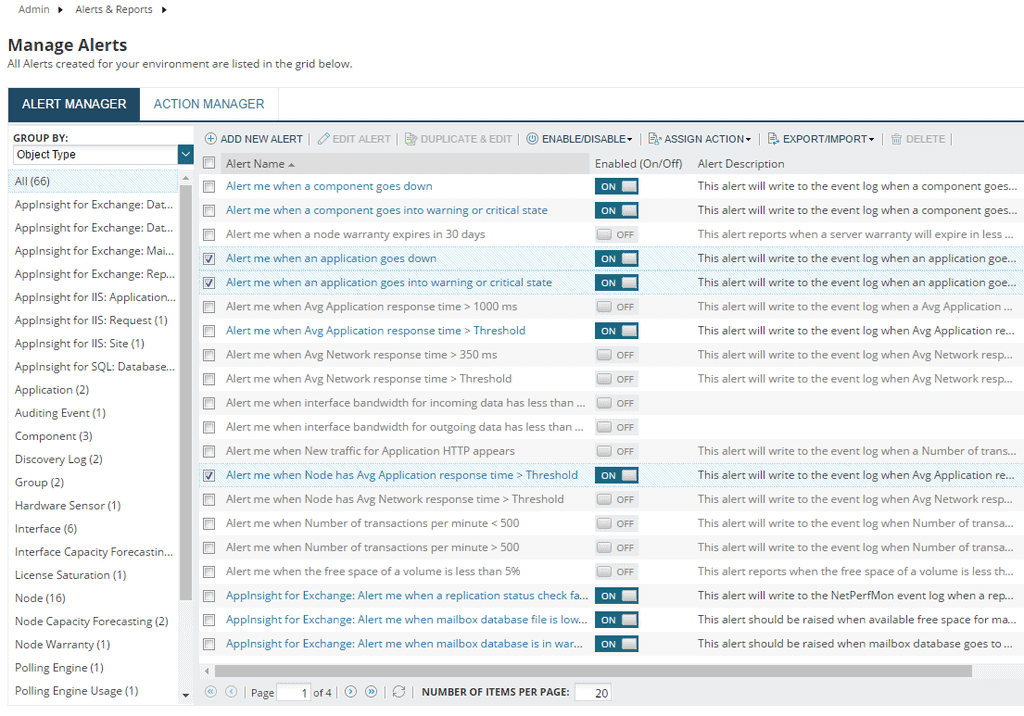
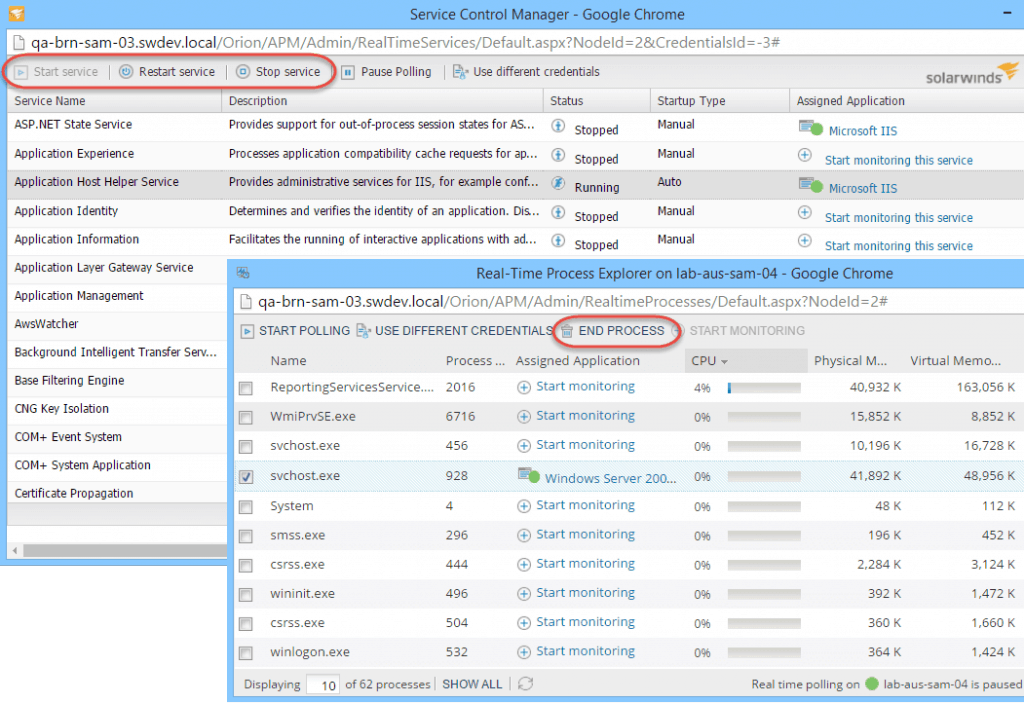
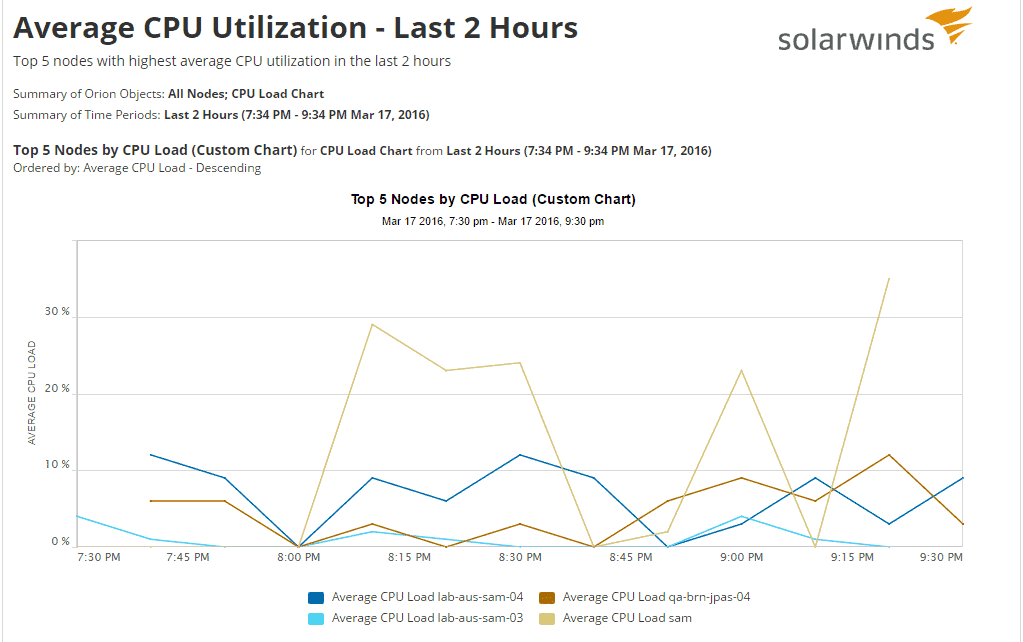
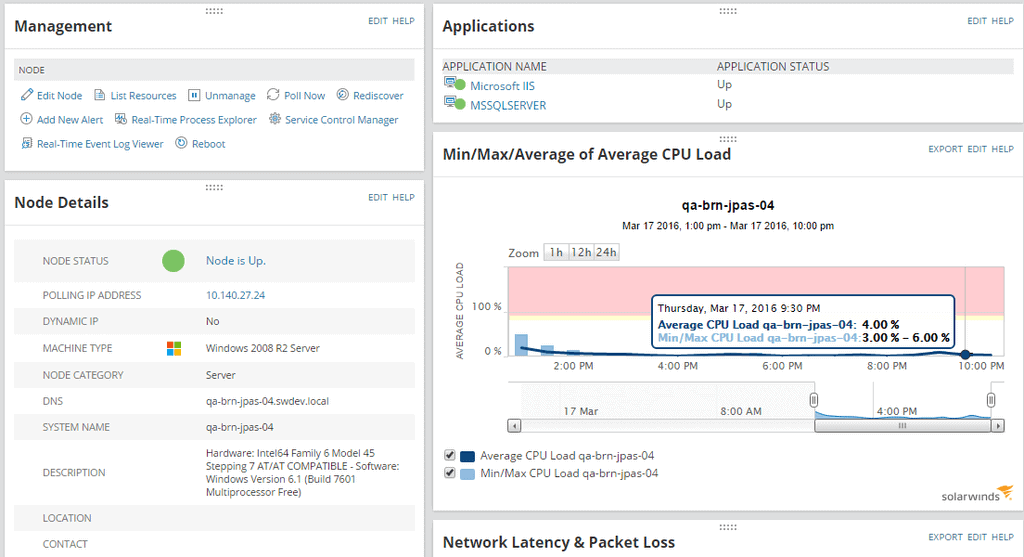
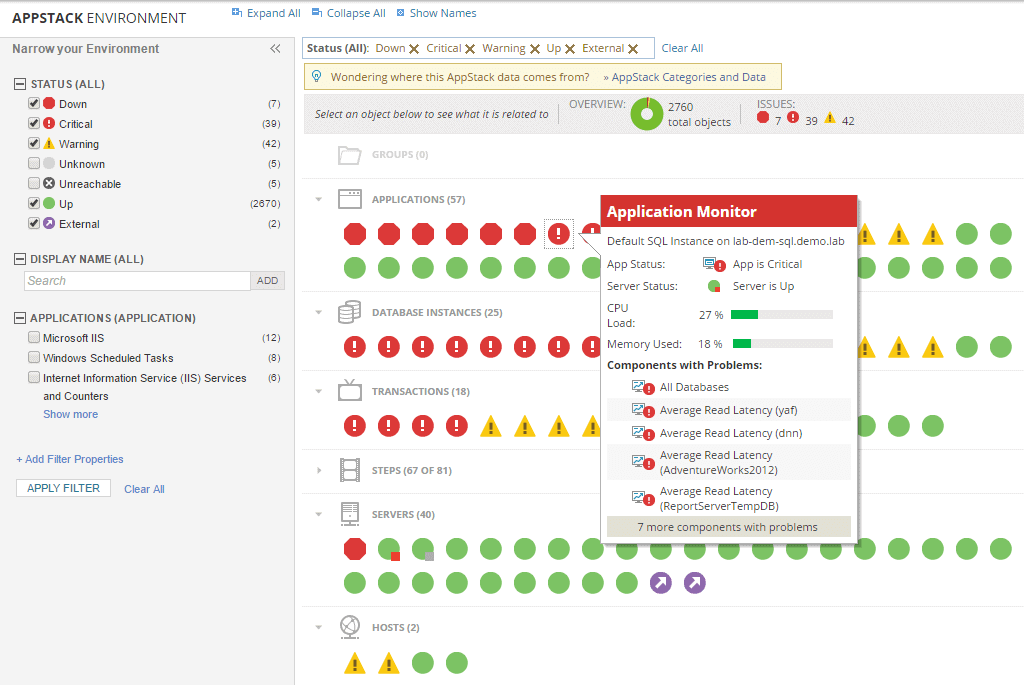
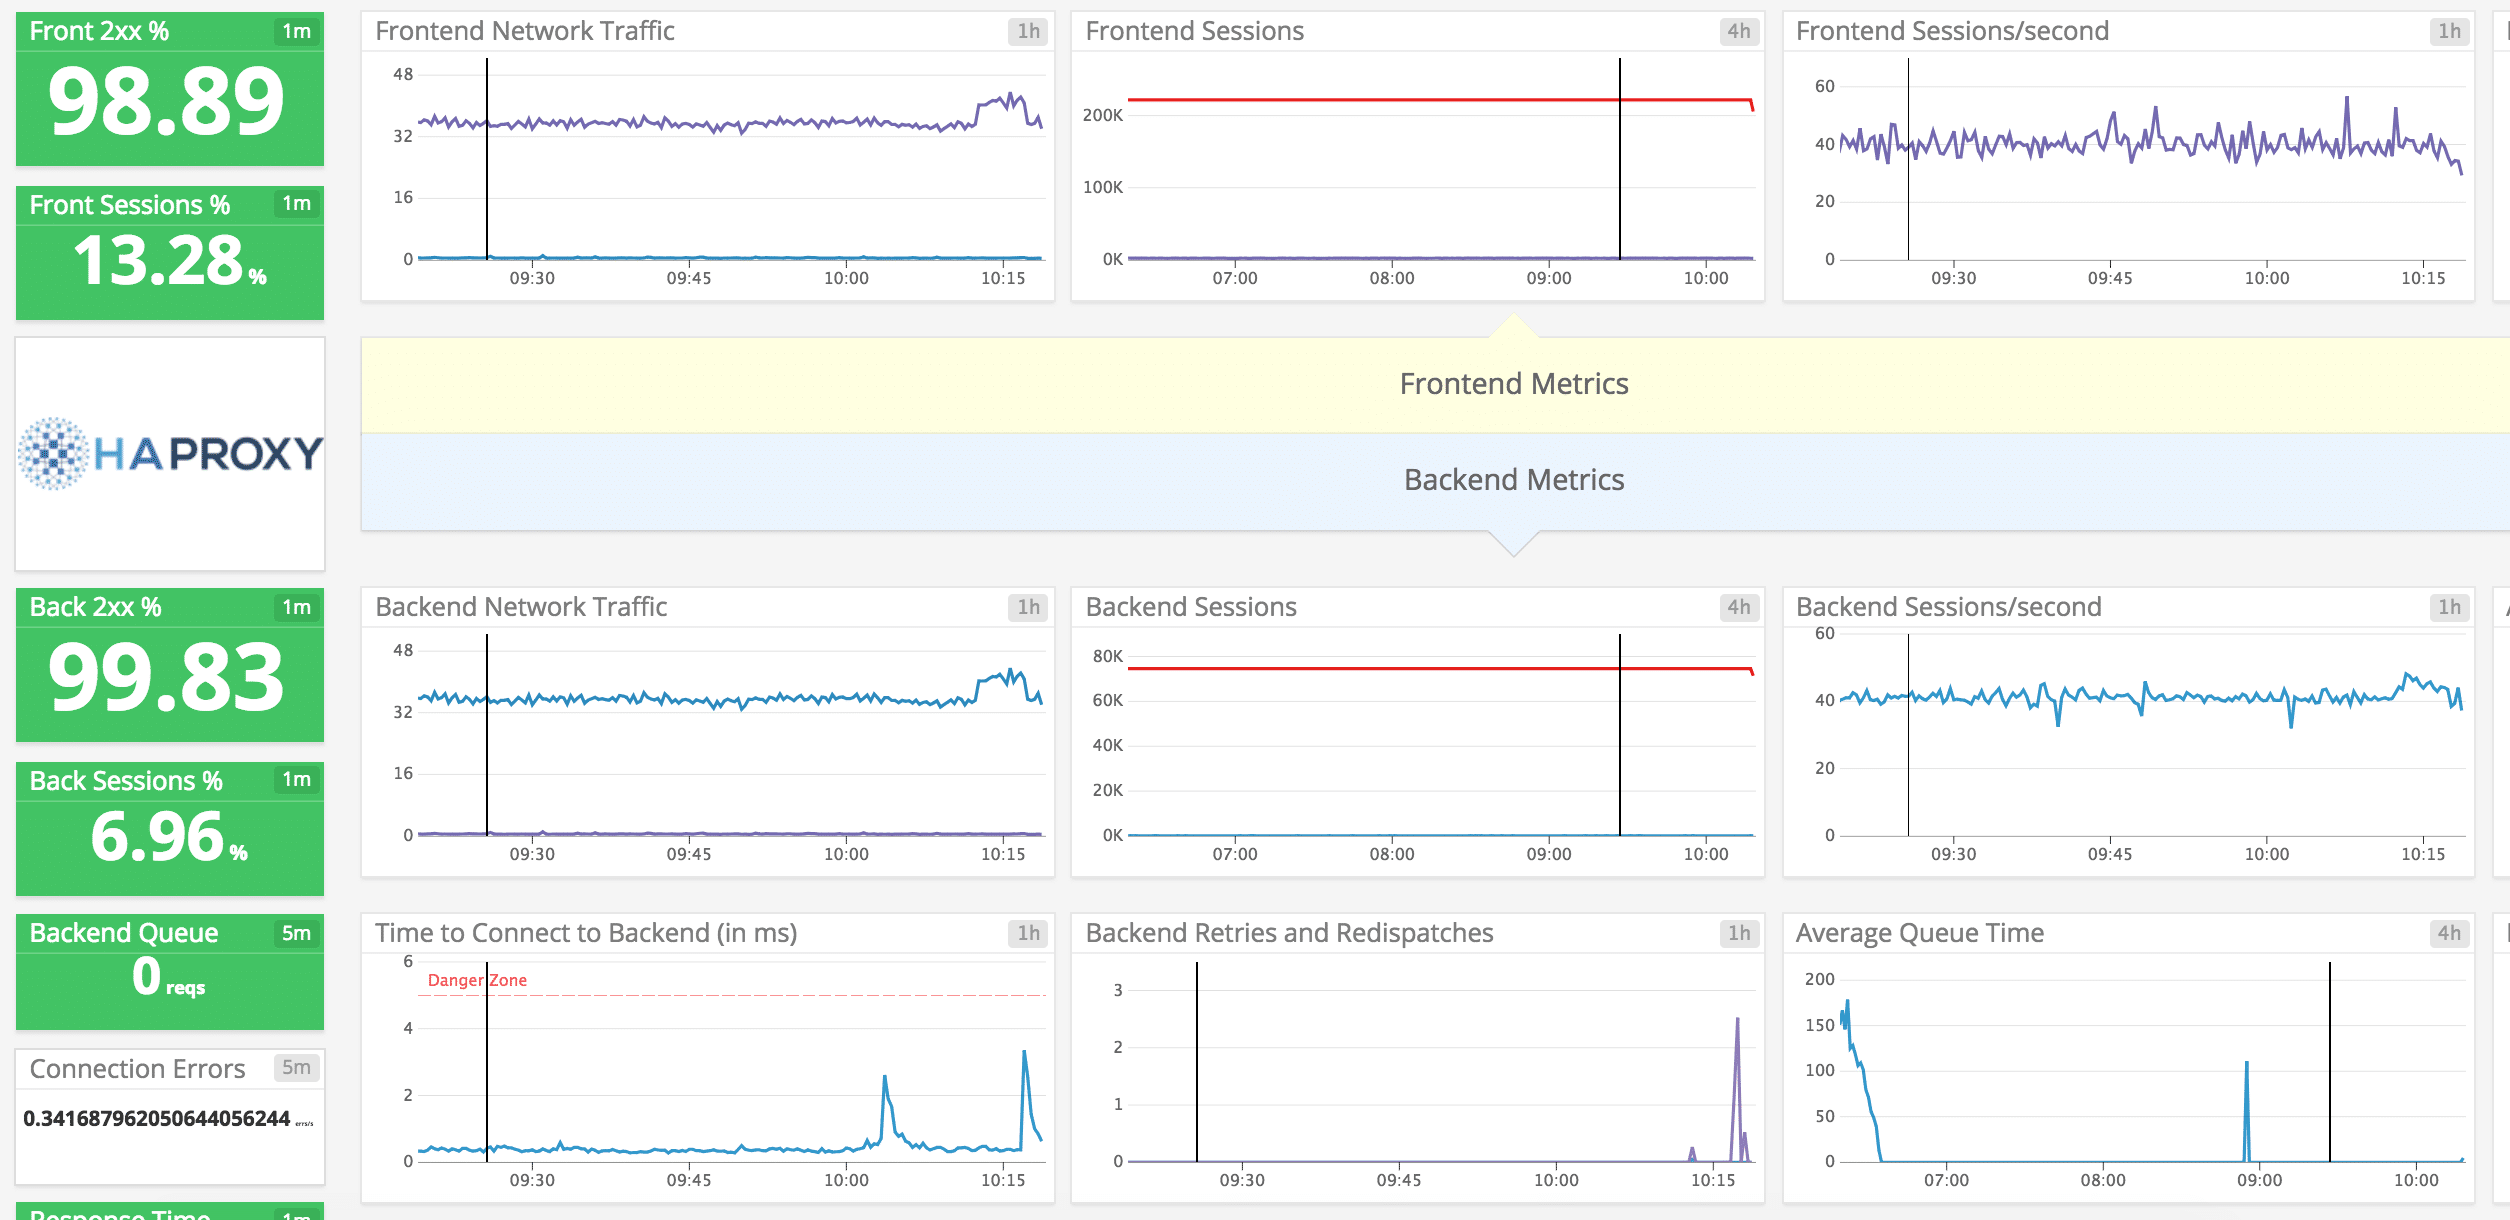
Screenshots
![]()
Pros:
- Offers “done for you” dashboards, monitors, and templates designed for your enviroment
- Provides live monitoring through its agentless architecture
- Supports auto-discovery that builds network topology maps and inventory lists in real-time based on devices that enter the network
- Can map applications, networks, and infrastructure as well as highlight bottlenecks and dependencies
- Uses drag and drop widgets to customize the look and feel of the dashboard
Cons:
- SolarWinds SAM is a feature-rich enterprise tool that can take time to fully explore
Grab a 30 Day FREE Trial of SolarWinds SAM today and get it installed to really see its Functionality.
EDITOR'S CHOICE
SolarWinds Server & Application Monitor is our top-notch preference because it is highly flexible and has a customizable dashboard suitable for multiple roles. It can easily monitor physical as well as cloud services. It also supports 1,200 plus templates, which will automate the tasks and hence make the server monitoring efficient. This tool is a perfect choice as it is fully featured and can be easily integrated with Azure, AWS, apache, and other Microsoft tools.
Download: Get a 30-day Free Trial
OS: Windows Server 2016 or later
2. Paessler PRTG – FREE TRIAL
PRTG has been around for quite some time now and its been evolving into a great piece of software that has tons of bells and whistles. We've used this in our own environment for monitoring uptimes and critical services before we moved over to SolarWinds SAM, as we mentioned above.
PRTG offers a wide range of features and functions as well as a nice trial period that allows you to monitor up to 100 sensors at no cost and then goes up from there in pricing.
Key Features:
- Relatively small download size sitting at 180MB
- Can be installed on Desktop versions of Windows as well as Server versions as well
- UP/DOWN Time monitoring
- Bandwidth monitoring using SNMP, WMI and other popular protocols
- and much more!
Why do we recommend it?
Paessler PRTG is loved due to its flexibility. It is suitable for various business needs because it offers options like the PRTG 500 package, providing 500 sensors and one server monitor, and the powerful PRTG XL5 with unlimited sensors and five server monitors for efficient planning.
Who is it recommended for?
This tool is used by network experts responsible for monitoring and handling critical network issues. This tool quickly spots weaknesses and provides a detailed view of traffic structure in Linux networks. It is easy to install and also compatible with mobile devices to detect failure and monitor virtual servers quickly.
System Requirements:
- Processor: Minimum Dual Core x64
- Memory/RAM: Minimum 3GB, Recommended 16GB for Mid to Large Environment
- HDD: Minimum 250GB Disk Space up to 1TB of space
- OS: Recommended Windows Server 2012 R2 w/ .Net Framework 4.0 or 4.5 (can be installed on desktop versions of Windows as Trial, but not Recommended for Production)
- Supported OS's include:
- Microsoft Windows 2012
- Microsoft Windows 10
- Microsoft Windows 8 and 8.1
- Microsoft Windows 7
- Microsoft Windows Server 2008 r2
- Microsoft Windows Server 2016
- Microsoft Windows Server 2008 (Not recommended per PRTG website)
- Microsoft Windows Vista (Not recommended per PRTG website)
- Supported OS's include:
Screenshots:
Pros:
- Leverages customized sensors to provide a detailed look into many environments (including infrastructure)
- The dashboard is customizable through a series of widgets and feels intuitive out of the box
- Supports a completely free version for up to 100 sensors
- Pricing is based on sensor utilization, making this a flexible and scalable solution for larger networks as well as budget-conscious organizations
Cons:
- PRTG is a feature-rich platform that requires time to fully learn all of the features and options available
See there official site for more information and download links: https://www.paessler.com/prtg. Paessler also offer a 30-day free trial of PRTG.
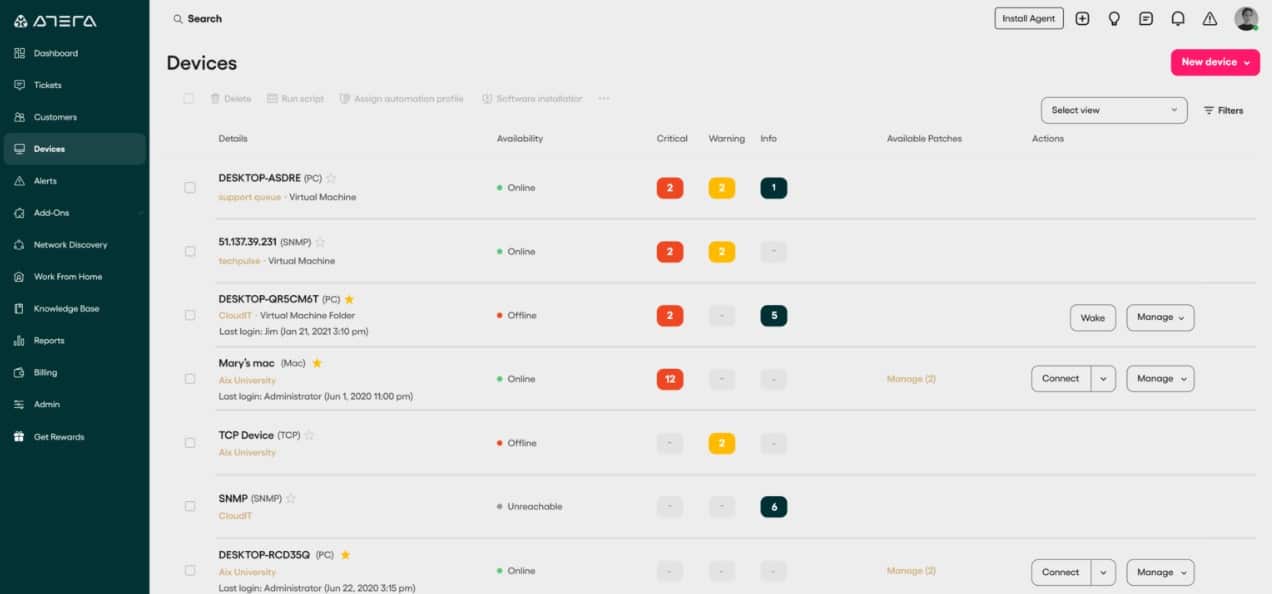
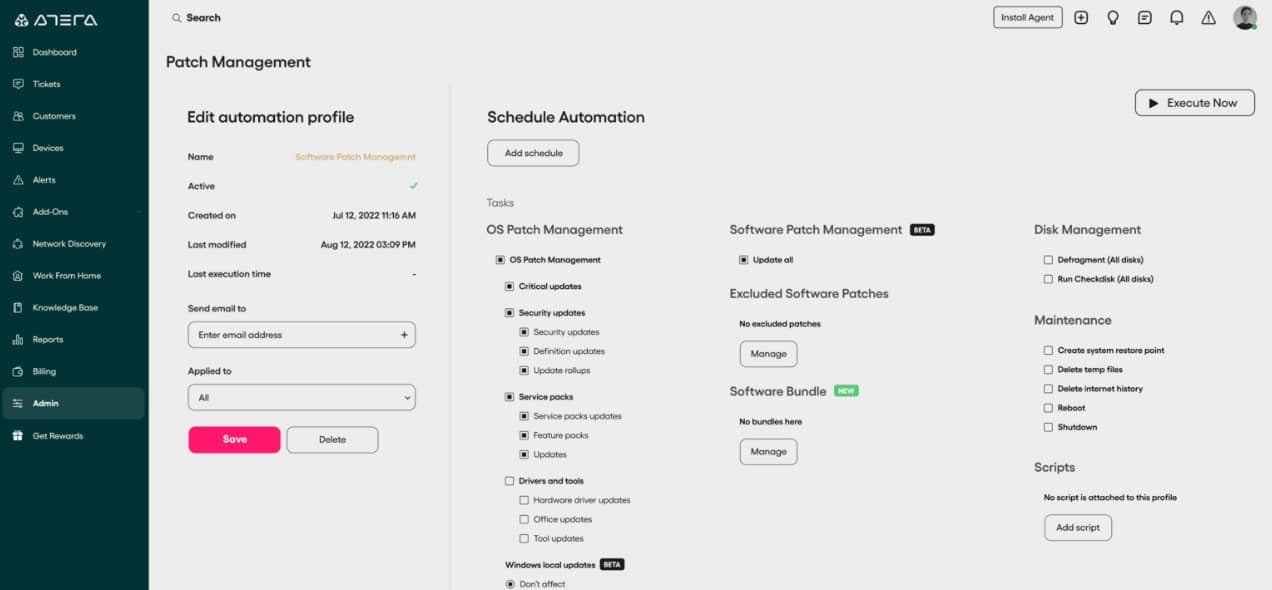
3. Atera – FREE TRIAL
Atera is a remote monitoring and management platform that is provided as a SaaS platform, which you can access from anywhere through any standard Web browser. There are two versions of this system – one is written for IT department and the other has a multi-tenant architecture for use by managed service providers (MSPs).
Key Features:
- Server capacity and availability checks
- High-level color-coded status screens
- Drill-down status details
- Full stack monitoring
- Multiple site and internet link monitoring
- Automated software distribution
- Software inventory management
- Automated patching
Why do we recommend it?
Atera is known for its Remote Monitoring and Management capabilities. It allows unlimited device monitoring and management at a fixed cost, which is accessible anytime, anywhere. It provides convenient Remote Access through instant sessions with options like AnyDesk, Splashtop, TeamViewer, or ScreenConnect.
Who is it recommended for?
Atera is ideal for experts aiming to enhance IT efficiency. It features AI for quick issue response, which is a great addition to the entire IT environment and boosts team efficiency. Its network discovery feature ensures real-time security scans, making it a valuable tool for IT professionals.
System requirements:
Atera is hosted in the cloud
Screenshots:
Pros:
- Offers an autodiscovery option
- Tracks multiple servers simultaneously
- Identifies performance issues and raises alerts
- Links server performance to application activity and network monitoring
Cons:
- No on-premises version
Access a 30-day free trial: https://www.atera.com/signup/
4. Datadog Server Monitoring – FREE TRIAL
Datadog Server Monitoring provides server monitoring and also watches over all of the applications and services that support your user-facing software. This package is able to monitor cloud resources as well as on-site servers.
Key Features:
- Monitors processor activity and all resources on physical servers
- Monitors cloud-based virtual servers and serverless systems
- Tracks activities in virtualizations
- Container monitoring and management
- Monitors database systems
- Watches over web servers
- Examines event logs
Why do we recommend it?
DataDog is recommended for cost-effective operations. It combines performance metrics with crucial cost data, helping to reduce unnecessary compute, storage, or data transfer costs. The real-time, auto-generated host map facilitates easy discovery of underutilized cloud and on-premise servers, optimizing resource usage efficiently.
Who is it recommended for?
This tool is recommended for experts seeking user-friendly monitoring. It has an excellent interface, easy usability, and high customization, making it a flexible fit for all organizations. As a cloud-based SaaS product, it requires no server deployments or onboarding fees. The auto-discovery feature builds network topology maps dynamically, enhancing convenience for users.
System requirements:
- This is a cloud-based system
Screenshots:
Pros:
- Provides quick insights into your servers through templates and prebuilt monitors
- Great interface, easy to use, and highly customizable
- Cloud-based SaaS product allows monitoring with no server deployments or onboarding fees
- Supports auto-discovery that builds network topology maps on the fly
Cons:
- Would like to see a longer 30-day trial
Download a 14-day free trial of Datadog Infrastructure:
https://www.datadoghq.com/free-datadog-trial/
5. NinjaOne Endpoint Management – FREE TRIAL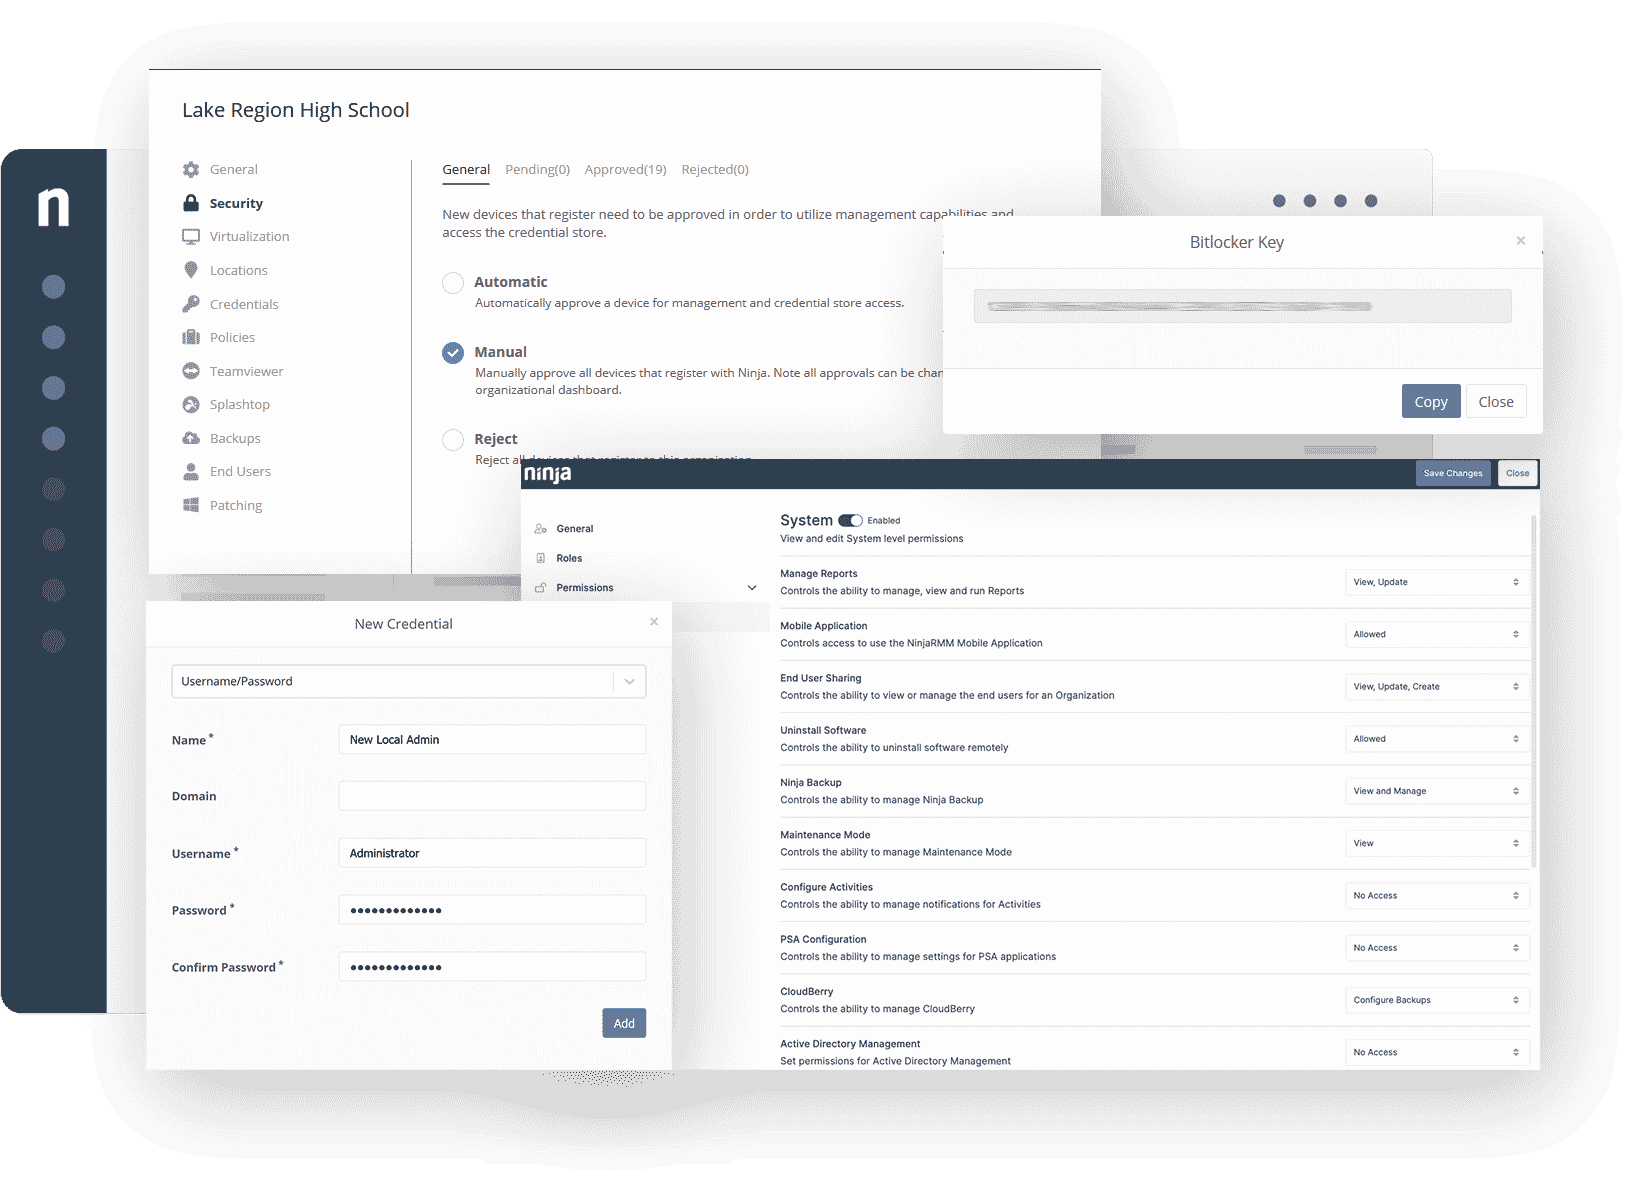
NinjaOne Endpoint Management offers full server monitoring and management system from a cloud platform. This package provides an inventory of all devices and scans each workstation and server for software packages, which are listed in an inventory. This list of software forms the basis for a patch manager.
Key Features:
- Constant server resource monitoring with alerts
- Tracking for CPU, disk, and memory capacity utilization
- Server software management
Why do we recommend it?
NinjaOne Endpoint Management has a lot of comprehensive features. It includes a patch manager, automated monitoring, and remote access utilities and also covers security aspects like antivirus software and backup services. If you are a business with a technical team, this tool is a must-have for team management and efficient working.
Server monitoring is a constant process that tracks the utilization of the service's CPU, memory, and disk capacity. Statistical thresholds trigger alerts if crossed by usage levels on each of these key metrics.
Hardware and software inventories are constantly updated by the same system status sweeps that perform the monitoring service. The full NinjaOne package also monitors networks and applications. There are versions of the NinjaOne system for IT departments and managed service providers.
Who is it recommended for?
NinjaOne Endpoint Management is ideal for MSPs and IT departments. It allows real-time device monitoring, automatically notifying technicians of issues for faster remediation and minimizing impact on end-users. This tool helps in managing diverse systems to solve server issues quickly.
Pros:
- Fully automated server hardware and software monitoring
- Cloud-based service that can monitor multiple sites
- Software management includes patch management
Cons:
- Not offered as an on-premises option
Access a 14-day free trial of NinjaOne: https://www.ninjaone.com/freetrialform/
6. Site24x7 Server Monitoring – FREE TRIAL
Site24x7 is a cloud-based system that is offered in a number of modules. Site24x7 Infrastructure is the group’s monitoring solution for servers and it also covers networks and applications. The use of virtualizations is also covered by this tool.
Key Features:
- Live reporting on server resources, such as CPU, memory, and processor capacity and utilization.
- Monitors Linux and Windows Server.
- Available in a version that is suitable or use by managed service providers (MSPs).
- Monitors VMWare, Hyper-V, Docker, and Nutanix virtualizations.
- Monitoring system for Microsoft services, such as Exchange Server, IIS, and SQL Server.
- Raises alerts when server performance issues are spotted.
Why do we recommend it?
Site24x7 Server Monitoring is recommended for its SaaS platform's convenience. It allows secure management of customer accounts and their capabilities and endpoints from a single place. Users can customize logos, URLs, and operational roles, providing a tailored experience while efficiently monitoring customer accounts.
Who is it recommended for?
This tool is recommended for IT experts seeking proactive network management. It provides disk usage forecasts for optimal planning and analyzes the network traffic and bandwidth utilization to address issues promptly. Prometheus and StatsD monitoring offers enhanced visibility into applications and servers, aiding experts in comprehensive and integrated system oversight.
System Requirements:
- This is a cloud-based service
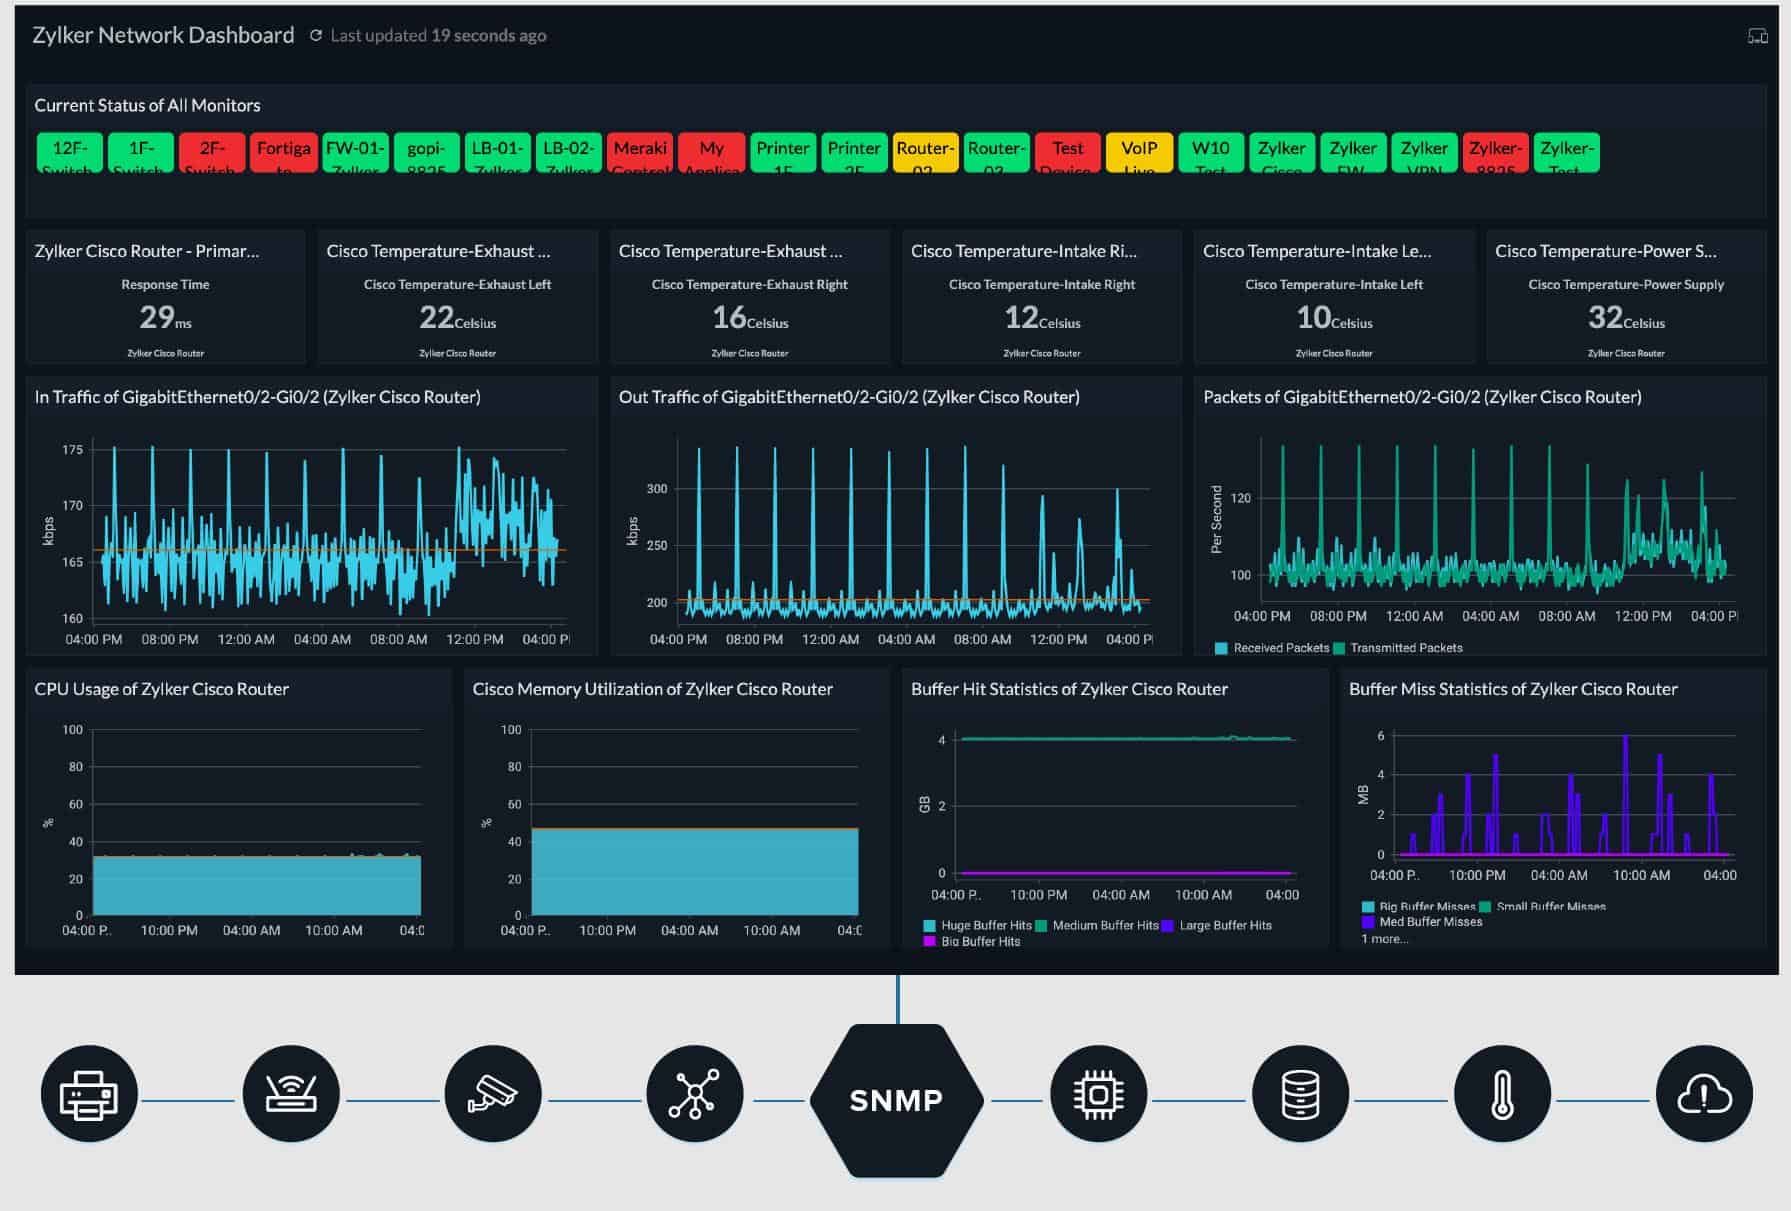
Screenshots:

Pros:
- Offers out-of-the-box templates to monitor servers quickly with little setup
- Uses real-time data to discover devices and build charts, network maps, and inventory reports
- The platform is intuitive, little training is needed to get it fully functional
- Supports a freeware version – a great option for smaller networks
Cons:
- Is a very detailed platform that will require time to fully learn all of its features and options
Download a 30-day free trial of Site24x7 Infrastructure:
https://www.site24x7.com/signup.html
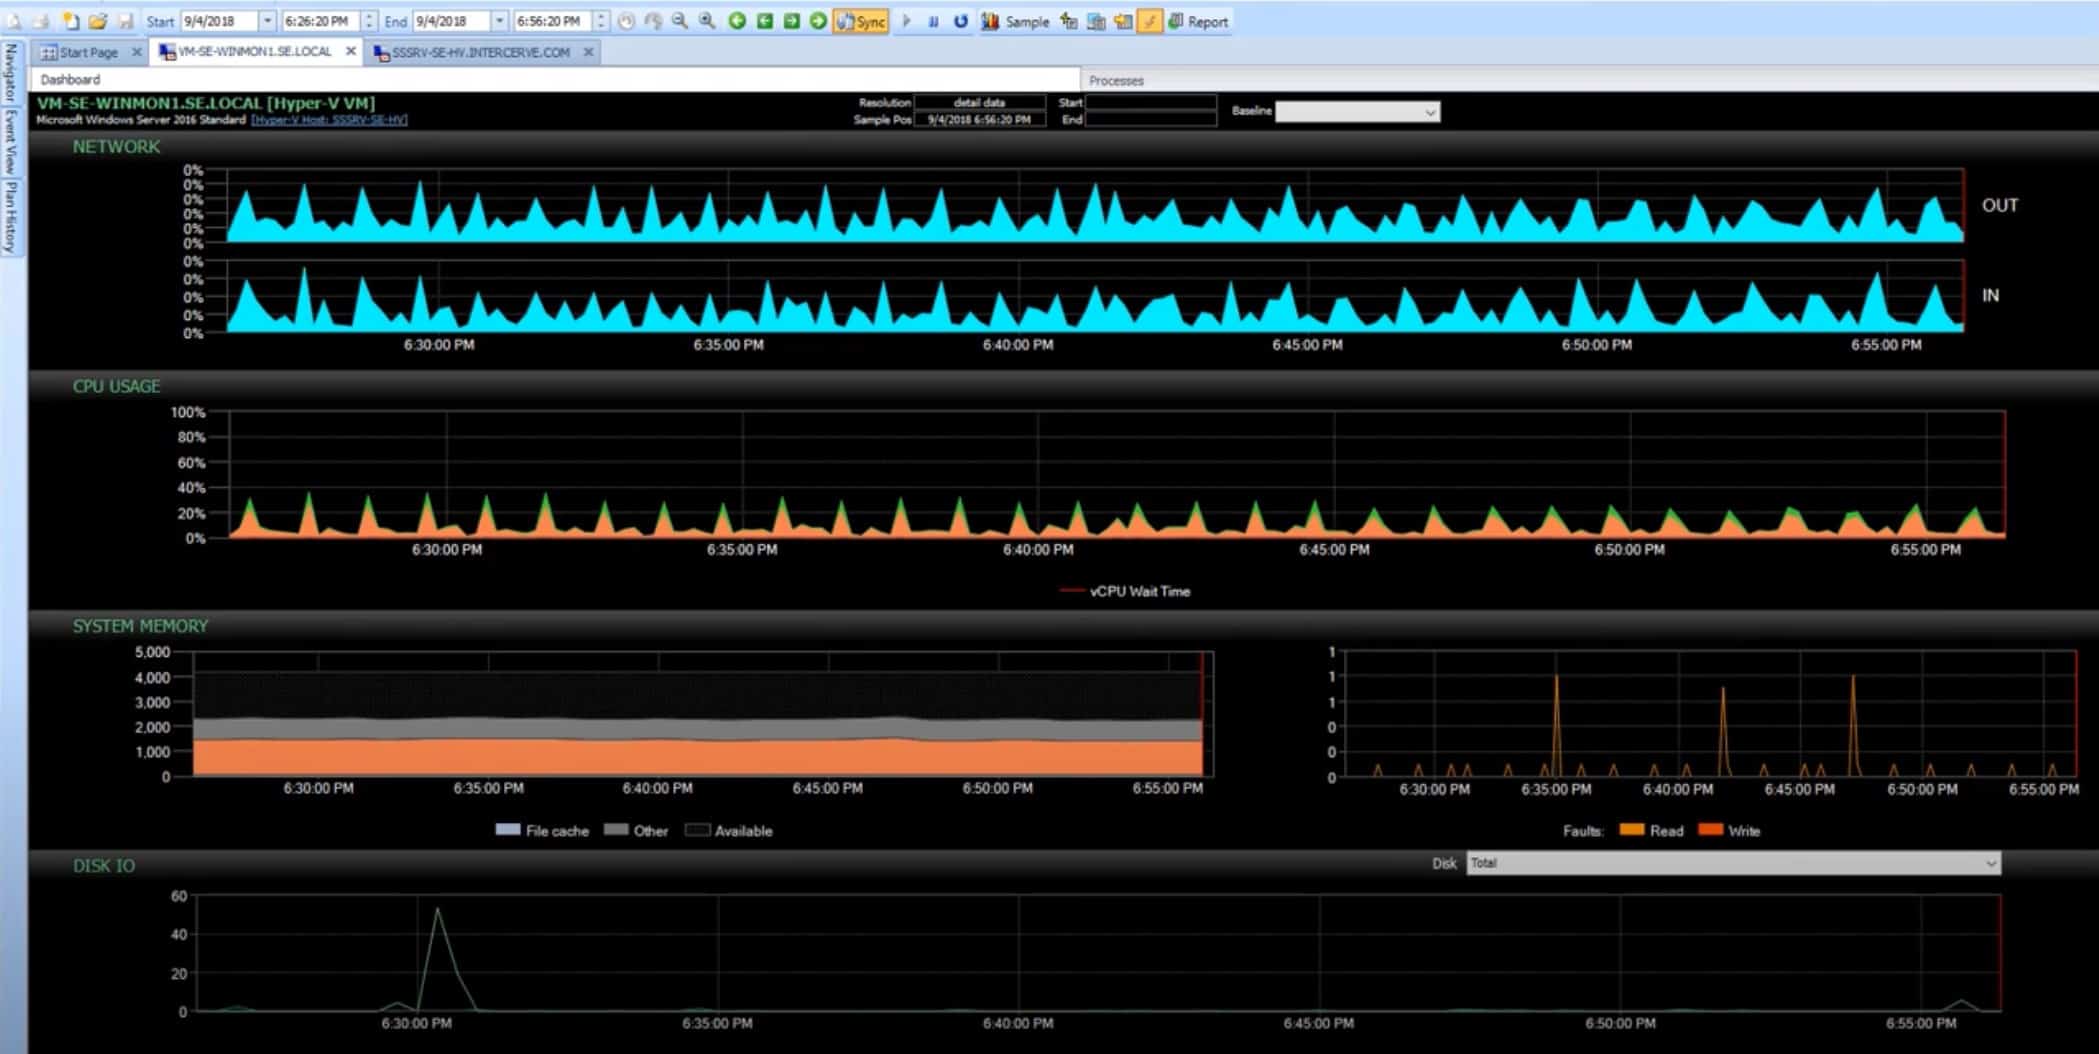
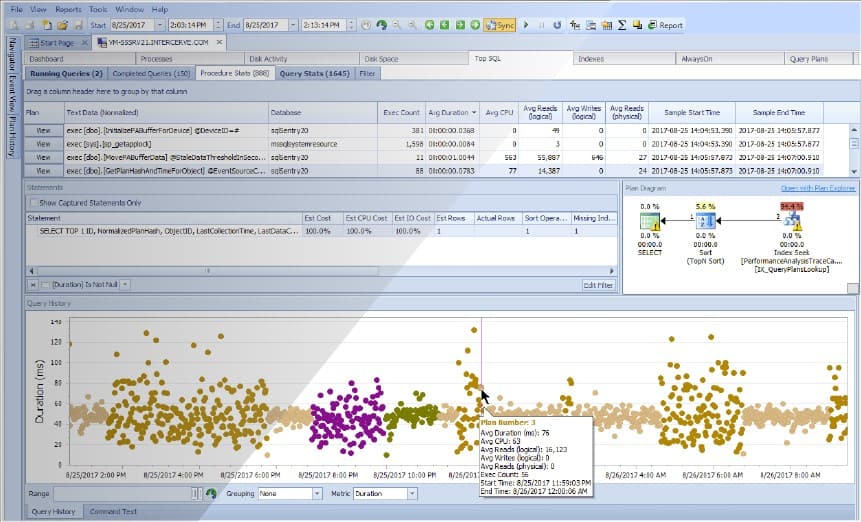
7. SentryOne SQL Sentry – FREE TRIAL
SentryOne SQL Sentry is a monitoring system for SQL Server. However, it includes additional monitoring services for the underlying infrastructure that supports those databases. This stack monitoring includes virtualizations, operating systems, and physical server resources. The service is able to monitor the performance on Windows and Linux plus the Azure and Amazon cloud platforms.
Key Features:
- Correlation between database activity and server resource usage
- Supervision of server resource availability
- Operating system performance monitoring for Windows and Linux
- Monitoring of hosts and VM in Hyper-V and VMWare virtualizations
- Alerts for resource issues and performance problems
- Historical analysis services
Why do we recommend it?
SentryOne SQL Sentry is popular due to its SQL Server Deadlock Monitoring Tool. It provides valuable insights into deadlocks to check the total time lost during these incidents. The Victim Impact metric in the deadlock summary report helps users understand the impact of deadlocks, making it a crucial tool for optimizing SQL Server performance.
Who is it recommended for?
SQL Sentry is recommended for database administrators (DBAs) working collaboratively with developers. In cases of deadlocks, DBAs often need to share information with developers for optimal resolutions. SQL Sentry allows DBAs to coordinate and share deadlock information with the team via email. Additionally, it provides recommendations on resolving deadlock issues, making it a valuable tool for DBAs and developers working together.
System Requirements:
- An Azure service
- Windows Server (on premises)
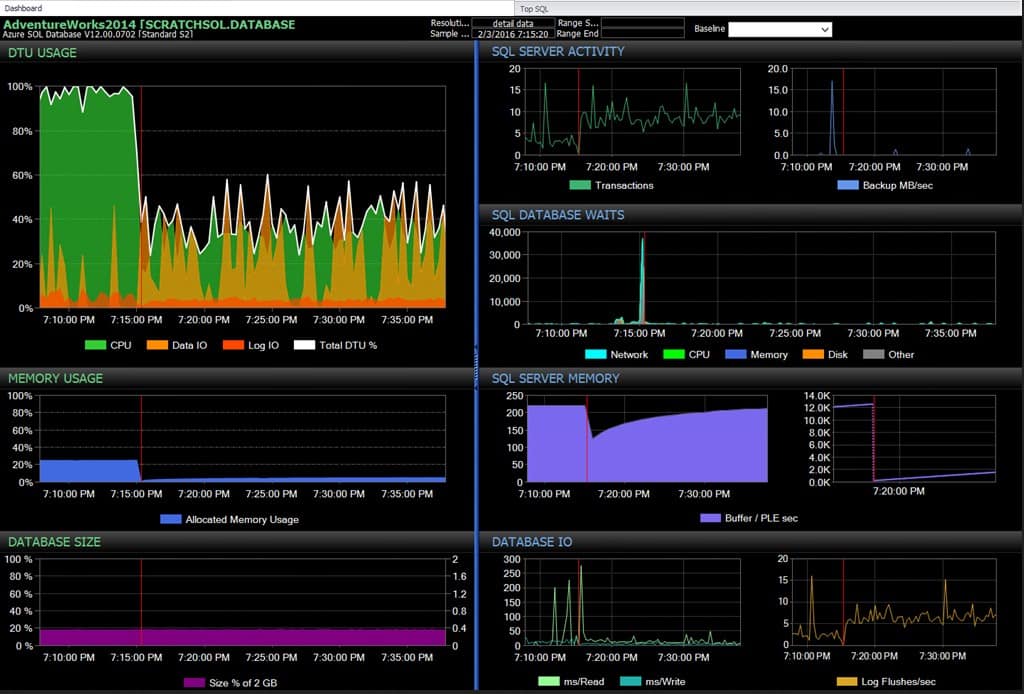
Screenshots:
Pros:
- Great fit for those looking to monitor Hyper-V systems and databases performance in one solution
- 100+ alerts and templates customized around SQL server health monitoring
- Supports root cause analysis for faster resolution times
- Supports a wide range of integrations for logging and PSA
Cons:
- Those who don’t need database monitoring may not use all features SentryOne has to offer
Download a 14-day free trial of SentryOne SQL Sentry:
https://www.sentryone.com/products/sentryone-platform/win-sentry/windows-performance-monitoring
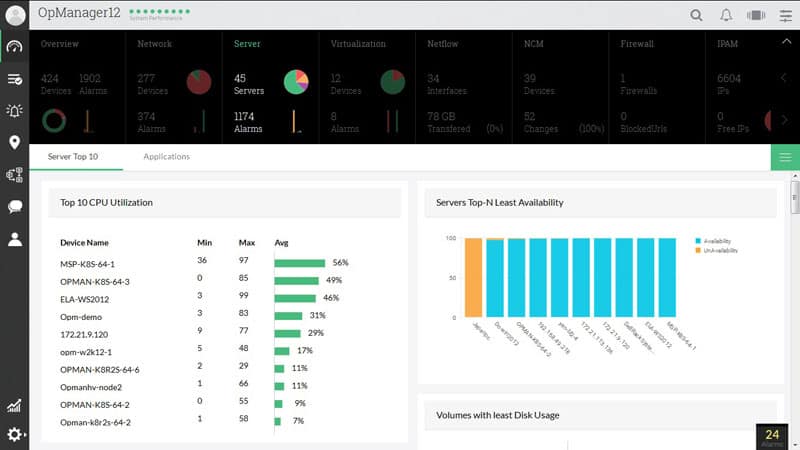
8. ManageEngine OpManager – FREE TRIAL
ManageEngine is constantly striving to put out a great product, OpManager, and is gaining a lot of traction in the IT realm. OpManager brings server monitoring to your finger tips and allows you to view everything on a nicely laid out interface.
Key Features:
- Network health and Server overview and monitors
- Bandwidth and Firewall log Analysis
- Config Management
- VM and VOIP functionality
- and much more
Why do we recommend it?
We recommend OpManager because it's a reliable network and server performance management software. It monitors over 300 key server metrics, such as CPU and disk utilization. It also monitors processes and services, providing alerts and notifications based on set thresholds to ensure servers are available and healthy.
Who is it recommended for?
OpManager is recommended for network and IT experts requiring versatile monitoring. It utilizes both SNMP and NetFlow, offering broader coverage options compared to other tools. The Enterprise package supports up to 10,000 endpoints with easy scalability, making it suitable for experts managing large-scale network environments.
System Requirements (via: http://help.opmanager.com/hardware-and-software-requirements):
- Processor: Intel Quad 3.5Ghz
- Memory/Ram: 16GB
- HDD: 60GB
- OS: Windows:2012 R2 / 2012 / 2008 R2 / 2008 / 2003 Server / Vista / v7 / 2000 Professional SP4 or Linux: RedHat 4.x and above, Debian 3.0, Suse, Fedora and Mandrake
- Database: MSSQL 2008, 2012 and 2014
Screenshots:
Pros:
- Designed to work right away, features over 200 customizable widgets to build unique dashboards and reports
- Features traffic management options alongside DPI tools
- Uses intelligent alerting to reduce false positives and eliminate alert fatigue across larger networks
- Supports email, SMS, and webhook for numerous alerting channels
- Can set up SLAs based on network, application, or process
Cons:
- Is a feature-rich tool that will require a time investment to properly learn
Register to download the 30-day free trial.
https://www.manageengine.com/network-monitoring/
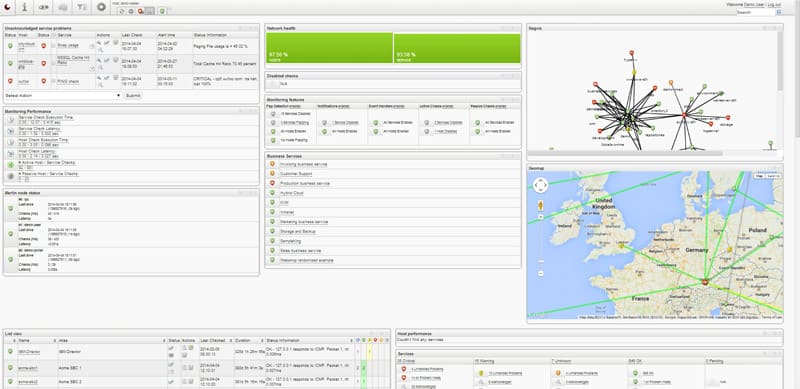
9. OP5
OP5 is an open-source solution that gives you the flexibility of an open-source platform with the enterprise support of any other product we've mentioned in this article. You will need to buy a license to accomodate the software after the 30 Day Free Trial regardless of it being open-source.
Key Features:
- Server & Virtual Server monitoring capabilities
- Public, Private and Hybrid Cloud monitoring
- Scalable to monitor Data centers as well
- Reporting and other Visual metrics
- Integrated Log Server built into the platform
- and much more!
Why do we recommend it?
ITRS OP5 Monitor helps simplify complex IT environments. Instead of having a mix of static and dynamic systems that are hard to monitor, OP5 Monitor provides a unified view of your entire IT setup. This makes it efficient and affordable to streamline monitoring tools.
Who is it recommended for?
Automation-savvy IT experts widely use ITRS OP5 Monitor. With a rest-API for seamless integration, it's perfect for those who want to automate and connect with other systems. This tool provides a comprehensive view of the entire IT estate and scalability for different aspects.
System Requirements:
- Processor: Xeon Processor (1 x Xeon E3-1220v3, 1 x Xeon E5-2620v3 or 2 x Xeon E5-2620v)
- Memory/Ram: Minimum 8GB up to 24GB
- HDD: Minimum 500GB Hardware Raid Recommended
- OS: RedHat 6.x and CentOS 6.x (x64 for Both) or op5 Server OS.
Screenshots:
Pros:
- Focuses primarily on offering their services to large enterprises
- All features and interfaces are designed to scale and handle large amounts of data well
- Simple widget customizations can be added or removed
- Offers geolocation mapping, and dependency mapping to help visualize complicated network services
Cons:
- Must contact sales for accurate pricing information
- The interface could be made more user-friendly with fewer menu options
See the Official site for Download Links and more information:
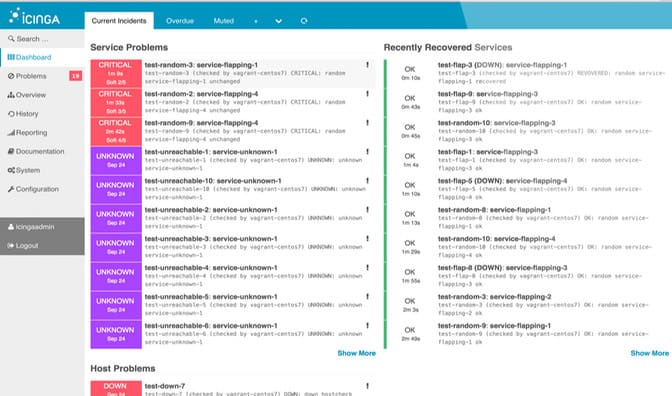
10. Icinga
Icinga is another great open-source platform that has some great functionality and isn't as well known as most of these software packages.
Key Features:
- Object-Based configuration
- Simple Install scripts
- Multi-threaded and Designed for Speed
- and much more!
Why do we recommend it?
Icinga provides comprehensive and accessible system monitoring capabilities. It is ideal for networks, servers, and applications; it covers Windows and Linux server monitoring, VMware virtualization monitoring, and cloud platform monitoring. It features a powerful monitoring engine providing complete coverage for networks and servers, making it a valuable choice.
Who is it recommended for?
Icinga 2 is recommended for server experts and network engineers seeking customized server and network monitoring. It allows selected users to receive specific error notifications via SMS, mobile, or email. However, it's more suitable for those comfortable with coding, as customization requires coding skills to maximize the tool's potential effectively.
System Requirements:
- Processor: Minimum Dual Core, Recommend Quad Core
- Memory/Ram: Minimum 4GB
- OS: Red Hat/ Cent OS, Suse Linux, Debian, Ubuntu, Gentoo, FreeBSD and Windows compatible.
Screenshots:
Pros:
- Transparent open-source tool
- Can be configured via GUI or DSL, making it a good choice for admins who enjoy CLI tools
- Supports built-in visual reporting
- Modules allow for different functionality, keeping the base installation sleek and lightweight
- Can run on Linux as well as Windows operating systems
Cons:
- Reliant upon the open-source community for support and updates
- Designed for more technical users, other options have better out-of-box features
For more information, check out their official site:
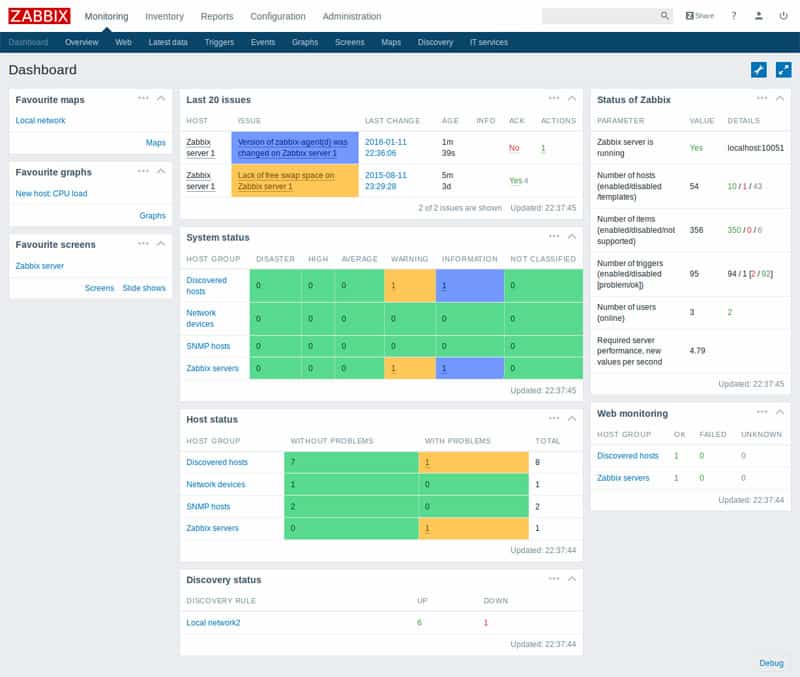
11. Zabbix
Zabbix is a real-time monitoring solution that is very scalable and can collect data from millions of different types of services, hardware, software and more. Its Enterprise grade and has scalability built into it.
Zabbix pricing model is based on upgrades and support, as the software is open source and free to download and use. We prefer software packages that have support built into the pricing model from the get go, but this is another way that open source solutions are being maintained and supported in recent times.
Key Features:
- Capacity Planning
- Performance, Availability, Web App, Database and Network Hardware monitoring
- and much more
Why do we recommend it?
Zabbix is a free-to-use and open-source package that provides useful information for comprehensive server health monitoring, CPU operations, memory usage, I/O error rates, disk space, fan status, temperature, and power supply performance.
Who is it recommended for?
Zabbix is recommended for IT professionals, particularly system administrators and network experts. It monitors hardware aspects, software, operating system, and firmware statuses, providing a comprehensive view. With features like configuration control, it helps experts track unauthorized installs or version changes, ensuring network integrity and security.
System Requirements:
- Processor: Minimum 2 Core CPU and up to 8 Cores if necessary
- Memory/Ram: Minimum 2GB and 16GB Recommended for Large Deployements
- HDD: Minimum 15GB
- Database: MySql, Oracle, PostgreSQL, SQLite or IBM DB2
- OS Supported:
-
Linux
-
IBM AIX
-
FreeBSD
-
NetBSD
-
OpenBSD
-
HP-UX
-
Mac OS X
-
Solaris
-
Windows: all desktop and server versions since 2000 (Zabbix agent only)
-
Screenshots:
Pros:
- Open-source transparent tool
- Uses both SNMP and ICMP for broader monitoring ranges
- Offers useful templates for quick insights
Cons:
- No paid support option – not ideal for large enterprise environments
For more information, check out their official site:
https://www.zabbix.com/download
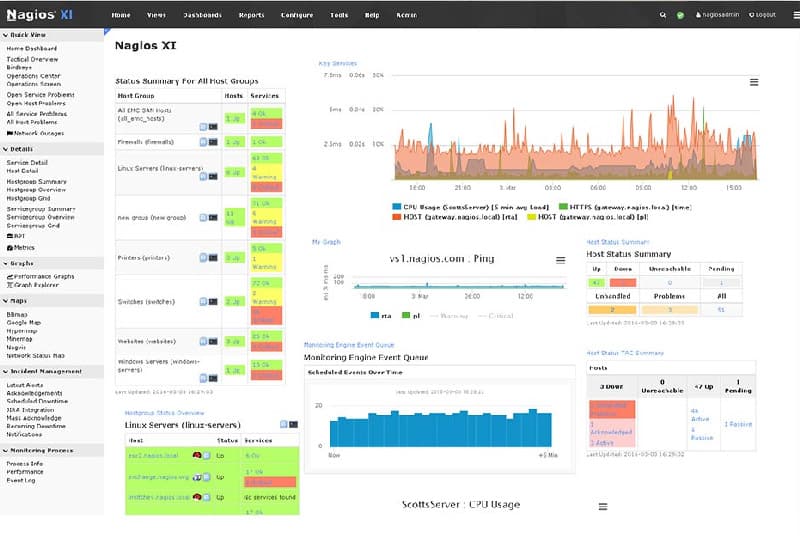
12. Nagios
Nagios is one of the more popular open-source solutions although it lacks in some areas in terms of ease of use and built-in functionality. Many IT admins prefer using Nagios due to the cost savings, which are nice when your on a budget, but many folks have also moved away from it and found alternative Nagios solutions.
Nonetheless, its still a very popular choice amongst Network Administrators and engineers for utilizing as a monitoring system and has a lot of add-on's that give it the same capabilities and functionality that you get from Enterprise level software solutions.
Key Features:
- Comprehensive application, services, operating system, Network and overall infrastructure monitoring capabilities.
- Customizable Code and Add-on's for more flexibility
- Reporting and Event functionality
- Active Forum and Community for Development and troubleshooting
Why do we recommend it?
Nagios XI is well-known for its extensive monitoring capabilities and community support. With over 3500 add-ons, it offers diverse server monitoring options. The customizable dashboard allows creating different views and access levels, facilitating secure delegation of tasks to junior staff and providing reporting access to management and customers.
Who is it recommended for?
Nagios Core is recommended for tech experts, especially in small businesses, as it allows free plug-ins for monitoring various technologies. Though lacking its front end, its versatility is notable. It also supports combining server and network monitoring within a single tool to simplify the monitoring process.
System Requirements:
- Processor: Minimum Dual Core, Recommended Quad Core or more.
- Memory/Ram: Recommended 1-4GB minimum and more than 8GB's if possible
- HDD: Minimum 40GB
- Database: MySQL
Screenshots:
Pros:
- Open-source transparent tool
- Simple, yet informative interface
- Flexible alerting options support SMS and email
- Robust API backend makes it a great option for developers who want to integrate their own custom applications
Cons:
- Would like to see additional integrations into more ticketing systems
For more information, check out https://www.nagios.org for official download links and more!
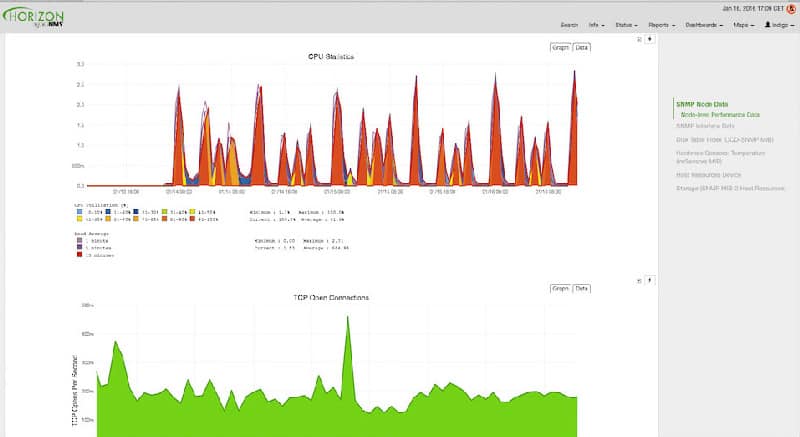
13. OpenNMS
OpenNMS is the last tool we'd recommend and it has a great list of features that make it stand out among the rest.
Key Features:
- Service Outage Detection
- Topology Discovery and Mapping
- Event-Driven Architecture
- Performance Metric Management
- and much more!
Why do we recommend it?
Last but not least, OpenNMS is the previous tool on our list that many users and professional organizations widely use. It is known for its robust monitoring capabilities and easily monitors tens of thousands of data points through a distributed and tiered system. It is best for monitoring large-scale environments as it comes with event-driven architecture, extends service polling data collection frameworks, and supports flexible workflow integration.
Who is it recommended for?
OpenNMS is basically an open-source solution used by IT professionals involved in the networking department. It is designed for those who want to visualize and monitor their local and distributed networks effectively. With features like fault, performance, traffic monitoring, and alarm generation in a unified platform, it is best for comprehensive network management.
System Requirements:
- Processor: 64-bit Processor
- Memory/Ram: At Least 4Gb of Ram
- OS: Centos or Red Hat Linux, Debian or Ubuntu, Windows Server, Vagrant
- Database: PostgreSQL
Screenshots:
Pros:
- Open source projects, lots of room for customization, and personalized add-ons
- Has a large amount of documentation available
- Features two versions, a stable version and a beta test version for new features
- Offers a wide range of monitoring options and flexible alert notifications
Cons:
- Is more complicated to set up than paid tools that focus on streamlining the onboarding process
For more information, check out their official site:
Conclusion
We hope this overview of the best server monitoring tools and software was helpful in making your decision on which software package you should try out. Almost every single one of these offers a Trial for at least 30 days and they are all very well suited for almost any network.
We are currently using SolarWinds Server and Application Monitor in our network and love it. We suggest it to all our clients and anyone we consult for as it really gives a great overview of your network, the alerts are very easy to setup along with proper reporting.
We have even Migrated users away from Nagios to SolarWinds because they have a built-in Import tool to pull the scripts directly into the software allowing you to be monitoring within a few minutes time.
Grab a Free Trial Download here and give a whirl!
Download Free Trial Now!
Server monitoring Tools FAQs
How do I choose the right server monitoring tool for my organization?
Choosing the right server monitoring tool depends on the specific needs of your organization, including the number of servers you need to monitor, the types of applications you are running, your budget, and the level of customization and integration you require. It is important to carefully evaluate the different options and choose a tool that meets your specific requirements and provides a good value for your investment. Consider factors such as ease of use, scalability, and integration with your existing infrastructure and tools.
What are some common metrics monitored by server monitoring tools?
Common metrics monitored by server monitoring tools include:
- CPU utilization
- Memory usage
- Disk usage and I/O performance
- Network bandwidth and utilization
- Application response time and availability
- System logs and events
What are some popular server monitoring tools?
There are many server monitoring tools available, but some of the most popular ones include:
- Nagios
- Zabbix
- SolarWinds
- Datadog
- PRTG Network Monitor
- Microsoft System Center Operations Manager (SCOM)
Related Post: Best Hardware Monitoring Software and Tools


Download Free Trial Now!