
Our funding comes from our readers, and we may earn a commission if you make a purchase through the links on our website.
Network Discovery Tools & Software for Automatically Scanning & Discovering Network Devices
UPDATED: January 10, 2024
Modern networks are continually changing with the popularity of Wireless environments and Bring-Your-Own-Device (BYOD) infrastructures becoming more dominant. With these evolving network types comes the challenges for network admins to keep track of their entire networks and devices within those networks.
On top of that, the variety of network devices has also changed. Now, it is not only a desktop computer or server, but Virtual servers, Wireless APs, VoIP boxes, mobiles, switches, and even smartwatches.
Creating Inventories and documenting these types of environments can be overwhelming for any network admin. However, as the network grows, the administrator will have to audit the entire network continually to stay on top of new devices and components into their networks.
Keeping track of all these devices is the key to capacity planning, troubleshooting, and security — this is where a Network Discovery Tool and Software come in handy.
Here is our list of the best network discovery tools and software for automatically scanning and discovering network devices:
- SolarWinds Network Performance Monitor – EDITOR'S CHOICE An excellent network monitoring system that uses SNMP to identify and map network devices and their connections. Both the device inventory and network topology map are automatically updated. Installs on Windows Server. Start a 30-day free trial.
- SolarWinds Network Topology Mapper – FREE TRIAL A specialized network discovery and mapping tool that forms the basis for network monitoring. Installs on Windows Server. Download a 14-day free trial.
- Site24x7 – FREE TRIAL Excels as a network discovery tool, adept at meeting the needs of modern IT environments. It automates the discovery of network devices and provides real-time network topology mapping. This comprehensive view, combined with customizable dashboards and integration with performance monitoring tools, makes it an efficient choice for organizations seeking accurate and in-depth network insights. Start a 30-day free trial.
- Paessler PRTG Network Monitor – FREE TRIAL A collection of IT resource monitors that includes network discovery and automatic topology mapping features. Installs on Windows Server. Start a 30-day free trial.
- Domotz A SaaS package that offers network monitoring, based on an asset inventory compiled from autodiscovery sweeps.
- Fortra's Intermapper A device discovery tool that is very strong on topology mapping and can even overlay a network topology over a real-world map.
- NetBrain A network automation platform for large businesses that includes the autodiscovery of devices connected to a network.
- ManageEngine OpManager This network monitor offers a range of topology maps that are based on a constantly updated device inventory. Installs on Windows Server and Linux.
- WhatsUp Gold A network monitor with autodiscovery and network topology mapping features. Installs on Windows Server.
- Nagios XI A Linux-based resource monitoring suite that can be extended by a large library of plugins and includes network discovery and topology mapping features. Installs on Linux.
- Cacti A free network data interpreter that includes a library of templates for network topology mapping. Installs on Windows and Linux.
- OpsView Monitor A system monitoring tool that can be extended by Nagios plugins and includes an autodiscovery feature. Installs on Windows Server and Linux.
- NetProbe A simple network monitoring tool for Windows that is based on an autodiscovery process that produces a network layout plan.
- Zenmap A free graphical interface that interprets network data sourced through Nmap and creates a network map from autodiscovery data.
- Spiceworks A free, ad-supported online website monitoring tool that traces devices across the internet.
What is Network Discovery?
Network Discovery is the process, either automatically or manually, to find new devices and their interfaces.
A Network discovery tool can help find everything that is connected to a network, create topology maps, and generate reports.
This type of software scans the entire network, identifies its components, and creates an inventory.
With this information, the software can create visualizations of the physical and virtual network connectivity. These tools can consolidate two essential functions, scanning a network, and mapping it automatically.
The Best Network Discovery Tools
Our methodology for selecting network discovery tools and software
We reviewed the network discovery tools and software market and analyzed the options based on the following criteria:
- An autodiscovery system to log all network devices
- A network topology mapper
- The ability to collect live network device statuses by using SNMP
- A facility to analyze network performance over time
- Graphical interpretation of data, such as charts and graphs
- A free trial period, a demo, or a money-back guarantee for no-risk assessment
- A good price that reflects value for money when compared to the functions offered
With these selection criteria in mind, we have found several network scanners that can discover and log all connected network devices. We have included packages that will install on Windows and Linux and also cloud-based platforms.
1. SolarWinds Network Performance Monitor – FREE TRIAL
SolarWinds Network Performance Monitor “NPM” is more than just a network discovery tool. It is a comprehensive multi-vendor network monitoring software, designed for medium to large-scale businesses.
NPM scans the network with its devices, endpoints, and links (whether physical or logical).
The auto-discovery process creates an intelligent network map that helps you visualize graphical and contextual representations. If the network changes, such as new devices are added, moved, or removed, the maps will update automatically.
This map shows all relationships between devices which include, routers, interfaces, WAN links to remote sites, cloud-based services, wireless systems, firewalls, and a lot more.
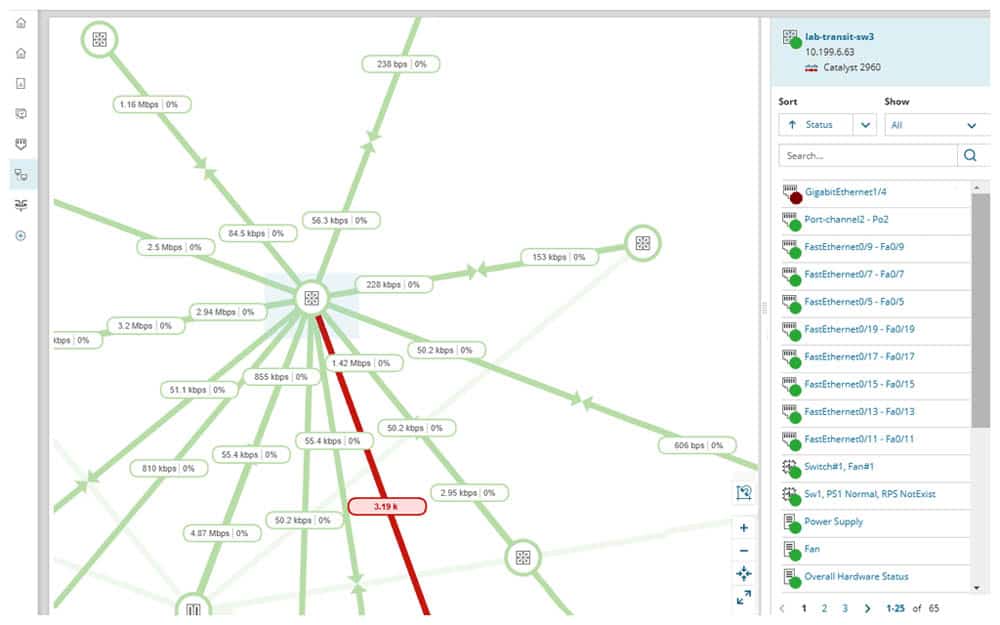
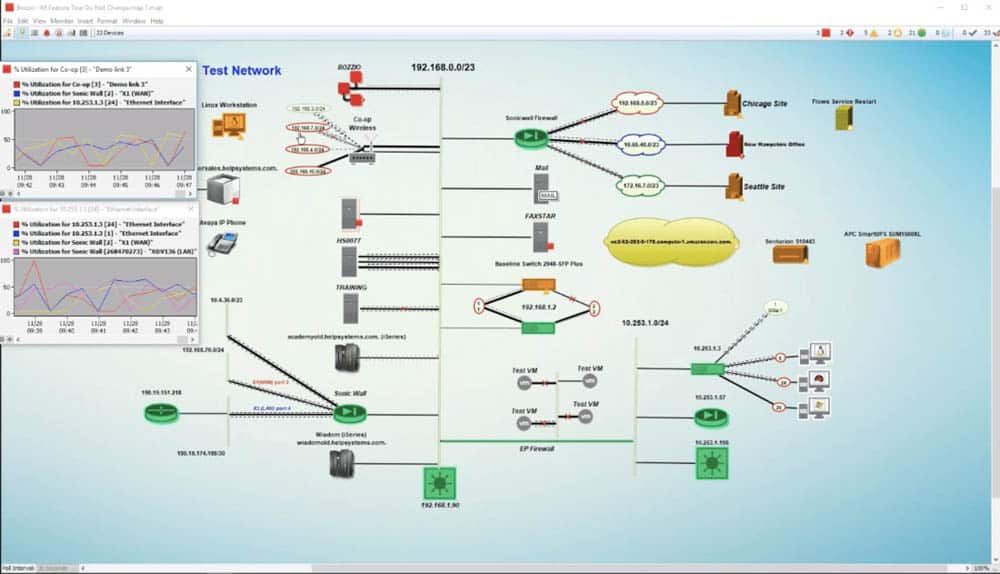
The following screenshot shows an automated intelligent mapping, displaying many running links toward a Cisco router and a link down (colored in red).
The map shows topology connections which are the lines showing interface bandwidth, outbound traffic, and utilization in percentage.
What are some features related to network discovery and mapping?
- Wireless Heat Maps: With WiFi Monitor, an integrated tool in NPM, you can create Wireless Heat Maps that helps you visualize the signal strength and the location of clients. You can also optimize your WiFi network by troubleshooting signal overlaps and dead zone areas.
- Color-Coded Maps: The maps use different colors to help visualization. An overloaded connection is red, up and running connection is green, and warning links in yellow.
- Visualize Traffic, Performance, and Configuration: NPM with the help of SolarWinds NetPath can show you a hop-by-hop traffic analysis of on-premises, cloud, or hybrid environments. NetPath can also measure the performance characteristics of each node and its links.
- Correlate Network Data Across the Entire IT stack: With the integrated tool, PerfStack you can troubleshoot much faster. With PerfStack you compare different data types side-by-side in one dashboard and see data on the same timeline.
- Visualize and Monitor SDNs: NPM, with the help of Cisco ACI, lets you monitor your Software Defined Networks “SDNs.” You can keep track of your logical network, including APICs, tenants, spins, leaves, endpoint groups, etc.
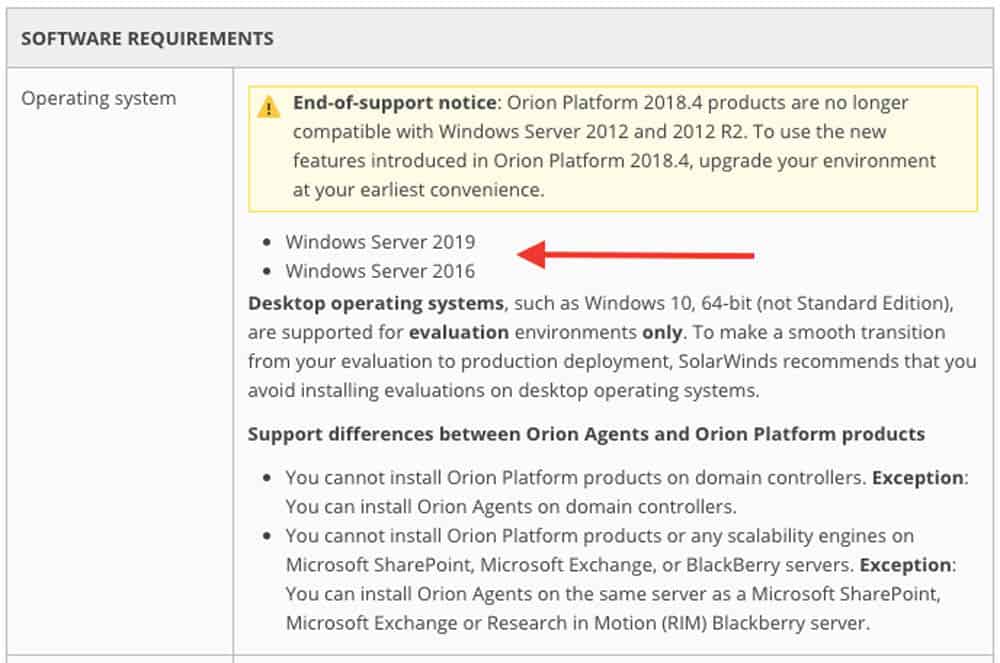
Network Performance Analyzer is only supported by Windows Server 2016 and 2019.
Pros:
- Supports auto-discovery that builds network topology maps and inventory lists in real time based on devices that enter the network
- Has some of the best alerting features that balance effectiveness with ease of use
- Supports both SNMP monitoring as well as packet analysis, giving you more control over monitoring than similar tools
- Uses drag and drop widgets to customize the look and feel of the dashboard
- Tons of preconfigured templates, reports, and dashboard views
Cons:
- Is a feature-rich tool that will require a time investment to properly learn
EDITOR'S CHOICE
SolarWinds Network Performance Monitor is our top pick for a network discovery tool because the network scan phase of this service is continuous. After initially compiling a network inventory, the Network Performance Monitor draws up a network topology map. The process repeats periodically to identify any changes to the network adjusts the inventory and maps accordingly. The inventory is the basis of a network monitoring system, so you get more than just a discovery tool with this package.
Download: Start 30-day Free Trial
Official Site: solarwinds.com/network-performance-monitor/registration
OS: Windows Server
2. SolarWinds Network Topology Mapper – FREE TRIAL
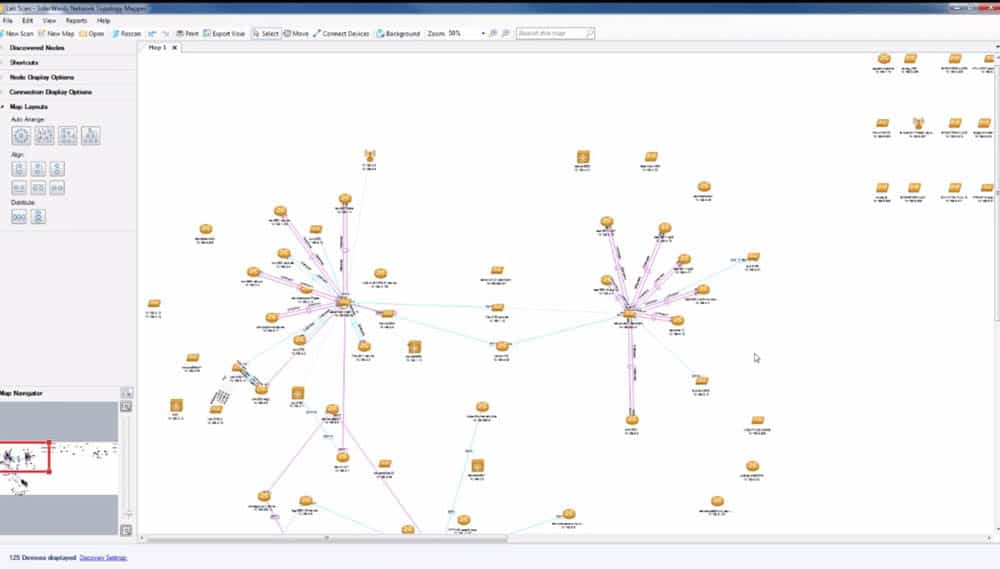
Network Topology Mapper, developed by SolarWinds, is an advanced mapping software capable of creating automatic network maps. In contrast to the Network Performance Monitor that does it all, the Topology Mapper focuses only on scanning and mapping networks.
This tool is capable of scanning and finding network devices, virtual hosts, servers, and more. From the scan results, you can build one or multiple maps and export them to Visio. Network Topology Mapper can also detect any changes in the network topology automatically and send alerts.
How to discover a network and create a map with the Network Topology Mapper?
- Enter SNMP, WMI, and VMWare credentials.
- Identify the network. You have two options, add a new subnet or a seed device (core or central device). The last option brings up subnets that are important to your network.
- Exclude certain devices.
- Schedule the network discovery process to run again anytime.
- All the nodes found will be listed in an inventory, and an interactive map will be created automatically.
The map created is interactive. You can add or remove nodes from the map, individually or as groups. The group of nodes can be labeled with roles, such as vendor, machine type, location, subnet VLAN, or unidentified.
All the nodes will be displayed as clickable icons. You can get in-depth information about the status of each node. You can also generate inventory reports with raw network data and export them into CVS.
Pros:
- Uses auto-discover for automated mapping, great for larger more complex networks
- Uses multiple protocols to identify network devices, ICMP, SNMP, WMI, and CDP
- Designed to work in virtual environments and supports both VMWare and Hyper-V hosting
- Can build static maps and include devices from your network for capacity planning and testing
Cons:
- Would like to see a longer trial period
Price: The Network Topology Mapper is cheaper than the full NPM. It starts at $1380.00 (USD), for more details on their license get a quote.
Download: Free fully functional trial of Network Topology Mapper from SolarWinds for 14 days.
3. Site24x7 – FREE TRIAL
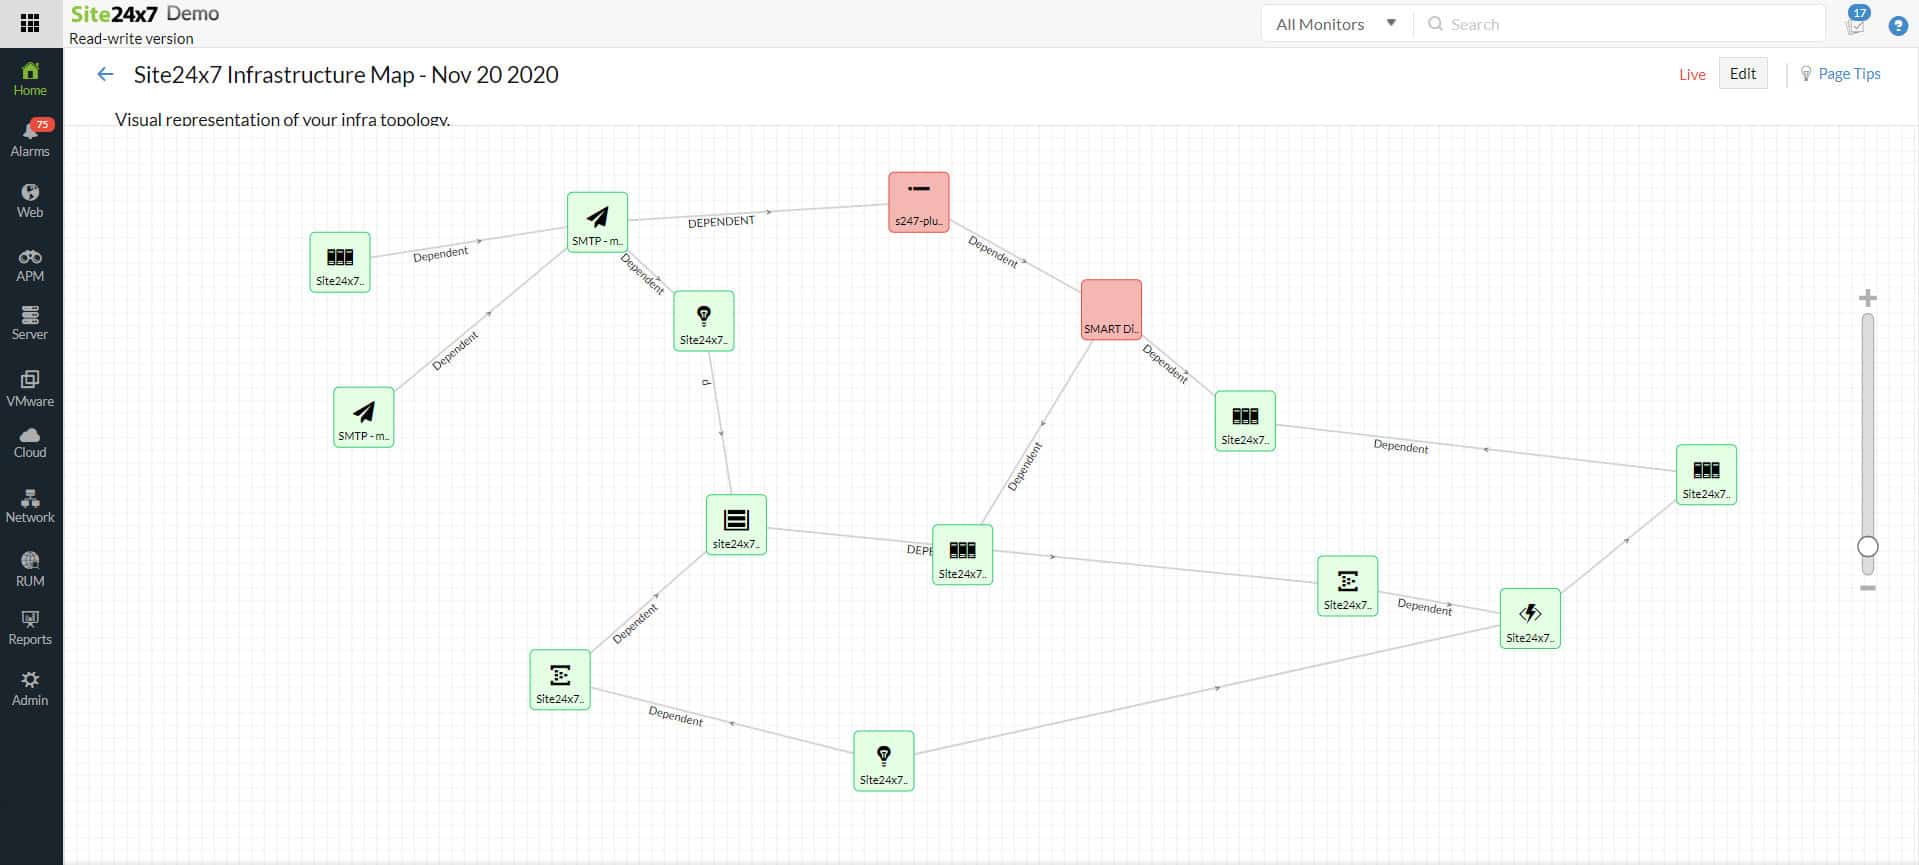
Site24x7 stands out in the field of network discovery tools, catering to modern IT environments that require detailed and automated discovery of network devices and topology. Its strengths lie in its ability to provide a comprehensive view of the network landscape, facilitating better management and monitoring. This makes Site24x7 a highly suitable option for organizations seeking an efficient and accurate network discovery tool.
Key Features
- Automated discovery of network devices, including routers, switches, and firewalls
- Real-time mapping of network topology for an up-to-date view of network structure
- Customizable dashboards that provide detailed insights into network health and performance
- Integration with performance monitoring tools for a holistic view of network and system health
- Advanced alerting system to notify administrators of network changes or issues
Why do we recommend it?
Site24x7 is recommended for its robust network discovery capabilities, complemented by its real-time network mapping and comprehensive monitoring features. It is a powerful tool for organizations needing accurate and automated discovery of their network topology and devices.
Who is it recommended for?
This tool is ideal for network administrators and IT professionals in medium to large-scale enterprises that have complex network infrastructures. It’s particularly useful for environments where continuous monitoring and automated updates of network topology are essential.
Pros:
- Automated and accurate discovery of network devices
- Real-time network topology mapping
- Integrated performance monitoring for comprehensive insights
Cons:
- May offer more features than needed for simpler network environments
4. Paessler PRTG Network Monitor – FREE TRIAL
PRTG Network Monitor from Paessler is a comprehensive IT infrastructure monitoring tool. It can keep track of the health and performance of all networking devices, databases, hosts, bandwidth, traffic, applications, and a lot more. It doesn’t matter if your equipment is on the cloud, on premises, or if it’s a hybrid environment, PRTG can monitor almost anything.
Some other elements in the infrastructure that you can monitor are as follows:
- Cloud services
- Online app services
- Internet-of-Things
- Packet loss
- Network Traffic
- NetFlow Analyzer
- LAN analyzer
- Physical environment
- Virtual Server
- Active Directory
PRTG uses the concept of monitoring sensors, to keep track of all of these metrics from a single platform. The sensors are the essential monitoring elements and measure a single value in the entire network. Sensors are also used as a licensing model in PRTG.
When running PRTG for the first time, these sensors must be defined (or the software will keep defaults). After that, the software can begin a network scanning process, referred to as Auto-discovery to find a wide range of devices and their links. When the network elements are discovered and thoroughly documented, the sensors can start to monitor them.
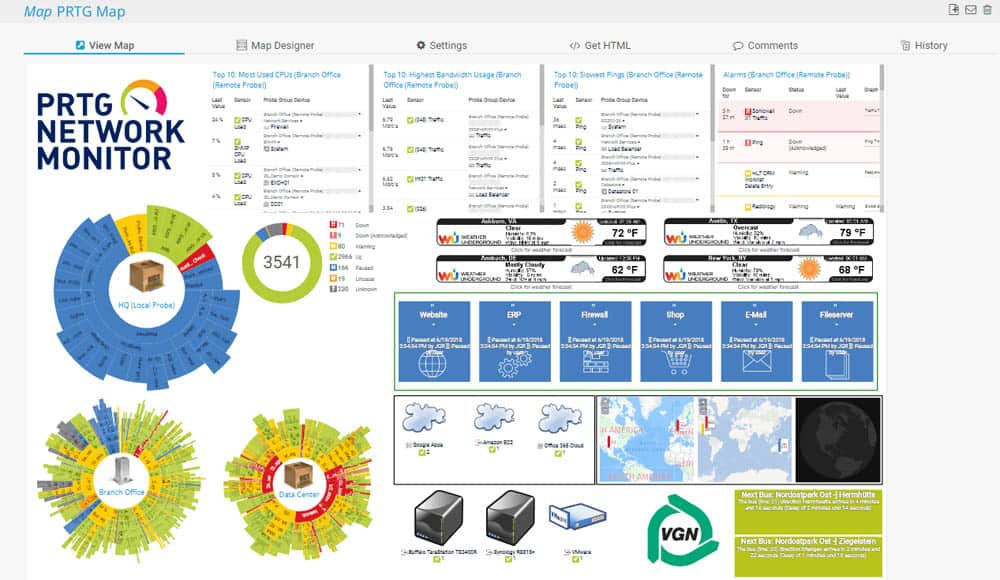
All updated monitoring status data can be used with a “PRTG map” to create web-page reports. With the help of its customizable layouts, you can design overview pages with in-depth information and publish them.
PRTG maps can show information of all the elements on your network, including:
- The Status icons on every device.
- A quick network view for internal NOC or Intranet.
- A custom view of monitoring sensors, such as Virtualization, WAN links, Wi-Fi, Cloud, VoIP, etc.
- The map with connection lines and geographical locations.
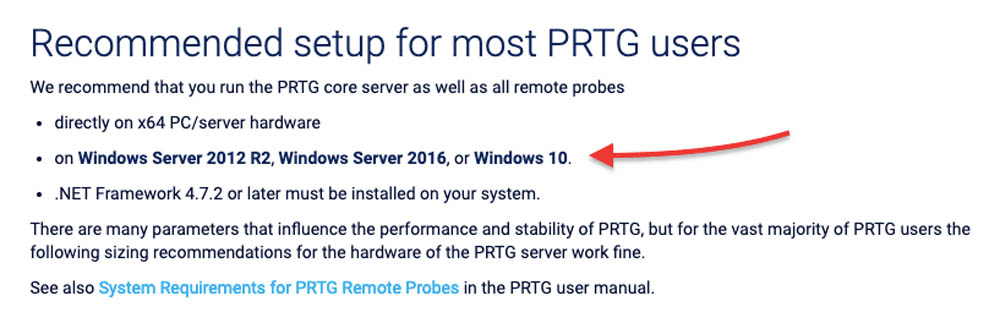
PRTG on-premises is only compatible on Windows Servers.
Pros:
- Uses a combination of packet sniffing, WMI, and SNMP to report network performance data
- Fully customizable dashboard is great for both lone administrators as well as NOC teams
- Drag and drop editor makes it easy to build custom views and reports
- Supports a wide range of alert integrations such as SMS, email, and integrations into platforms like Slack
- Supports a freeware version
Cons:
- Is a very detailed platform with many features that require time to learn
Price: You can purchase PRTG through different packages based on the number of sensors and server installations. For example, PRTG500 allows 500 sensors and one server installation for $1,360 (USD) on a one-time payment including 12-month maintenance.
Download: Fully functional 30-day free trial of Paessler PRTG (make sure you are using a Windows PC).
5. Domotz
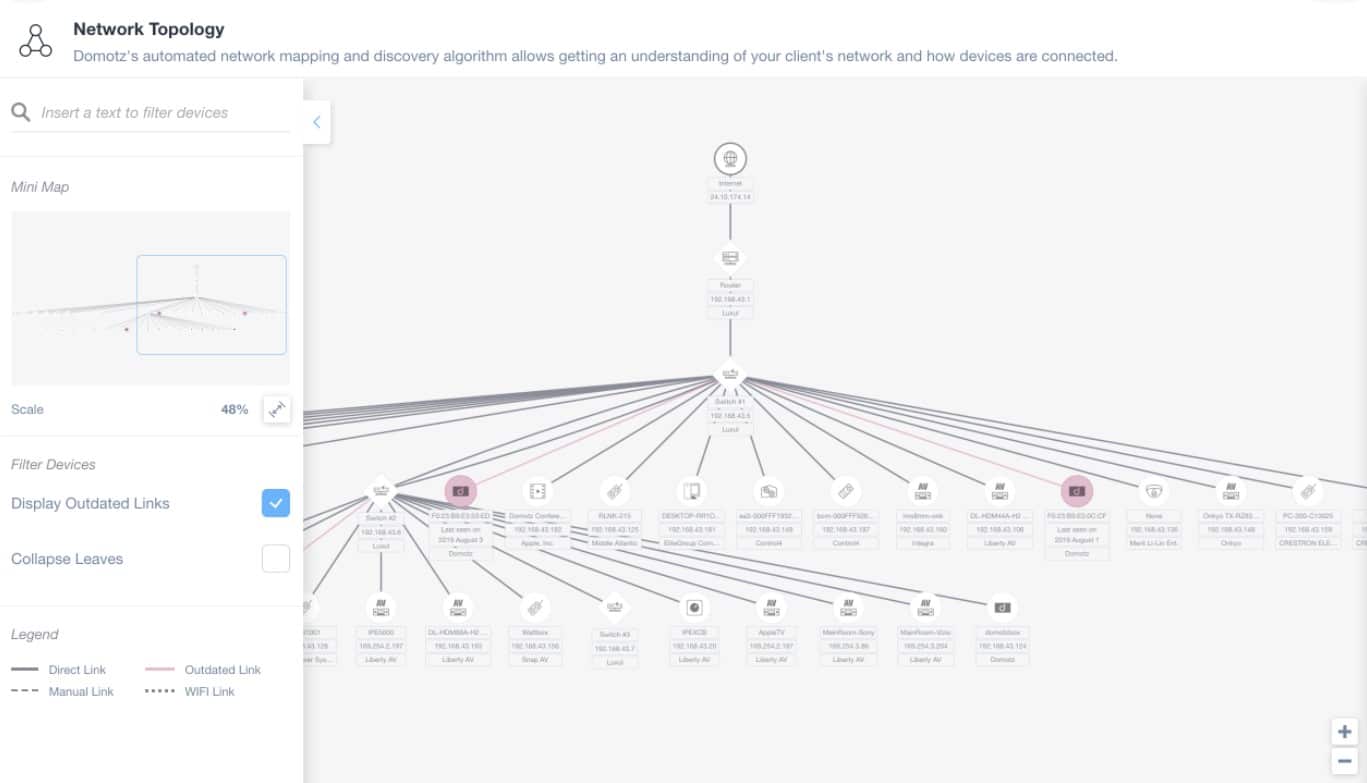
Domotz is a SaaS platform that provides network monitoring and is able to merge the supervision of multiple networks. The system has a multi-tenant architecture available, which makes it an ideal tool for managed service providers (MSPs).
Domotz downloads an agent program onto a host connected to the network that is going to be monitored. If the system is being used to monitor multiple networks, each site will need the agent installed on it.
The agent performs a sweep of the network with the Simple Network Monitoring Protocol (SNMP) and other network protocols such as Bonjour (Multicast-DNS) queries, UPn, DHCP monitoring and NetBIOS queries. This system recycles continuously, with the agent requesting reports from device agents. The reports are then uploaded to the Domotz server.
The Domotz software on the cloud server scans through each report and creates a device details page for each. It then creates a menu for these detail pages, which acts as a summary of all devices, making an asset inventory.
Domotz then runs through each of the ports on each device, creating a switch port map. This includes information on the device that is connected to the port. From the details these assessments provide, Domotz is able to draw up a network map.
As each cycle of device reports gets uploaded, the asset inventory and map are renewed. The asset inventory also forms the basis of a live network performance monitoring display. Data is also stored for reloading into a demand analysis and capacity planning tool.
Pros:
- Suitable for IT departments and managed service providers
- Can unify the monitoring of multiple networks
- Flat charge rate regardless of network size
- Asset inventory and network map
- Live network performance monitoring
Cons:
- Doesn’t include bandwidth analysis
Price: The standard package for Domotz is called Pro and it is charged at $21 per site per month and it doesn’t matter how many nodes there are on the network. There is also a customized plan, called Enterprise, which is priced by negotiation.
Download: Access a 14-day free trial.
6. Fortra's Intermapper

Intermapper is a network monitoring software developed by Fortra. It is capable of capturing network information, creating detailed and dynamic maps, and alert you of potential problems.
This tool offers maps with the highest level of visibility and customization as compared with other tools. Intermapper maps can help you identify which devices are down and what is their location. You can change the layout, icons, image, etc.
You can also integrate Intermapper with Google Earth to see how network devices are spread on a geographical space. You can also upload floor plans or layout images to use as a background for your network map.
Below is a screenshot with Google Earth and geo-location data of network devices. If a device is down, the map will show a real-time alert with the exact location.
Intermapper also provides a robust notification system. It allows you to configure alerts on certain devices based on thresholds, create notification schedules, and select alerts for one or a group of devices.
These alerts are displayed in the central console, but you can also configure Intermapper to send them via email, or SMS.
How does Intermapper perform network discovery and mapping?
Intermapper comes with an auto-discovery feature that finds all devices whether physical, virtual, or hybrid, from your IT infrastructure. This feature creates a visual inventory of all network devices found.
Step-by-step process.
- Import devices manually, perform an IP sweep, or SNMP.
- Capture new devices or existing ones.
- Create an inventory of the network.
- Place devices on the map.
- Perform scheduled network discovery again to find new devices.
Intermapper can keep track of the entire network using SNMP and ping. It also supports traffic monitoring protocols such as NetFlow, sFlow, or J-Flow.
Pros:
- Offers a free and paid version
- Is capable of using auto-discovery to find new devices
- Features SLA compliance reporting, good for MSPs and larger networks
- Available on Windows, Linux, and Mac, making it a flexible option across multiple operating systems
Cons:
- The interface feels outdated, making it difficult to navigate at times
- Visual options are limited
- Maps are generally not visually appealing, and not great if used in a presentation
Price: The licensing method is pay-as-you-use. You pay for the number of devices that you want to monitor. There are three plans, Free, Subscription, Device-based, and Unlimited. The price is not on the website, but you can get a quote.
Download: Intermapper is supported by Linux, Windows, and MacOS systems. Start a free 30-day full-version Intermapper trial or download the free version that allows unlimited monitoring for up to 10 devices.
7. NetBrain
NetBrain identifies itself as a Network Automation platform made for large-scale businesses. They aim to help network admins to automate repetitive management tasks such as documentation, troubleshooting, change management, and cyber-security.
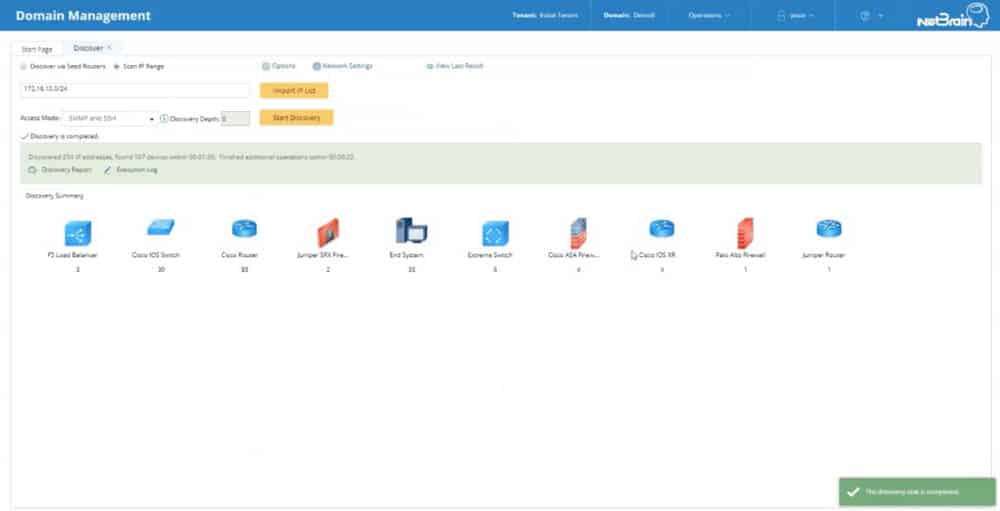
NetBrain can automatically discover devices on your network and create inventories. The auto-discovery engine gathers CLI data (ping, traceroute, arp-a, NetBIOS, etc.) or SNMP from all devices.
To scan your network, start by providing an IP address of an authoritative router, such as a core device. Then let NetBrain use its algorithm to figure out the network and provide an overview of the entire topology.
The tool will find not only endpoints but also routers, switches, firewalls, and more. Their new feature allows you to discover data from an SDN (Software Defined Network) through an API and create a map.
NetBrain’s Network Discovery features?
- Fast scanning. Discover up to 2k devices per hour.
- Discover entire L2/L3 network infrastructure. Find route tables, CDP tables, SNMP devices,
- Scan on demand or scheduled. Set up an automatic network discovery at certain times to find new hosts.
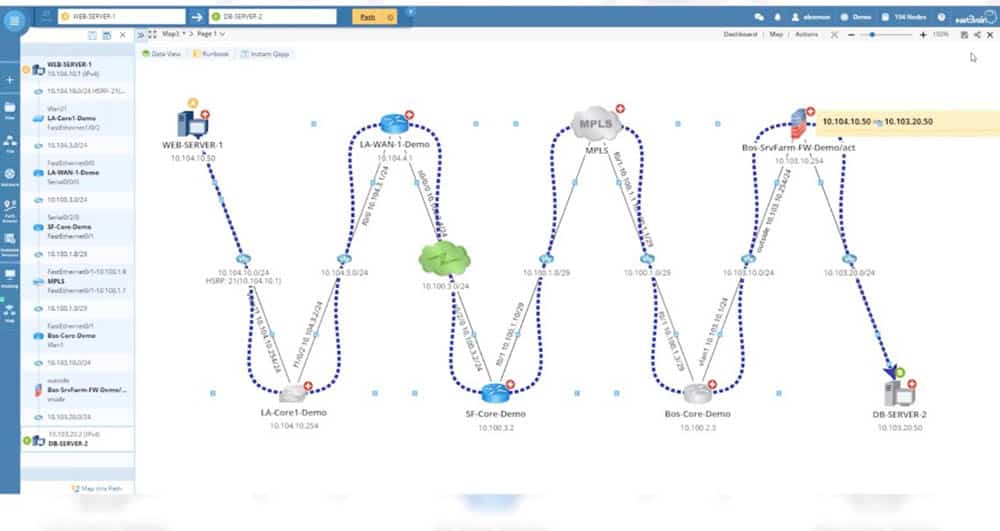
NetBrain is also capable of delivering a graphical representation of your network through dynamic maps, which can help you identify bottlenecks in traffic. To create a map, enter the source and destination. The application will create a map and path of the network in real time. NetBrain can map out any environment whether it is physical, virtual, SDN, or hybrid.
Pros:
- Simple graphics get the job done without cluttering the dashboard
- Autodiscovery can automatically identify Cisco ACI and other devices
- Provides insights through automatic diagnostic scans
- Great for mapping out complicated environments
Cons:
- Must contact sales for pricing
- Would like to see more out-of-the-box features
- Could use better historical data analysis tools
Price: The price is not published on the website.
Download: NetBrain does not offer free trials, only a demo. Contact them to schedule a personalized demo.
8. ManageEngine OpManager
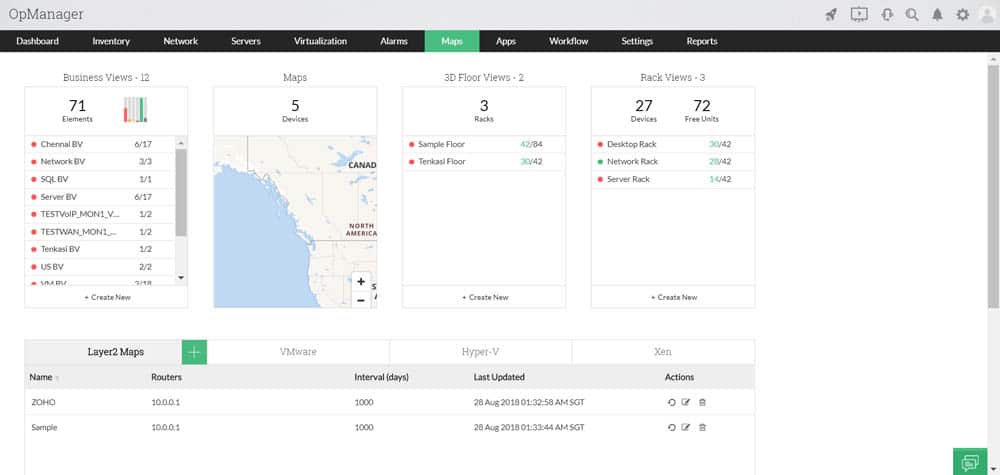
OpManager from ManageEngine is not only a Network Discovery Tool, but it is also a complete network monitoring and management software. It can keep track of your network performance in real-time and identify faults proactively. OpManager allows full management of network, servers, faults, performance, storage, add-ons, and plugins— all in one platform.
This tool allows high scalability for up to 10k devices while enabling high availability. With OpManager you can monitor all your distributed networks across data centers, remote offices, and the cloud.
OpManager allows automatic network mapping and discovery. It helps you to create and configure maps of the entire network. Once OpManager is installed, the auto-discovery feature starts to scan the network (refer to the screenshot below) for devices and their connections.
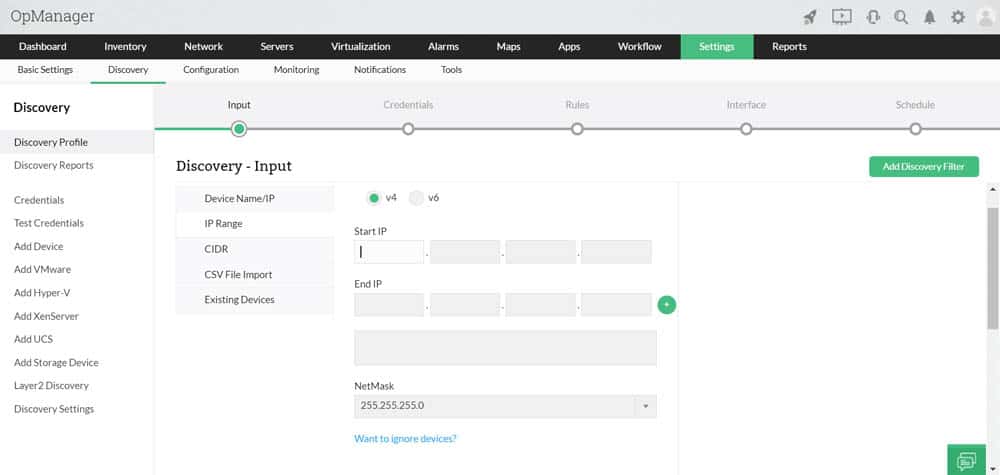
To begin with auto-discovery, you only need to define the IP range. The tool documents everything, creates network maps, and continues to scan the network periodically.
How does OpManager discover new components?
- Starts with an IP Sweep, using the IP range defined in the setup.
- It uses ICMP, SNMP (v1, v2, and v3), WMI, or Telnet to discover a wide range of network components.
- The discovery process outputs information such as device type, OS, services, etc.
Once OpManager discovers devices and their information, it can create maps in multiple formats. For example, it can create L2/L3 network infrastructure maps, 3D floor views, rack views, and world view or geographical maps.
Pros:
- Uses both SNMP and NetFlow for monitoring giving it more coverage options than other tools
- Can scale easily, Enterprise package supports up to 10,000 endpoints
- Utilizes automatic network discovery to create live inventories and network maps for administrators to track assets and network size
- Freeware and paid versions allow for both small and large size networks to effectively use this tool
Cons:
- OpManager is dense with features, integrations, and settings, and may take time to fully master
OpManager can only run on Linux distributions and Windows environments. The product has a free license that allows you to test it in your network for up to 10 monitoring devices.
Price: There are three different pricing models, Essential, Enterprise, Service Packs, and Free. The price is not on the official site of ManageEngine, but you can request a quote by filling an application.
Download: a 100% free OpManager edition that can monitor up to 10 devices for an unlimited time.
9. WhatsUp Gold
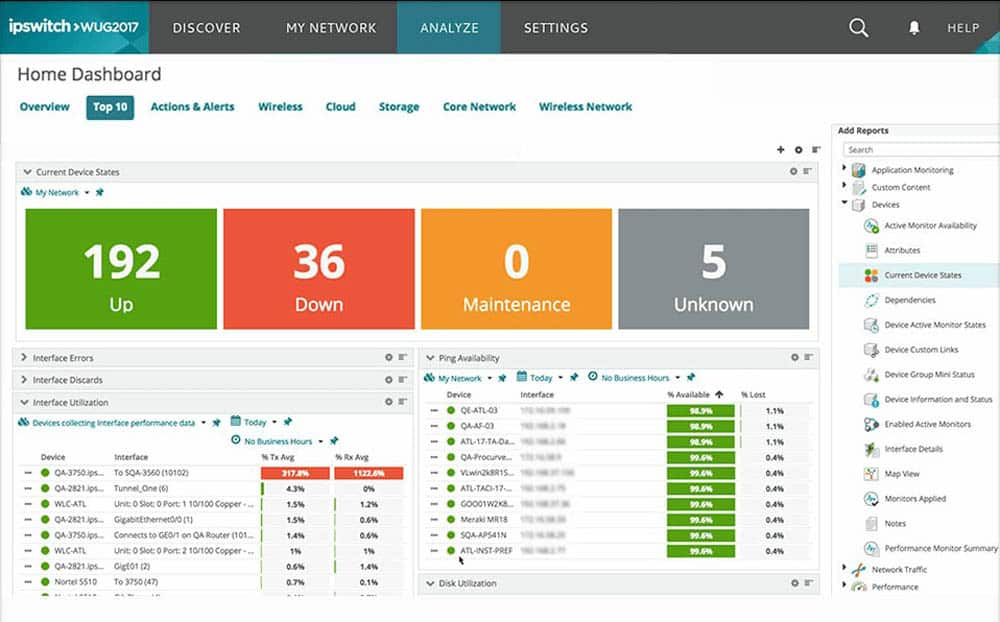
WhatsUp Gold is a network availability and performance monitoring software, developed by IPSwitch. It provides an overview of the applications, devices, and servers, whether they are located on premises, or in the cloud.
WhatsUp Gold has a powerful auto-discovery feature that puts the results in a detailed and dynamic map. With this map, you can monitor everything, from wireless, VMs, apps, Traffic flows, cloud environments, etc.
The interactive map allows you to see the health of the entire network, and have access to every single device with rich reports. You can also gain more visibility with the help of its alerting system. Whenever there is an alert, it can notify you via Email.
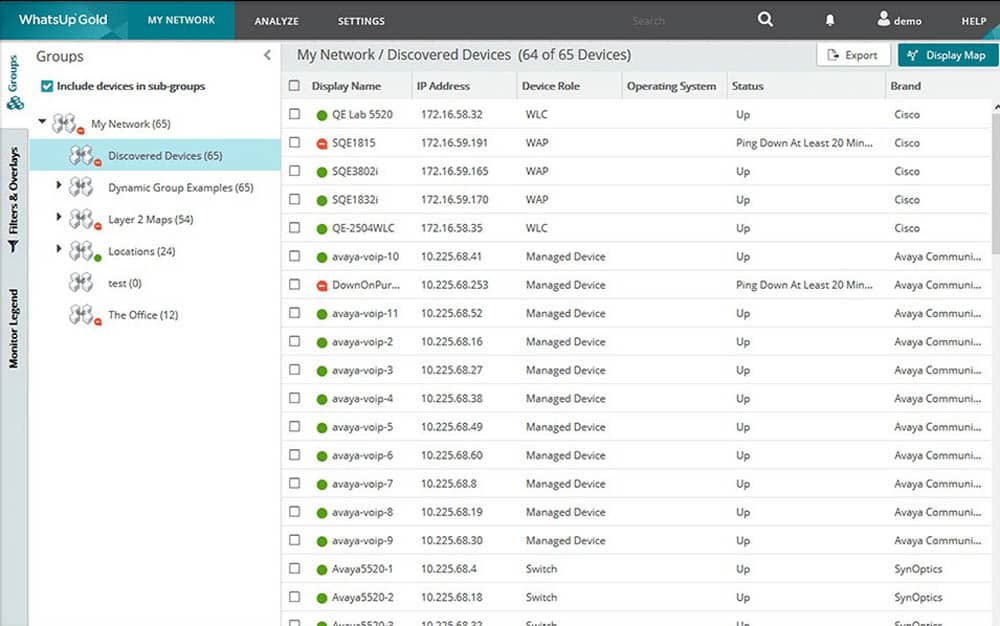
How does WhatsUp Gold perform network discovery and mapping?
WhatsUp Gold is capable of discovering Layer 2/3 devices and creating a map and an IT inventory of all the assets. If any device is having trouble with connectivity, the tool can help you troubleshoot with a Layer 2/3 trace and a finder.
- Start with a device scan. Choose a single IP or a subnet. You can also include Gateway IP or cloud devices.
- Give more details. You can expand your scan to your Virtual, Wireless, or Storage infrastructures. You can also exclude specific IPs.
- Discover the network with one or a combination of the following methods, ARP, SNMP, SSH, PING, and LLDP.
- Document and create an inventory of the results, including devices and their connectivities.
- The network map and inventory can help you visualize the entire topology. Each device in the map is clickable and shows in-depth details about the performance and its information.
- Run more discoveries. You can run Auto-Discovery on a schedule or on-demand.
WhatsUp Gold is compatible with Windows Server 2008 R2, 2012, 2012 R2, and 2016.
Pros:
- Uses simple visualizations to help provide at-a-glance insights
- Supports modular pricing, allowing companies to pay only for features they intend to use
- Can monitor LANs, WANs, and cloud-based applications such as container environments
Cons:
- Modular upgrades might not be a good fit if you intend on utilizing all aspects of a networking monitor
Price: WhatsUp Gold has three different editions, Premium Annual Subscription (device-based), Premium License (device-based), and Total Plus License (point-based). The price is not on the official website, but you can get a quote.
Download: a WhatsUp Gold free trial.
10. Nagios XI
Nagios is a popular network monitoring and management software. It offers two different editions of the product, Nagios Core and Nagios XI. Nagios Core is the free and open source version that can monitor your infrastructure, networks, and servers, and send alerts when there’s an issue. It includes a variety of frontends (including its CGI), Web Interface, and mobile interfaces developed by the open-source community.
Nagios Core requires a longer learning curve. Its implementation and monitoring configuration demand high-level skills in Linux and Scripting. It also lacks advanced reporting, a native user interface, configuration management, and maintenance, among many other essential features.
Nagios XI is the pro-version of Nagios Core. It has a proper user interface, is rich in features, and is easy to implement, and allows auto-discovery.
Nagios XI helps you monitor bandwidth, SNMP, databases, cloud, virtualization, mobile apps, applications, and a lot more. Nagios has a huge community, where users share information, and new plugins, and help each other continuously. The best of all is that this community works for both versions, Core and XI.
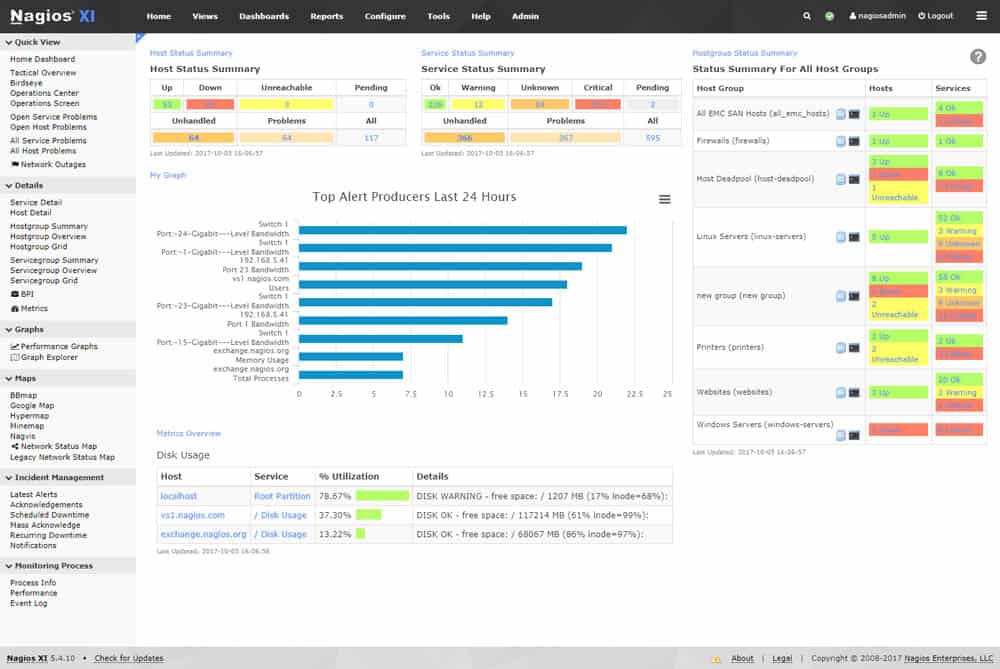
How does Nagios XI perform network discovery and mapping?
The tool includes auto-discovery functionality. This feature is capable of mapping the entire network and creating an inventory list. Auto-discovery is based on two components:
- Auto-Discovery Jobs. This process scans the network to find devices. It uses pings and Nmap commands. To start a discovery job, you have to input scanning parameters such as IP range target, exclude IPs, and schedule it to make it daily, weekly, etc.
- Auto-Discovery Configuration Wizard. The Wizards use the results from the auto-discovery to start monitoring. When the Auto-discovery job finds new devices, the Wizard can import these into the monitoring configuration and assign which services to track.
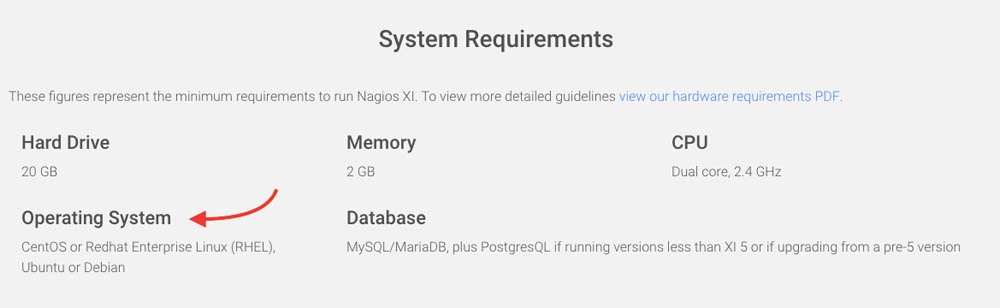
Nagios XI is supported by some Linux distributions such as Ubuntu or Debian and CentOs or RedHat.
Pros:
- Open-source transparent tool
- Simple, yet informative interface
- Flexible alerting options support SMS and email
- Robust API backend makes it a great option for developers who want to integrate their own custom applications
Cons:
- The open-source version lacks the quality support found in paid products
- Installation can be technical and complex
Price: Nagios Core is a free and open-source software. The cost for Nagios XI Enterprise Server and Monitoring Software starts at $1,995.
Download: Get a 60-day free trial of Nagios XI or download open-source Nagios Core for free.
11. Cacti
Cacti is a free and open-source monitoring system created as a front-end for the time-series data manager and graphing tool known as, RDDTool. But Cacti offers more features, such as polling services, advanced graphing templates, user management, and multiple data collection methods.
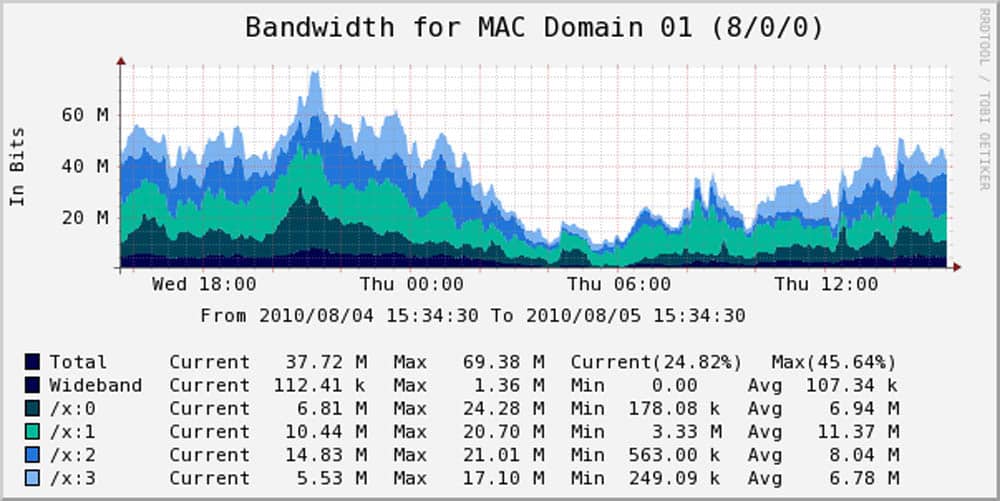
You can use Cacti to graph metrics like bandwidth, network usage, memory, CPU load, etc. With this information, you can keep track of the essential components of a network. If you want to monitor network traffic, Cacti uses SNMP to poll data from routers or switches.
Cacti comes with a large number of graphing templates that allow full customization. You can create multiple users and assign different permission levels to the interface, including their own graph sets. This tool can be useful in leased service environments, such as web-hosting providers, storage services, or SaaS because users can monitor their consumption with the graphs.
You can also directly configure Cacti for collecting data and avoid manual configuration of the RDDTool. Cacti includes a data input method that allows you to enter data-gathering custom scripts.
How does Cacti discover a network?
- It uses SNMP or a script to gather information about devices.
- It creates a network inventory based on the information gathered.
- It keeps the inventory updated by sending periodic SNMP polls.
- It can also use the PHP-based poller to get SNMP data and even execute scripts.
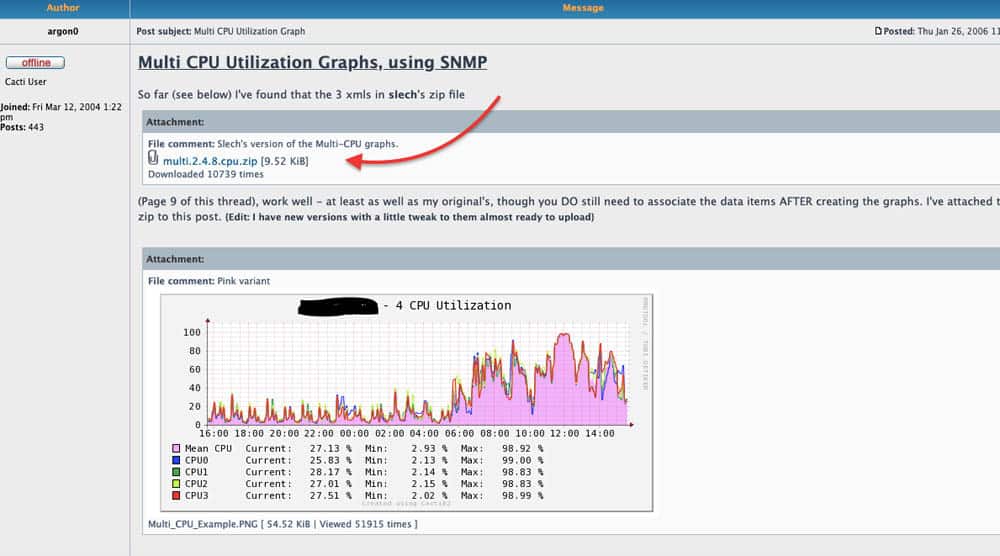
The following screenshot shows one of the many templates that you can download. This one can do multi-CPU Utilization Graphs using SNMP.
Cacti is compatible with Linux, Unix, and Windows.
Pros:
- Highly customizable monitor with a focus on data visualization
- Large dedicated community of over 20,000 members
- Simple interface
- Ideal for researchers looking for more flexibility in their data collection
Cons:
- Has a steeper learning curve than competing products
- Like most open-source products, Cacti lacks a paid support option
Price: Free and open source.
Download: Latest stable version of Cacti from their official website.
12. OpsView Monitor
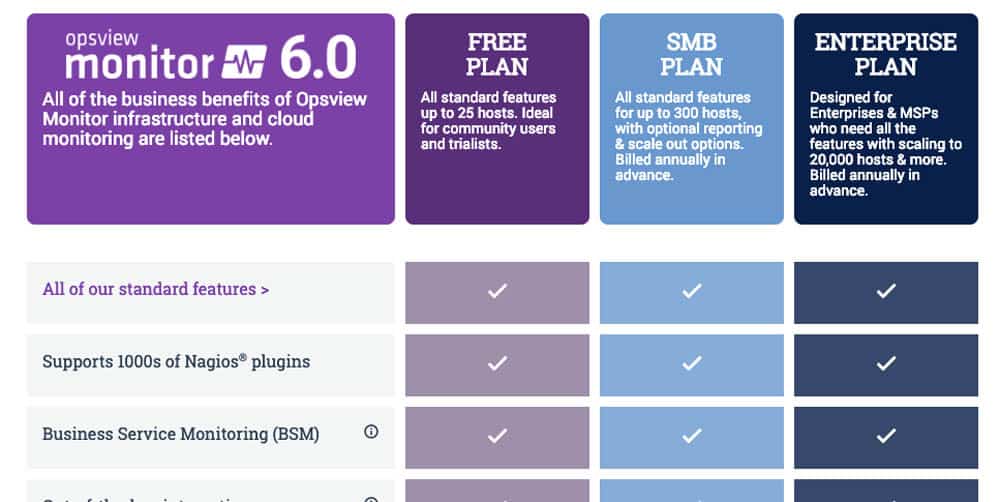
OpsView is a cloud and infrastructure monitoring software. It can discover network devices and automate IT management operations. This software can integrate, out-of-the-box with infrastructure and applications like Jira, VMWare vSphare, AWS, Azure, Cisco, Docker, Office 365, etc., and it is even compatible with the Nagios plugin. If OpsView does not support a specific integration, you can download it from GitHub.
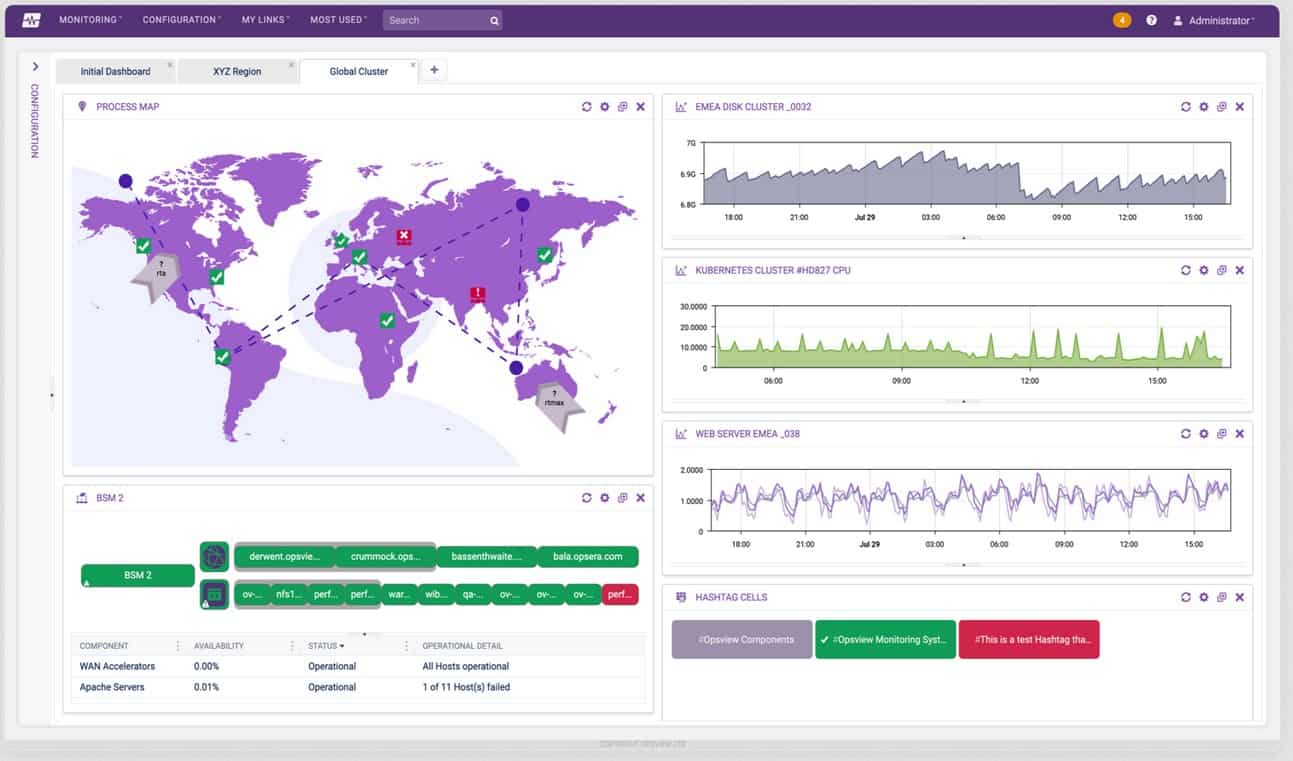
OpView displays real-time information and alerts in its dashboard and through its visual reports. Its auto-discovery feature is capable of finding nodes and creating profiles. With OpsView Auto-discovery feature you can add thousands of devices in a few minutes.
You can also schedule scans on time intervals during the day, to ensure that new devices are also included in the inventory. With this list of devices, you can take a single or a body of hosts and deploy configurations and updates in bulk. You can also add hosts to groups, define host templates, and even include hosts in a hashtag group.
How does OpsView perform network discovery and mapping?
When you are discovering a network with OpsView, start by defining the range of IPs, or scan via DNS hostnames. You will obtain all information on its hardware, software, services, etc.
Pros:
- Supports J-Flow, NetFlow, and sFlow monitoring.
- Clean easy to use interface
- Supports a free and paid version
Cons:
- Would like to see more in-depth AWS integration features
- Alert notifications could be easier to configure
Price: OpsView with three different plans, Free, SMB, and Enterprise. Free for up to 25 hosts, SMB for 50 hosts for $95.00 (USD) or 150 hosts for $290.00 (USD), and Enterprise (over 300 hosts), schedule a demo.
Download: Test up to 25 hosts with Opsview Monitor for unlimited time.
13. NetProbe
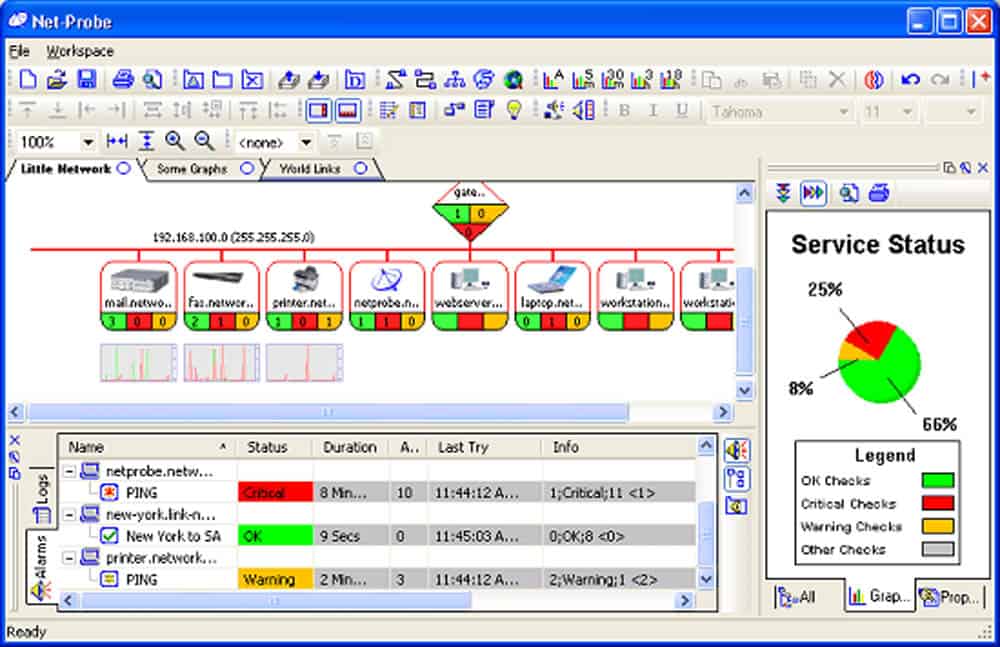
NetProbe is a network device monitoring software. It works with a lightweight monitoring agent that needs to be installed in every device. NetProbe is capable of monitoring any device connected to the network in real-time, by using graphs, an alarm system, and GPS tracking.
NetProbe comes with a visual web interface and a dedicated application. The interface integrates the alarms, graphs, and GPS trackers into a single platform so that you can troubleshoot and monitor your network faster.
Key Features
- Alarm system.
- Notifications and Actions.
- GPS Tracking.
- Real-time graphs.
- Network tools.
NetProbe allows Network Layout Detection. The tool scans your network and creates a graphical representation that shows all devices and their connections. It can also add alarms and graphs automatically.
The NetProbe agent uses plugins to collect local device data and send it to the Netprobe gateway. The plugins determine the type of information that the agents need to collect. The NetProbe needs to be installed in a server that has access to monitoring information, such as an SNMP MIB. Aside from gathering data, the NetPr
Pros:
- Highly detailed, great of admins who are looking for a detailed lightweight tool
- Has a free and paid version
- Can map WAN networks over a physical map
- Supports autodiscovery for live network mapping
Cons:
- Only available for Windows
- Interface is crowded and outdated
- Can be complicated to use, not the most user-friendly option
obe agents can also execute commands and scripts, received from the gateway.
Price: The Standard Version is free and allows monitoring for up to 8 Devices. The cost of NetProbe if you want to upgrade to Pro is $40.00 (USD), for Delux is $80.00 (USD), and for Enterprise is $295.00 (USD).
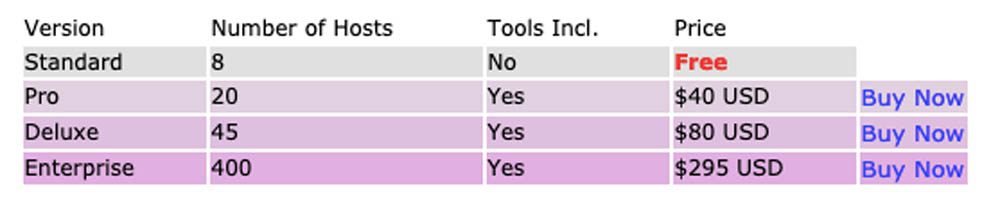
Download: the standard version of NetProbe for free of charge for unlimited time.
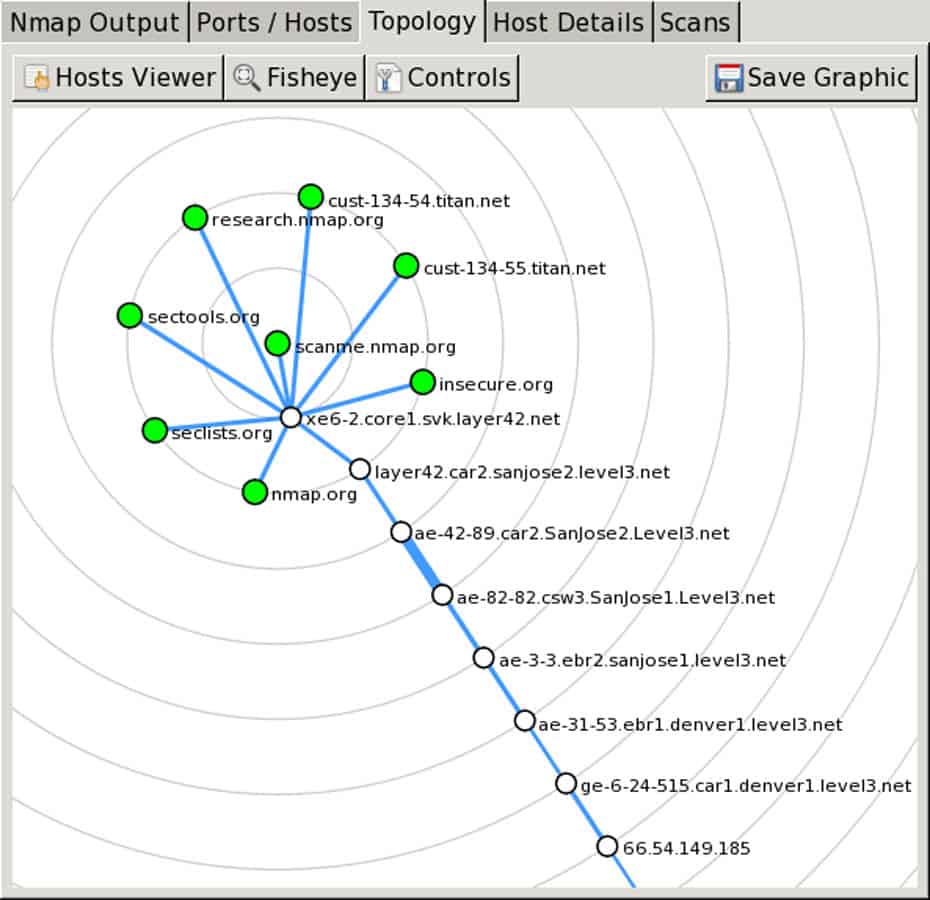
14. Zenmap
Zenmap is the graphical user interface scanner of Nmap, which is a network discovery and security auditing tool. Nmap and Zenmap are both free and open source tools. Zenmap was initially designed to be the easy-to-use version of Nmap while providing the advanced features from Nmap.
Some things that Zenmap provides that Nmap can’t?
- It displays results graphically. It summarizes details and draws a topology of the networks discovered. All the graphics are interactive.
- Compare two different scans. Scan comparison allows you correlate scans based in dates or hosts. Comparing scans allows easy management and tracking of new and old hosts.
- Use scan profiles. With Zenmap you can scan a network and create profiles to run the same scans multiple times.
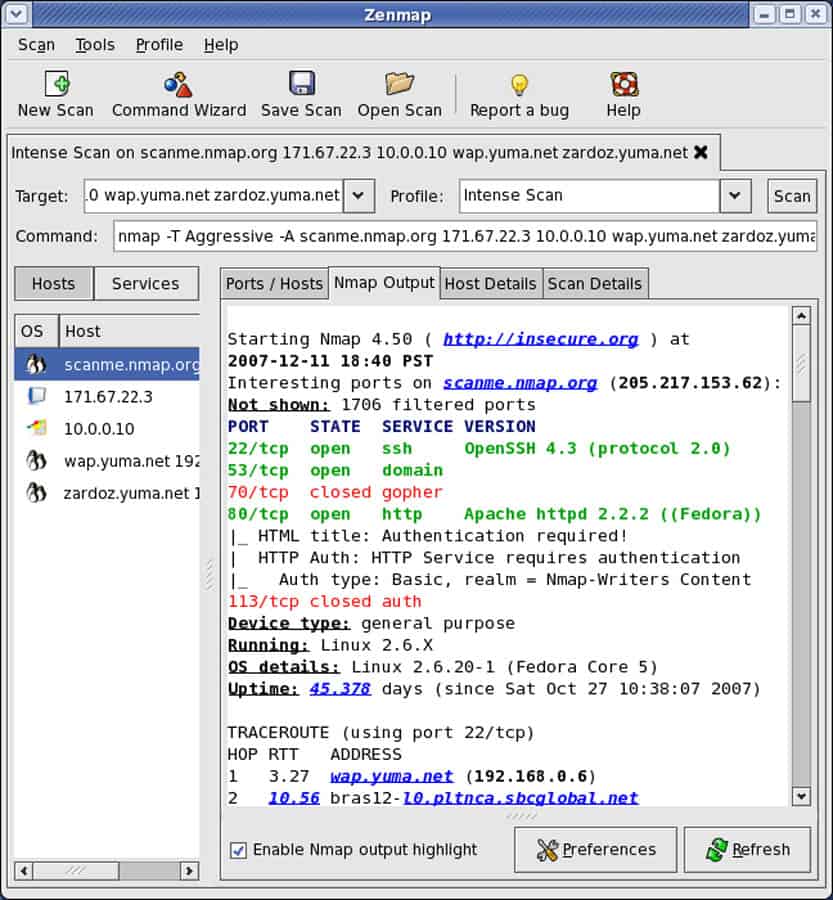
Although Znmap does not offer auto-discovery, it is a fantastic network discovery tool. Its back-end version, Nmap, has countless scanning options. Some of the scanning profiles that come with Zenmap make it easier to scan a network. To scan, select a profile (or if you know Nmap, craft a command), then input a target and click “scan.”
You can also choose among the following profiles:
- Intense scan
- Intense scan plus UDP
- Intense scan, all TCP ports
- Intense scan, no ping
- Ping Scan
- Quick Scan
- Quick scan plus
- Quick traceroute
- Regular Scan
- Slow comprehensive scan
The output can display details of the Nmap command, ports/hosts information, their features, and can even create a customizable graphical topology, like the one on the following screenshot.
Pros:
- Doubles as a security tool, allowing administrators to discover open ports, and applications communicating over ports that are suspicious
- Massive open-source community, is one of the most popular free security tools available
- Offers a CLI version, Nmap for a more lightweight syntax-based version of the product
- Syntax is straightforward and not difficult to learn for most users
Cons:
- Lacks preconfigured reports and templates
- Other products offer better network discovery visualization
- More of a security/auditing tool
Price: Zenmap is a free and open source software.
Download: Zenmap from Nmap’s official website.
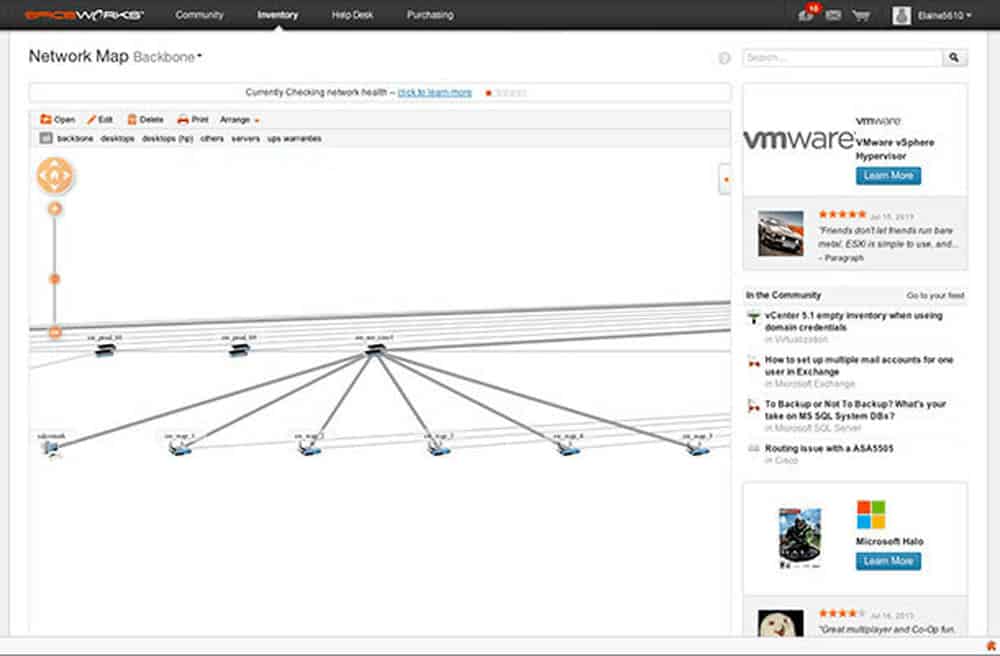
15. Spiceworks
Spiceworks is more than a monitoring tool — it is an online platform built for and by IT professionals. In this platform, users help each other in almost any IT related issue and also compare IT products and services. Spiceworks also develops a free and ad-supported suite of network monitoring tools for small to medium-sized businesses. The software can scan and monitor networks, take inventories, and create reports.
One of the products that allow Network Discovery and Mapping is Spiceworks Inventory. This tool scans your network and creates an inventory of all the connected devices, including software, user information, and even cloud services.
How does Spiceworks perform network discovery:
Spiceworks scans the network through either a ping sweep or a Nmap command. You can configure the software with different scanning time intervals so that it can find new devices connected in the network, schedule scans, customize scan speeds, and Wake-On-LAN scans.
Spiceworks Inventory main features:
- Scan automation.
- Create custom groups.
- Customizable reports.
- Import inventories.
- AD and Email settings.
While Spiceworks Inventory provides comprehensive lists of devices, you can use Spiceworks Network Mapper to create graphical representations of the network. The Mapper will take the information from the Inventory and create complete and customizable maps of the network.
The maps are highly interactive. You can click on a device on the diagram, and it will give you all the information obtained in the Inventory, such as IP, hardware, bandwidth usage, etc.
Spiceworks is compatible with Ubuntu Linux, Debian Unix-like, Windows, and MacOS.
Pros:
- Completely free tool
- Web-based dashboard allows access from virtually anywhere
- Integrates well into other Spiceworks tools like Spiceworks Inventory and Cloud Desk
- Alerts are configured by default, allowing users to get actionable insights right away
Cons:
- User interface could be less crowded, specifically around the home dashboard
- Would like to see more alerting features
- Lacks integrations into other solutions outside of the Spiceworks ecosystem
Price: Spiceworks is a free software supported by ads. It comes with four different plans Individual, Team, Enterprise, and Custom, all for free.
Download: Spiceworks Inventory from free.
Final Thoughts & Conclusion
Some of the tools we included above for Network Discovery are appropriate for Small-to-Medium businesses, and some others are powerful enough to discover and monitor enterprise-level organizations.
At the most basic level, a Network Discovery Tool and software should be able to scan and create inventories. A basic ping sweeper with an organized list of results could be considered a network discovery tool. But features such as auto-discovery, dynamic mapping, and the availability of multiple scanning methods, make a Network Discovery Tool more powerful.
How to choose the right tool?
The basis for making a decision should always be related to your resources. What is your budget? Your existing infrastructure? The size of your network? Answering questions like these will help you decide where to start.
And the best thing…
Is that all the tools mentioned above have Free Downloadable trials (or at least product demos). Testing a product gives you confidence that the product will match your needs.
Have you already tested any of the tools mentioned above? If not, is there another tool that you would recommend? Please, comment below.
Network Discovery Tools & Software FAQs
What should you look for in Network Discovery tools?
We reviewed the market for systems that offer scanning and discovery of network devices and analyzed the options based on the following criteria:
- An automated service that can scan an entire network continuously
- A system that will compile a hardware inventory including all discovered network devices
- A system that is able to spot when devices are added, moved, or removed
- An easy-to-use system that shows live device statuses in the dashboard
- A network topology mapping service
- A free trial or a system that is free to use
- A free tool or a paid system that offers value for money
How can network discovery help improve network management?
Network discovery helps improve network management by providing a clear view of network devices and services, making it easier to manage and maintain the network.
How can network discovery help increase network security?
Network discovery helps increase network security by identifying potential security vulnerabilities, such as open ports and unsecured devices.
How can network discovery help reduce downtime?
Network discovery helps reduce downtime by providing information about the network that can be used to identify and resolve potential issues before they become major problems.
What are the limitations of network discovery?
The limitations of network discovery include the need for accurate network information, the need for network administrators to have knowledge of network protocols, and the potential for network security breaches.
How often should network discovery be performed?
The frequency of network discovery should be determined based on the specific requirements and demands of a network. Some networks may require daily discovery, while others may only require it to be performed on a monthly basis.
Can network discovery be automated?
Yes, network discovery can be automated using network management software or scripts.
What is passive network discovery?
Passive network discovery refers to the process of gathering information about a network without actively sending probes or packets.
What is active network discovery?
Active network discovery refers to the process of actively sending probes or packets to gather information about a network.
How does network discovery differ from network mapping?
Network discovery focuses on identifying the devices and services on a network, while network mapping focuses on visualizing the relationships and connections between these devices and services.

