
Our funding comes from our readers, and we may earn a commission if you make a purchase through the links on our website.
The Best IT Infrastructure Monitoring Tools and Software
UPDATED: November 30, 2023
As a network increases in size and importance, so does the need to ensure the network runs (and keeps running) effectively. To achieve this, it is necessary not only to know what devices make up the IT infrastructure (inventory) but also to keep an eye on those devices in terms of availability, health status, and performance.
While it is possible to manually monitor IT infrastructure, especially on a small network, it can become quite time-consuming and even outrightly impossible in most cases. Because of this, several tools are available to help with IT infrastructure monitoring and these tools will include features like:
- A way to add devices/services to be monitored (e.g. text-based, CLI, GUI)
- Availability, performance monitoring, and/or health status
- Alerting to notify the appropriate persons when something goes wrong (or is about to go wrong) – SMS, Email, Etc.
- Reporting to provide details about what has happened/is happening
Here's the best IT infrastructure monitoring tools & software:
- SolarWinds Network Performance Monitor – EDITOR'S CHOICE A monitoring system that focuses on the statuses of network devices, such as switches, routers, and firewalls. This tool uses SNMP to gather reports from devices and interprets those into data visualizations in the dashboard. Runs on Windows Server. Start 30-day free trial.
- Datadog Infrastructure – FREE TRIAL A type of APM that looks at all of the services running beneath software and goes down to the server resource level. This is a SaaS platform. Get a 14-day free trial.
- Checkmk – FREE TRIAL This system monitoring package covers hybrid infrastructures, which means cloud resources, containers, networks, servers, and services. The package is available to be installed on the user's server or to deploy on the cloud (Azure, AWS, GCP). Get a 30-day free trial.
- PRTG Network Monitor – FREE TRIAL A collection of network, server, and application monitors that is able to fully monitor the entire infrastructure stack underpinning any running software. Installs on Windows Server.
- ManageEngine OpManager Plus – FREE TRIAL A network and server monitoring system that will check all of your hardware and processes to ensure they are running smoothly. Available for Windows Server and Linux.
- Site24x7 Infrastructure – FREE TRIAL A cloud-based monitoring system that covers networks, servers, and applications. This tool watches over all hardware and virtual resources both on-premises and in the cloud.
- SolarWinds Server & Application Monitor – FREE TRIAL A stack monitor that drills down from active software, through supporting services, down to the statuses of server resources. Runs on Windows Server.
- Nagios XI A full infrastructure monitoring package that is based on the free Nagios Core. This tool installs on Linux.
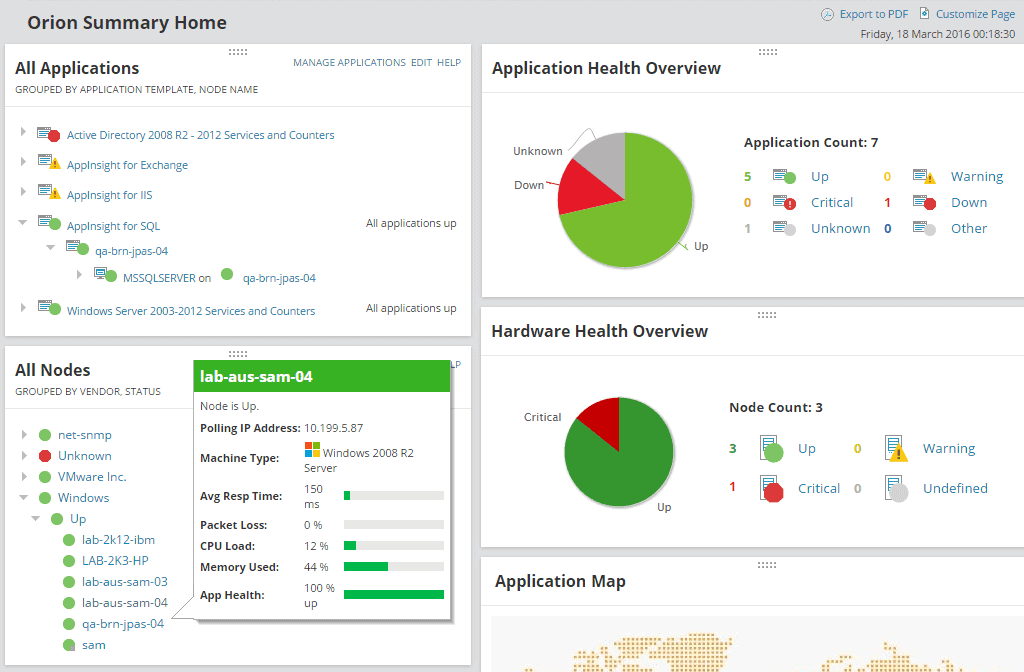
- ITRS OP5 Monitor An infrastructure monitor that will track the performance of resources on-premises and in the cloud. Installs on Linux, AWS, and Azure and can be run on Windows Server through a hypervisor.
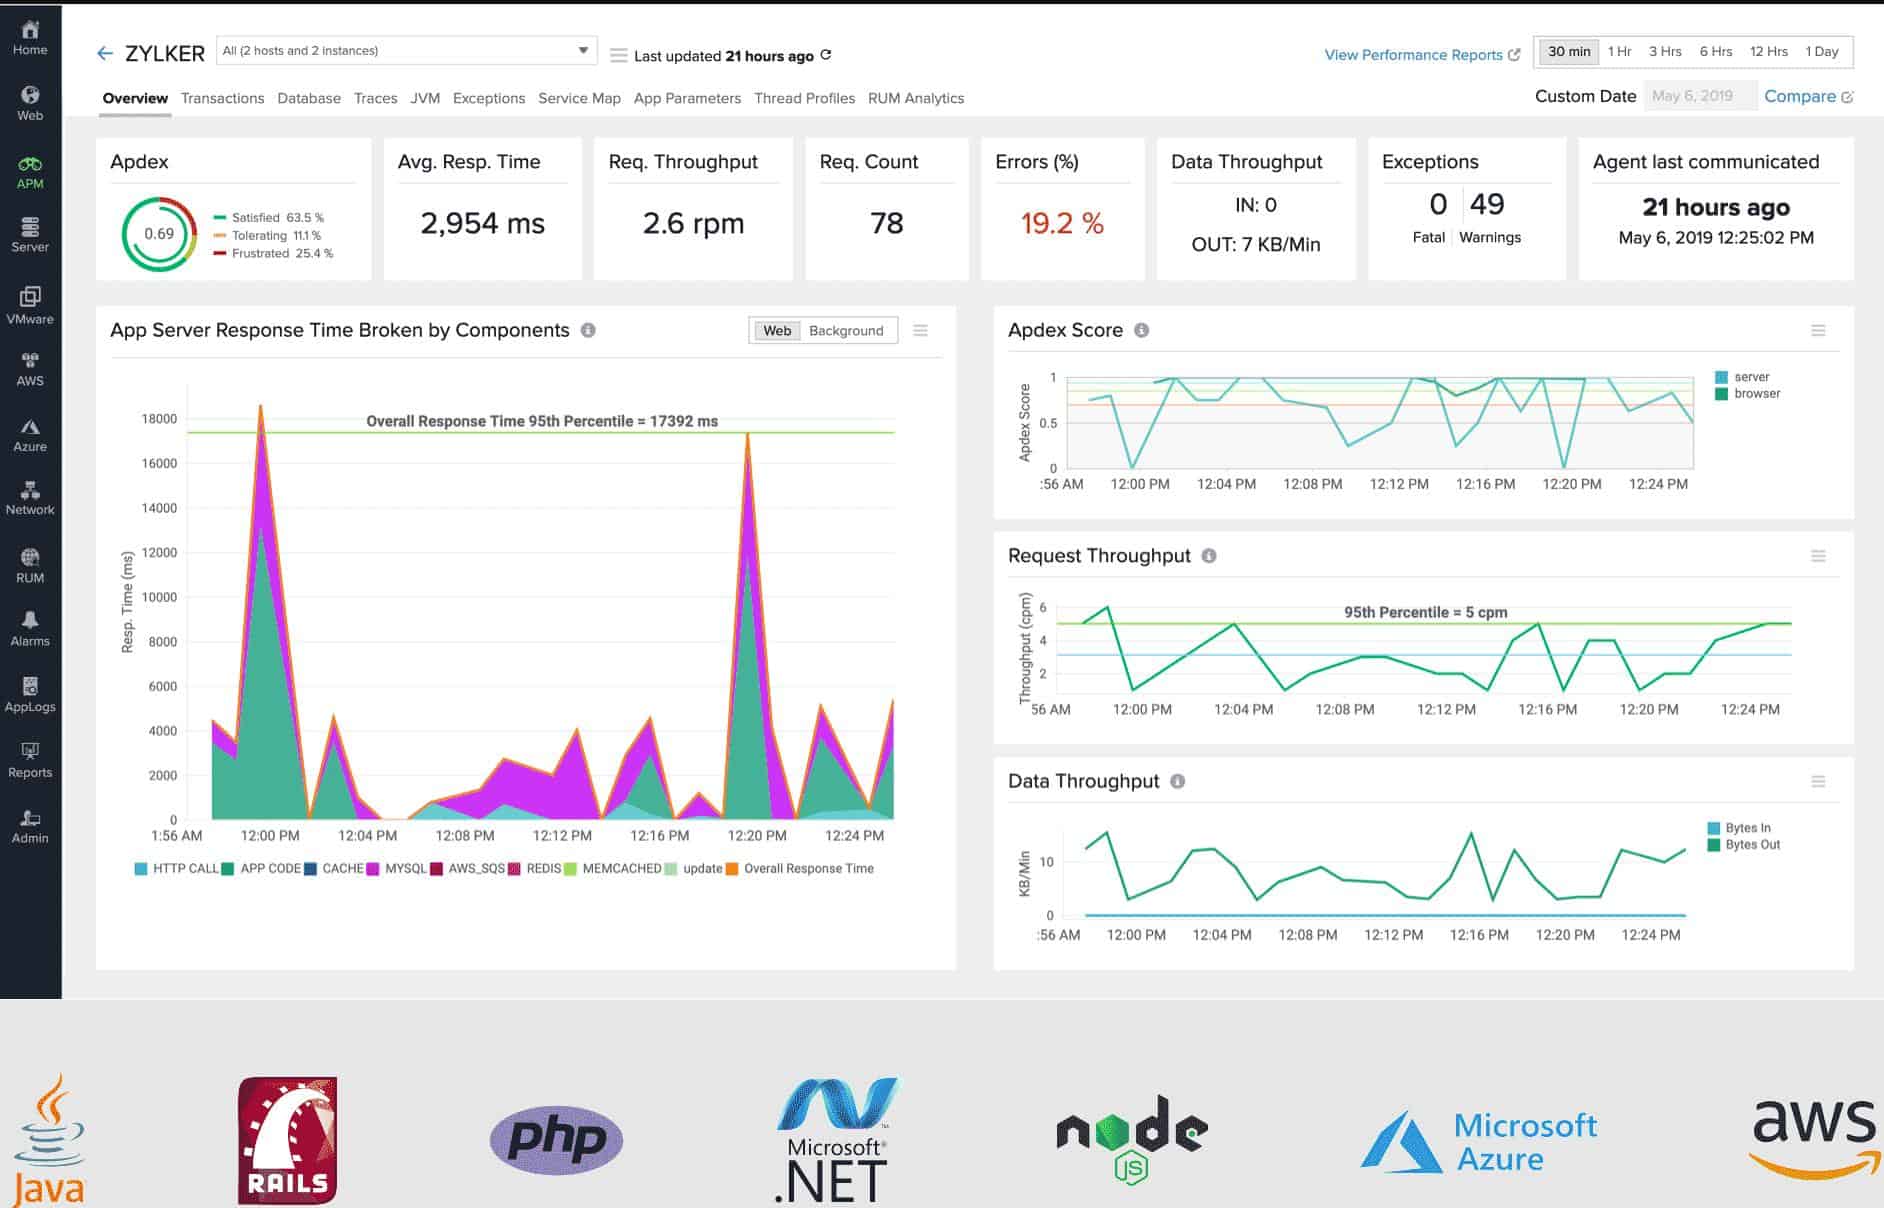
- Zabbix A free system monitoring service with great status visualizations. This tool monitors networks, servers, and applications and it installs on Linux, macOS, or Unix.
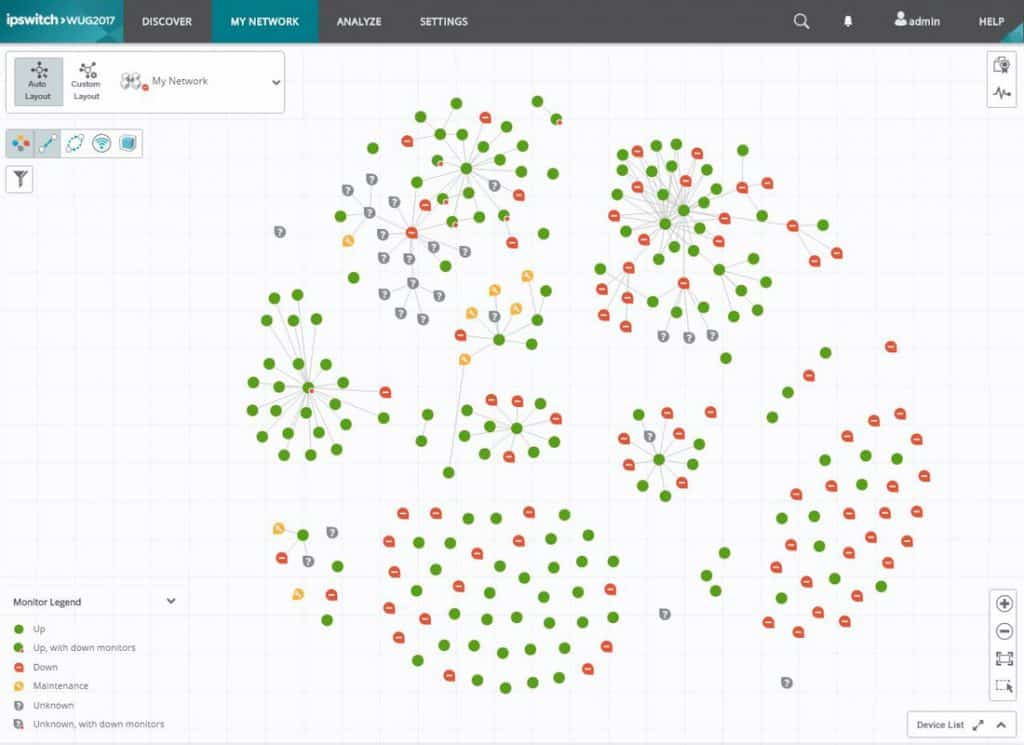
- Progress WhatsUp Gold A network monitoring system that can be extended by paid add-ons to monitor servers and applications as well. Runs on Windows Server.
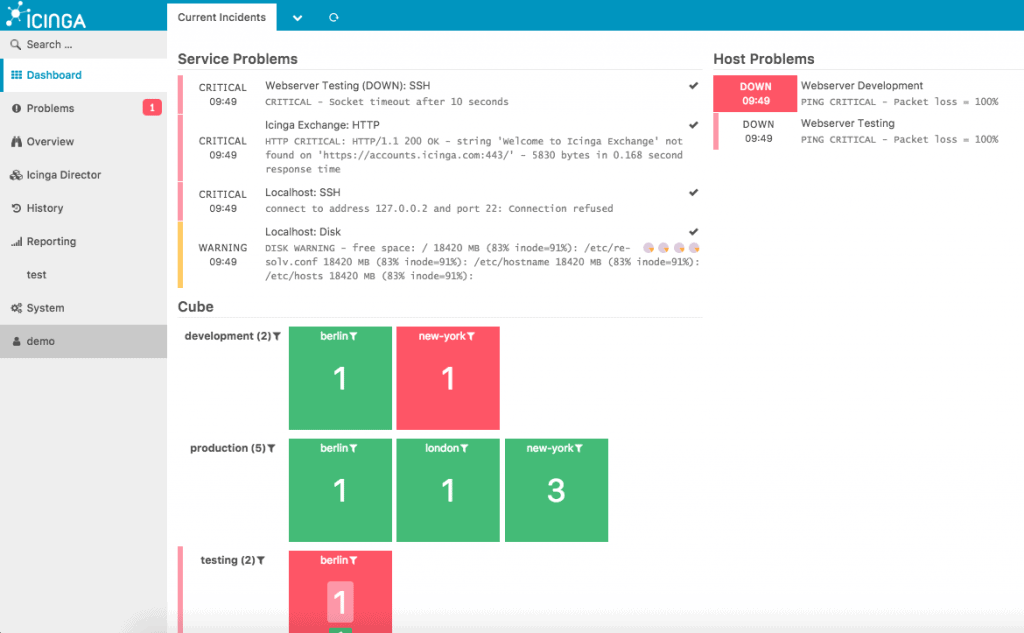
- Icinga 2 This system monitoring software monitors networks, servers, and applications and is developed from a fork of Nagios Core. Runs on Linux.
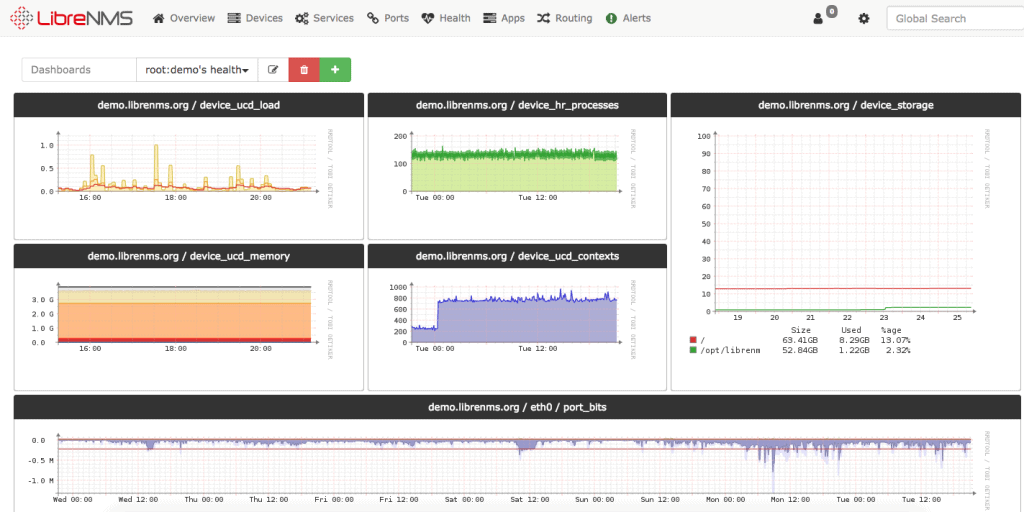
- LibreNMS Α free open-source network monitoring tool and a fork of Observium.
Related Post: Best System Monitoring Tools For Windows
The best IT Infrastructure Monitors
Our methodology for selecting infrastructure monitoring tools and software
We reviewed the infrastructure monitoring market and analyzed the options based on the following criteria:
- An autodiscovery system to log all network devices
- A network topology mapper
- Multiple techniques for asset discovery
- A facility to analyze network performance over time
- Graphical interpretation of data, such as charts and graphs
- A free trial period, a demo, or a money-back guarantee for no-risk assessment
- A good price that reflects value for money when compared to the functions offered
With these selection criteria in mind, we have identified IT infrastructure monitoring packages that are worthy of your consideration. We have included cloud-based services as well as software packages that can install on Windows and Linux.
1. SolarWinds Network Performance Monitor (NPM) – FREE TRIAL
SolarWinds is a company that provides a lot of tools for different things. Relevant to this article is the Orion suite of tools available from SolarWinds. This suite includes tools for performance monitoring, configuration management, server and application monitoring, and so on. While this makes their solution robust, it can be quite confusing to know which tools to use and which modules you will need to install to use a particular feature. This also means that the total cost of a complete solution can quickly add up.
SolarWinds Orion is Windows-based even though it can monitor a whole lot of devices. Configuration is also done from a full-fledged Orion web interface that can provide a wealth of information about the devices being monitored (depending on the specific tools installed). Alerting and Reporting are also available in the Orion suite.
We will consider two tools from the SolarWinds Orion suite: SolarWinds Network Performance Monitor (NPM) and SolarWinds Server and Application Monitor (SAM)
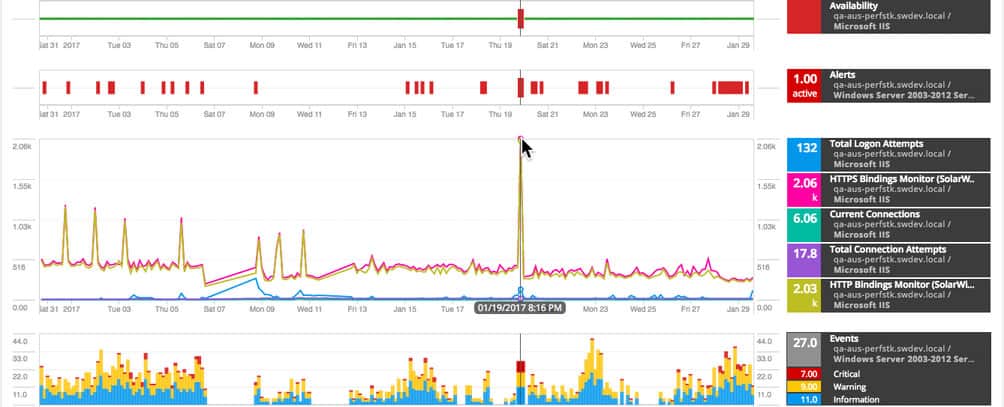
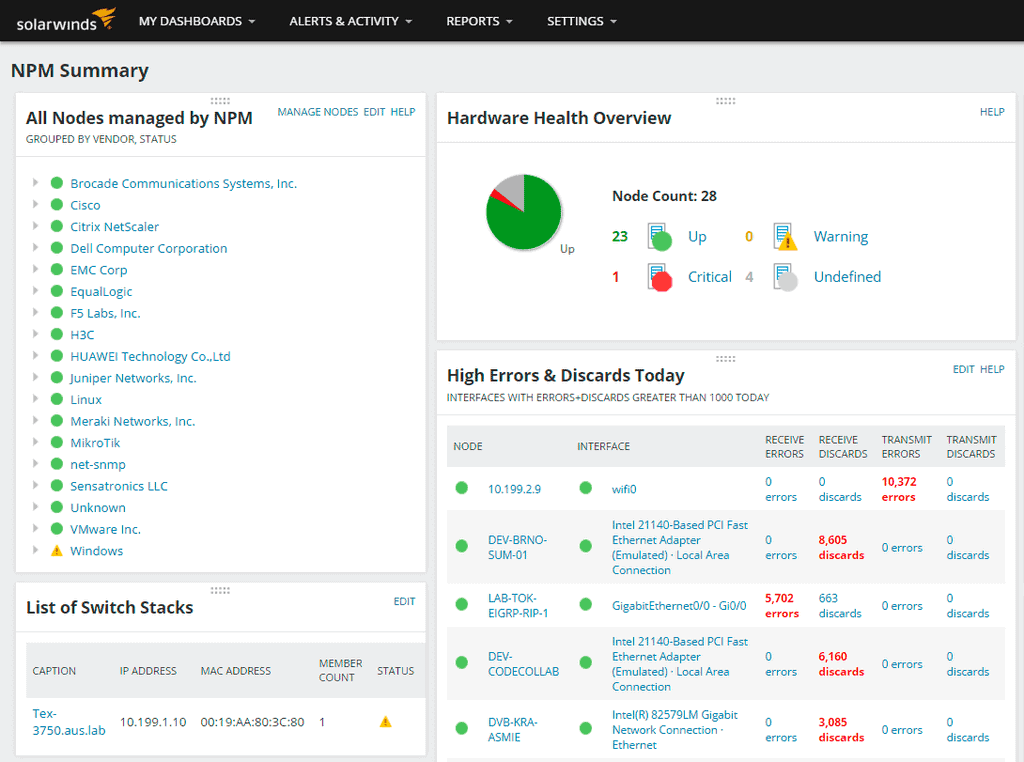
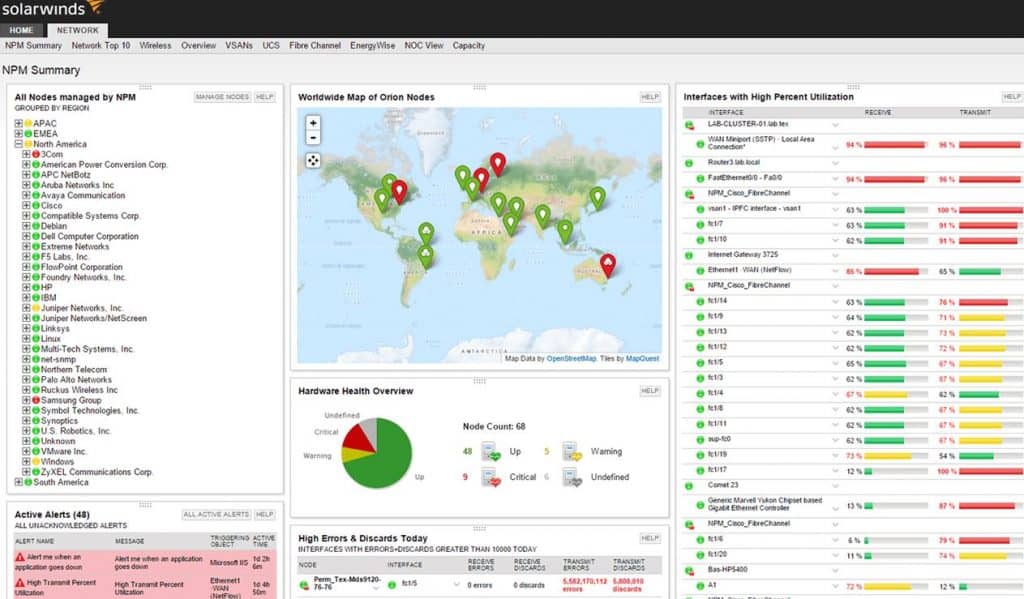
When you think of general infrastructure monitoring, SolarWinds NPM is the tool that fulfills that role in the SolarWinds Orion suite of tools. It provides information such as availability, health status (temperature, power supply, etc.), and performance indicators (e.g. interface utilization). It can report this information on a variety of devices including Cisco, HP, and F5.
Pros:
- Supports auto-discovery that builds network topology maps and inventory lists in real-time based on devices that enter the network
- Has some of the best alerting features that balance effectiveness with ease of use
- Supports both SNMP monitoring as well as packet analysis, giving you more control over monitoring than similar tools
- Uses drag and drop widgets to customize the look and feel of the dashboard
- Tons of preconfigured templates, reports, and dashboard views
Cons:
- This is a feature-rich enterprise tool designed for sysadmin, non-technical users may some features overwhelming
EDITOR'S CHOICE
SolarWinds Network Performance Monitor is our top pick for an IT infrastructure monitoring tool because it covers all of the hardware that connects devices together and enables the transmission of data. If the network has problems, your entire IT system is in trouble, so the work of the Network Performance Monitor keeps all of your IT infrastructure operating successfully.
Download: Start 30-day Free Trial
Official Site: solarwinds.com/network-performance-monitor
OS: Windows Server
2. Datadog Infrastructure – FREE TRIAL
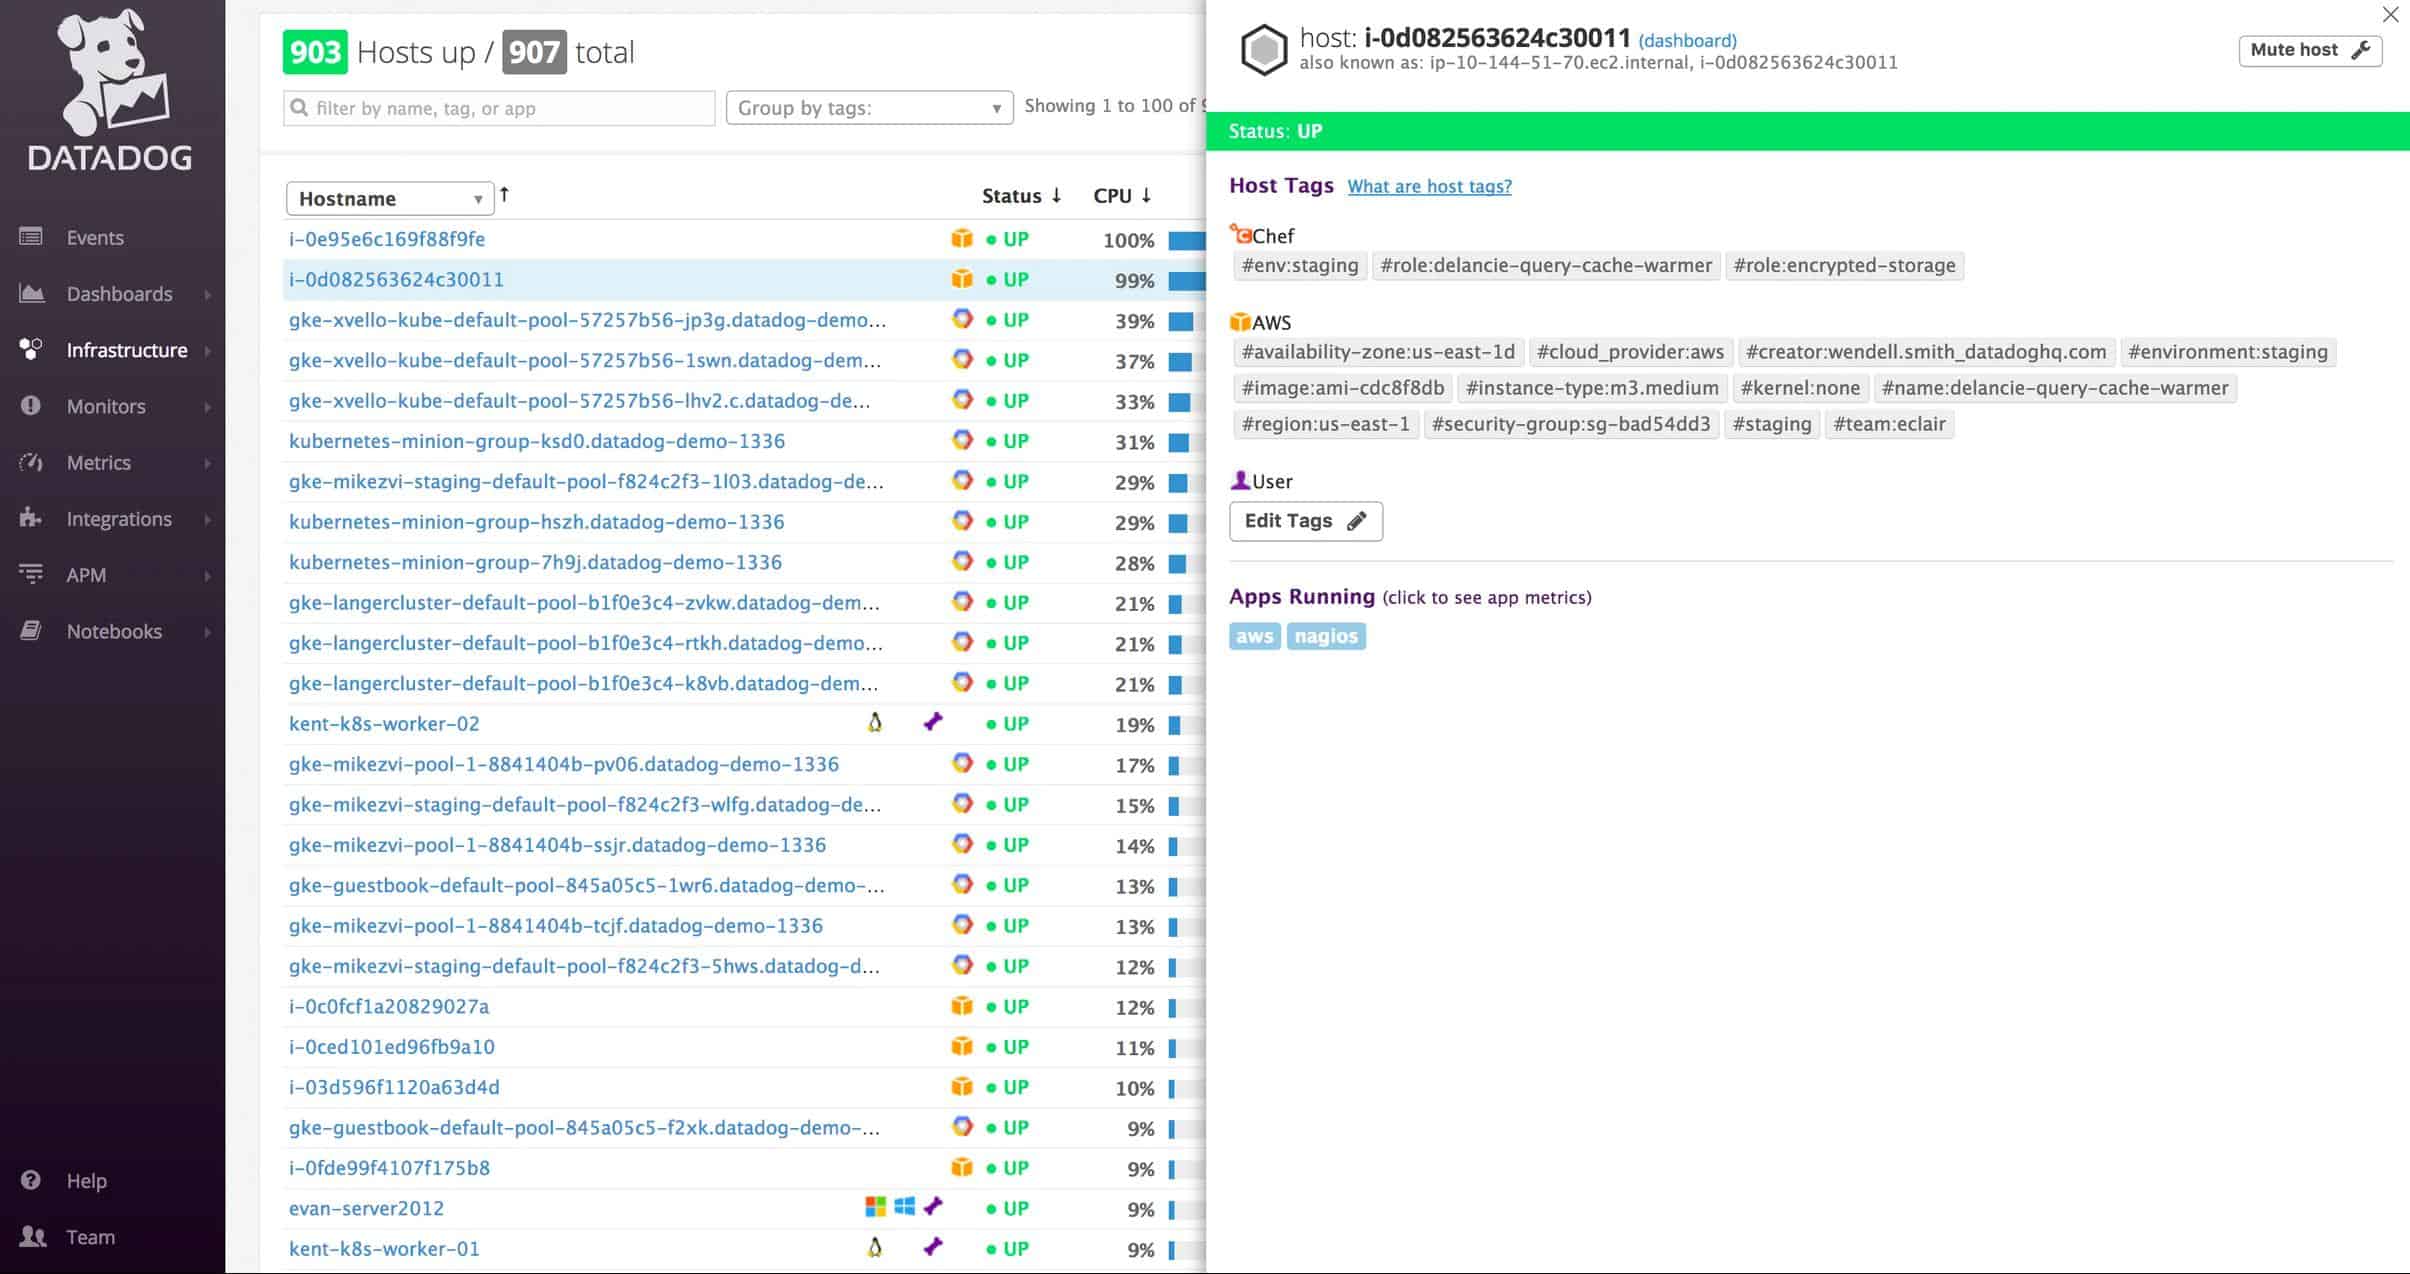
Datadog Infrastructure is a cloud-based monitoring system and forms part of a wider systems monitoring platform. This tool can be used as a standalone monitor or in combination with other Datadog tools, such as an application performance monitor and network monitors.
This service monitors all of the systems that operate between user-accessible software and the network, so it monitors applications, such as databases, services, such as containers, and server resources utilization and performance.
Key features of Datadog Infrastructure include:
- Monitoring of on-premises and cloud-based servers
- More than 450 vendor-specific monitoring integrations
- Metrics, data sampling, and log collection
- Utilization visualization across all servers
- Capacity planning features
- App stack root cause analysis
- Performance deterioration alerts
- Diagnostic and forecasting tools
As it is a cloud-based service, the dashboard for Datadog Infrastructure can be accessed through any standard browser from anywhere.
Pros:
- A great choice for small, medium, and enterprise size networks
- Highly scalable cloud-based monitoring that can applications across multiple WANs
- Flexible à la carte pricing and feature options
- Vast amount of integrations, great for large networks utilizing numerous third-party applications
- Templates work extremely well out of the box, customization is possible but not always necessary
Cons:
- Could benefit from having a longer 30-day trial period
The Datadog Infrastructure package is offered in three editions. The lowest of these is Free. That plan covers up to five hosts and has only one day’s worth of data retention. The Free plan relies on community support and it doesn’t include any of the service’s vendor-specific integrations. The two paid plans are Pro and Enterprise. Pro costs $15 per month per host and Enterprise is priced at $23 per host per month. You can get a 14-day free trial on either of these two editions.
Official Website: https://www.datadoghq.com/dg/enterprise/it-infrastructure-monitoring/
Trial/Pricing Download: https://www.datadoghq.com/pricing/?product=infrastructure#infrastructure
3. Checkmk – FREE TRIAL
Checkmk is a large package of network, server, and application monitoring services. This system was developed from the open source code of Nagios Core, the free version of Nagios XI. Checkmk has an advantage over Nagios for network monitoring because this system includes network traffic monitoring as well as network device monitoring – Nagios has split out its network traffic analysis feature into a separate package.
There is a free edition of Checkmk, which is called Checkmk Raw. Paying users have the option of the on-premises edition, which is called Checkmk Enterprise, or a SaaS package, called Checkmk Cloud.
The important features of Checkmk include:
- Full stack monitoring
- Automated hardware discovery and inventory management
- Network device status tracking and traffic analysis
- Performance thresholds and alerts
- Network topology mapping
- Protocol analysis
- Switch port monitoring
Pros:
- On-premises for Linux, as an appliance, or a cloud platform
- Pre-set performance expectation thresholds
- Live performance graphs for networks, servers, and applications
- Root cause analysis
- Monitors wireless networks as well as LANs
Cons:
- The console has a lot of screens
The Checkmk Raw edition is free to use and the cheapest plan for Checkmk Enterprise, the on-premises option is $80 per month, high will monitor 100 devices. The SaaS version is called Checkmk Cloud and its price is not published. You can get Checkmk Enterprise on a 30-day free trial.
Official Website: https://checkmk.com/l/c/top-network-monitoring
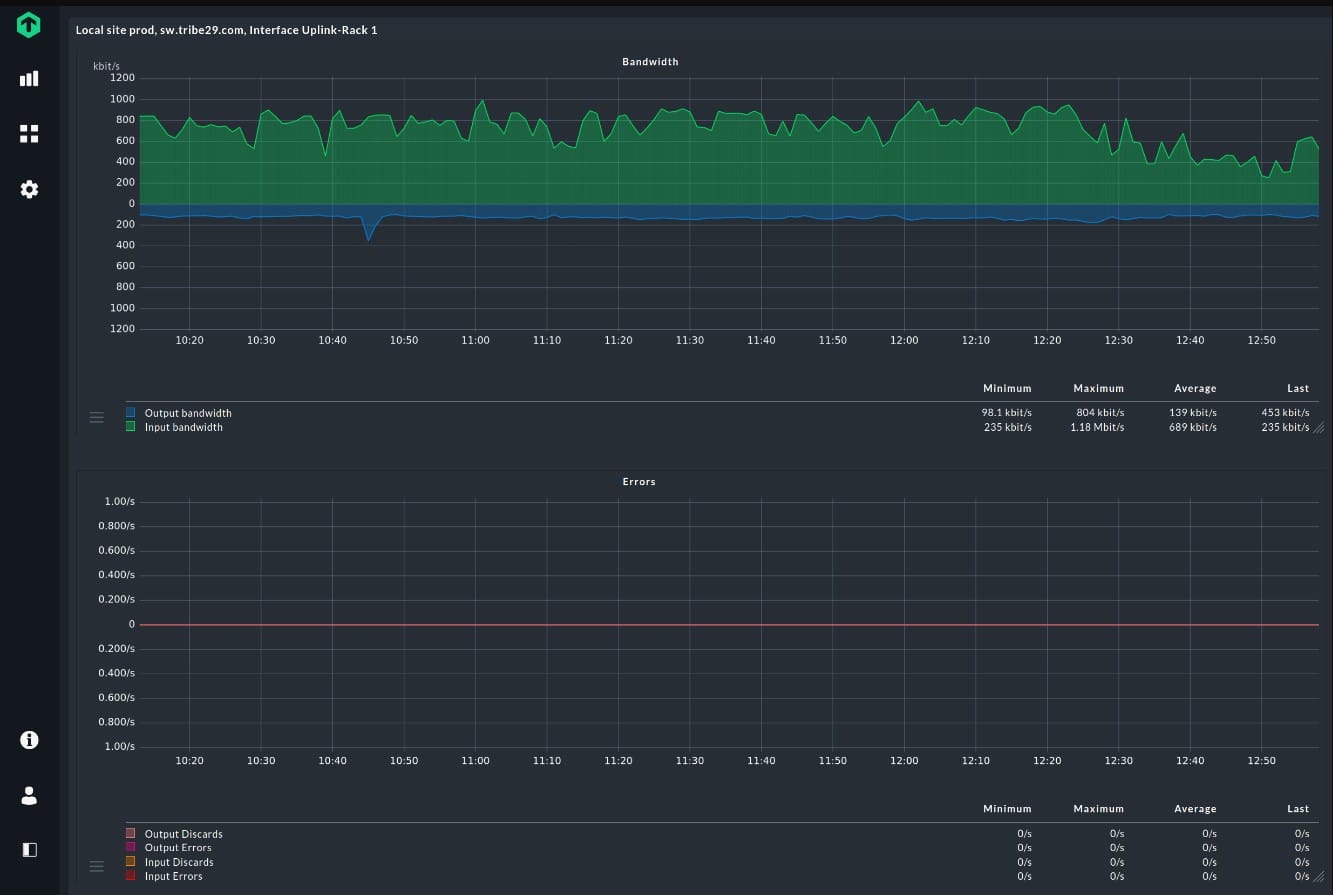
4. PRTG Network Monitor – FREE TRIAL
This is probably one of the best monitoring tools available on the market when you consider how simple it is to setup and how easy it is to use.
PRTG covers the whole monitoring spectrum in an all-in-one solution including:
- Network monitoring
- Bandwidth monitoring
- Server and application monitoring
- Monitoring of virtual machines
- Alerting (SMS, Email, Push notifications through mobile apps, etc.)
- Robust Reporting
- Intuitive web interface
Even though PRTG provides an agent that can be installed on the devices to be monitored, it mostly relies on agentless monitoring by using a variety of protocols including SNMP, WMI, SSH, NetFlow, and so on. PRTG can only be installed on Windows OS but can then be used to monitor several types of devices including Linux, Windows, Cisco, HP, VMware, and so on.
Pros:
- Uses flexible sensors to monitor different aspects of your webpage and webserver resources
- You can use 100 sensors for free
- Great option for businesses looking to deploy different types of monitoring across their infrastructure and network
- Pricing is based per sensor and allows both large and small businesses to scale within the PRTG ecosystem
Cons:
- Feature-rich, and takes time to learn all of the features and functionality the platform offers
PRTG is Absolutely Free for up to 100 sensors. If you to monitor more than 100 sensors, PRTG offers a 30-day unlimited trial and after that, the price starts at $1,600 for a 500-sensor license. For more information about the pricing, see the price list on their site.
Note: PRTG works with “sensors”. A device is not a sensor because you can enable multiple sensors on a single device. Even with this, PRTG is generally less expensive than other paid monitoring solutions.
Official Website: https://www.paessler.com/prtg
PRTG 100 Sensors FREE (no Time limitation, etc): https://www.paessler.com/download/
5. ManageEngine OpManager Plus – FREE TRIAL
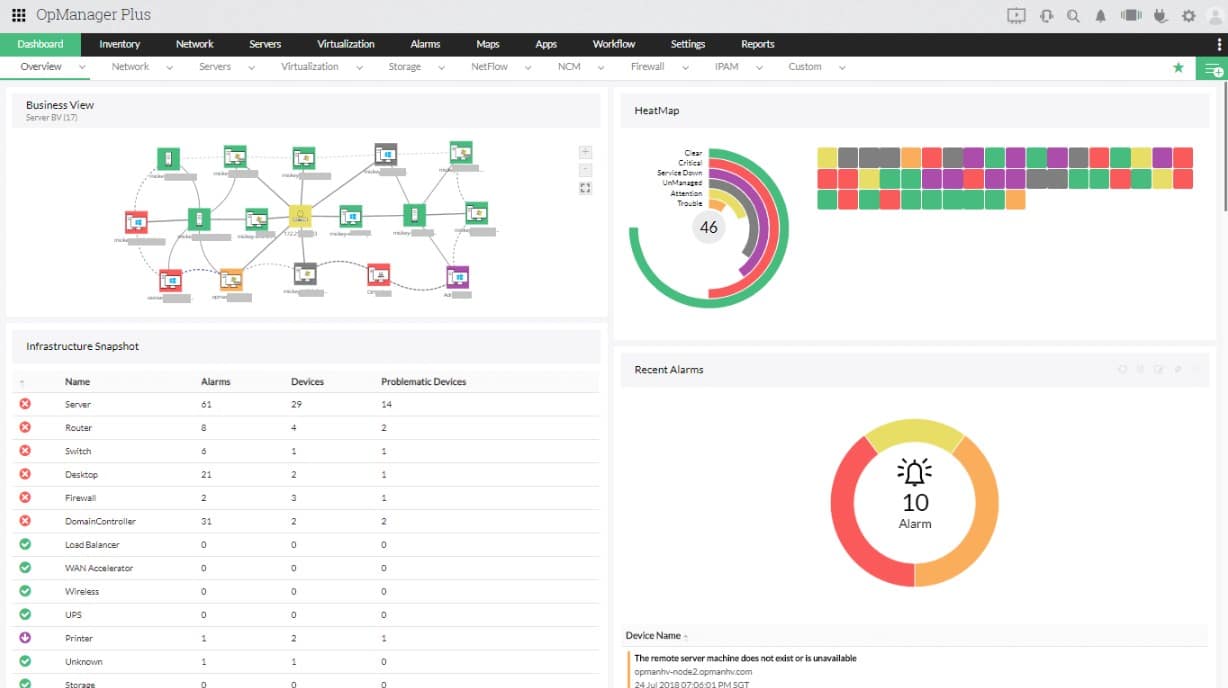
ManageEngine OpManager Plus is a comprehensive IT infrastructure monitoring solution with an easy-to-use responsive web interface. It can be installed on either Windows or Linux OS and offers several features like:
- Server Monitoring
- Network Mapping
- Monitoring templates
- Alerting (SMS, Email)
- Reporting
- Network Configuration Management
- Network Traffic Analysis
While most of these features come included in the base installation (or as a free add-on), some of them require you to purchase a separate license. For example, the Network Configuration Management module is free for up to two (2) devices after which it requires a separate license. The Network Traffic Analysis module also requires a license after two (2) free interfaces.
Pros:
- Utilizes autodiscovery to detect new devices for performance monitoring and inventory management
- Leverages both ping and SNMP protocol to detect uptime and performance issues
- Build an automatic network topology map based on devices it probes, good for detecting new devices and rogue access points
- Has log collection capabilities, allowing it to provide much more detailed information than other simple ping monitors
Cons:
- OpManager is a tool designed for IT professionals, it is not designed for non-technical users
ManageEngine OpManager Plus has three license types (apart from a free 30-day trial): Essential, OpManager Plus and Enterprise. The Essential license starts at $595 for 25 devices.
Note: There is also a free edition for monitoring 10 devices but with limited functionality. You can access a 30-day free trial.
Official Site and Download: https://www.manageengine.com/it-operations-management/download.html
6. Site24x7 Infrastructure – FREE TRIAL
Site24x7 is a cloud-based monitoring platform that offers a range of monitoring tools by subscription. The Infrastructure module covers networks, servers, and applications. Services such as virtualizations and containers are also monitored by this tool.
The Infrastructure system is hosted in the cloud. However, it needs an agent program to be installed on a server that is part of the monitored system. That could be an on-premises server tuning Windows server or Linux or it could be a Cloud service provided by AWS, Azure, or Google Cloud Platform.
The agent program collects all statistics about the operations of the infrastructure and uploads those to the Site24x7 server in the cloud for processing. Users access the system console through any standard browser and there they can switch through screens for network information, servers, and application activity to get live information on infrastructure performance.
The network monitoring segment of this tool is able to discover all devices connected to the network and document them in an inventory. It will also draw up a network topology map. Both the inventory and map get automatically updated whenever there are changes to the network infrastructure. The network monitor uses SNMP to check the statuses of network devices. The tool also implements traffic analysis, logging traffic volumes on each link and comparing it to the capacity of the hardware.
The server monitor watches over running processes and measures disk, memory, and processor usage. Marking the total capacity of each resource, the monitor sets usage thresholds, warning operators if operations get close to the full capacity of the server. The network monitor also uses an asserting system for both device performance and for traffic volumes.
Pros:
- Tests from over 90 different locations, great for larger sites with global audiences
- Uses real-time data to discover devices and build charts, network maps, and inventory reports
- Can alert users to domain expiration as well as expired SSL certificates
- User monitoring can help bridge the gap between technical issues, user behavior, and business metrics
- Completely free for users monitoring under five locations
Cons:
- Is a very detailed platform that will require time to fully learn all of its features and options
The base plan for Site24x7 Infrastructure costs $9 per month if paid annually. You can get a 30-day free trial of the service.
Official Website: https://www.site24x7.com/
7. SolarWinds Server & Application Monitor (SAM) – FREE TRIAL
SolarWinds SAM provides deep insight into servers (e.g. IBM and Dell servers) and applications (e.g. Microsoft Exchange, IIS and Java). The tool comes with monitoring templates to help you get setup quickly. The templates can also be customized to monitor custom applications.
Pros:
- Designed with large and enterprise networks in mind
- Supports auto-discovery that builds network topology maps and inventory lists in real-time based on devices that enter the network
- Has some of the best alerting features that balance effectiveness with ease of use
- Supports both SNMP monitoring as well as packet analysis, giving you more control over monitoring than similar tools
- Uses drag and drop widgets to customize the look and feel of the dashboard
- Robust reporting system with pre-configured compliance templates
Cons:
- Designed for IT professionals, not the best option for non-technical users
SolarWinds SAM is also available for a free 30-day free trial, after which, licenses start at $2,995 for 150 monitors.
Official website: http://www.solarwinds.com/server-application-monitor
Download 30 Day Trial FREE: http://www.solarwinds.com/server-application-monitor/registration
8. Nagios XI

Nagios is probably the most popular network monitoring tool partly because it is also the oldest (among monitoring tools still in use today). It is a Linux-based solution that is very flexible and powerful because the core can be extended with plugins of which they are a lot.
Nagios comes in two flavors: Nagios Core which is free and open-source and Nagios XI, which is the paid enterprise edition. Out of the box, Nagios Core is not great – poor reporting, text-based configuration, no support for graphs. However, Nagios XI builds on this powerful Nagios Core and then goes a step ahead by simplifying and making available (by default) many of the things lacking in Nagios Core. Some of the features available on Nagios XI include:
- A much better web interface (the default web interface on Nagios Core is quite bad)
- Auto-Discovery
- Graphs
- Alerting (SMS, Email)
- Reporting
- Configuration wizards
While many of these features are available in Nagios Core with the use of plugins, they are available by default in Nagios XI which means the complexity of deployment is reduced.
Pros:
- Plugins keep the base installation light, while still offering option features for those who want it
- Uses autodiscover to help save time and eliminate the need for manually hunting devices down
- Can monitor both internally as well as externally
- Generous 60-day trial
Cons:
- Requires virtualization to run in a Windows operating system
- Pricing for the enterprise version is high when compared to leading products
- Reporting features could be made easier to use
Nagios XI is available in two editions: Standard Edition and Enterprise edition. Licenses for each edition come in three (3) levels: 100 Node, 200 Node, or Unlimited Node. The least expensive of Nagios XI (Standard 100 Node editions) costs $1,995. You can view the price list here.
There is also an online demo of Nagios XI to try before purchasing.
Related Post: Best Network Monitoring Tools
9. OP5 Monitor
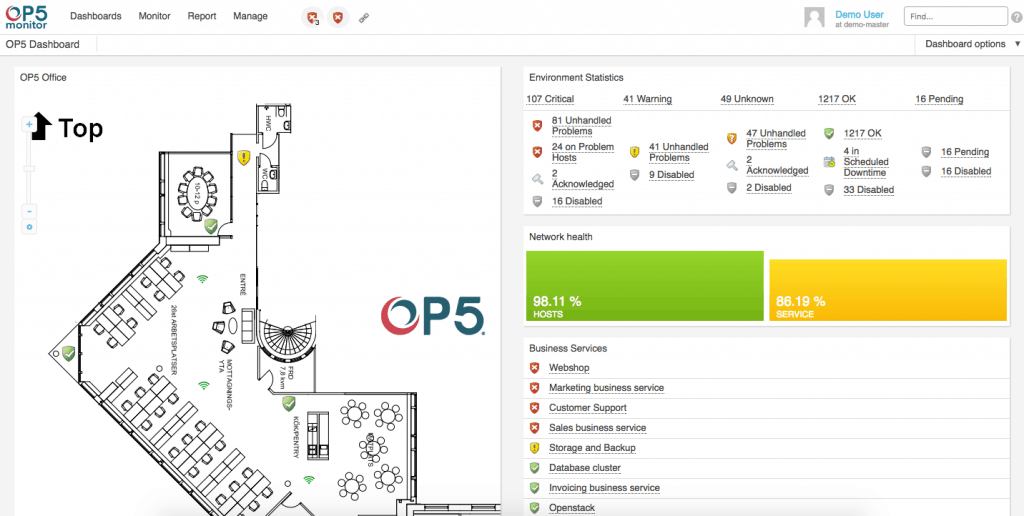
OP5 Monitor is a network monitoring tool based on a fork of Nagios (Naemon). It packs a couple of nice features including:
- Customizable/Personalized dashboards
- Performance Monitoring
- Alerting
- Reporting
- Web-based configuration (unlike the default Nagios Core)
Pros:
- Focuses primarily on offering their services to large enterprises
- All features and interfaces are designed to scale and handle large amounts of data well
- Simple widget customizations can be added or removed
- Offers geolocation mapping, and dependency mapping to help visualize complicated network services
Cons:
- Must contact sales for accurate pricing information
- The interface could be made more user friendly with fewer menu options
OP5 Monitor is also built to scale – they have a license (Ent+) that can monitor over 100,000 devices! Other licenses available for OP5 Monitor include the free license which allows you to monitor up to 20 devices and the Pro license which allows you to monitor up to 500 devices.
There is also an online demo available to try out the product before buying/downloading.
10. Zabbix
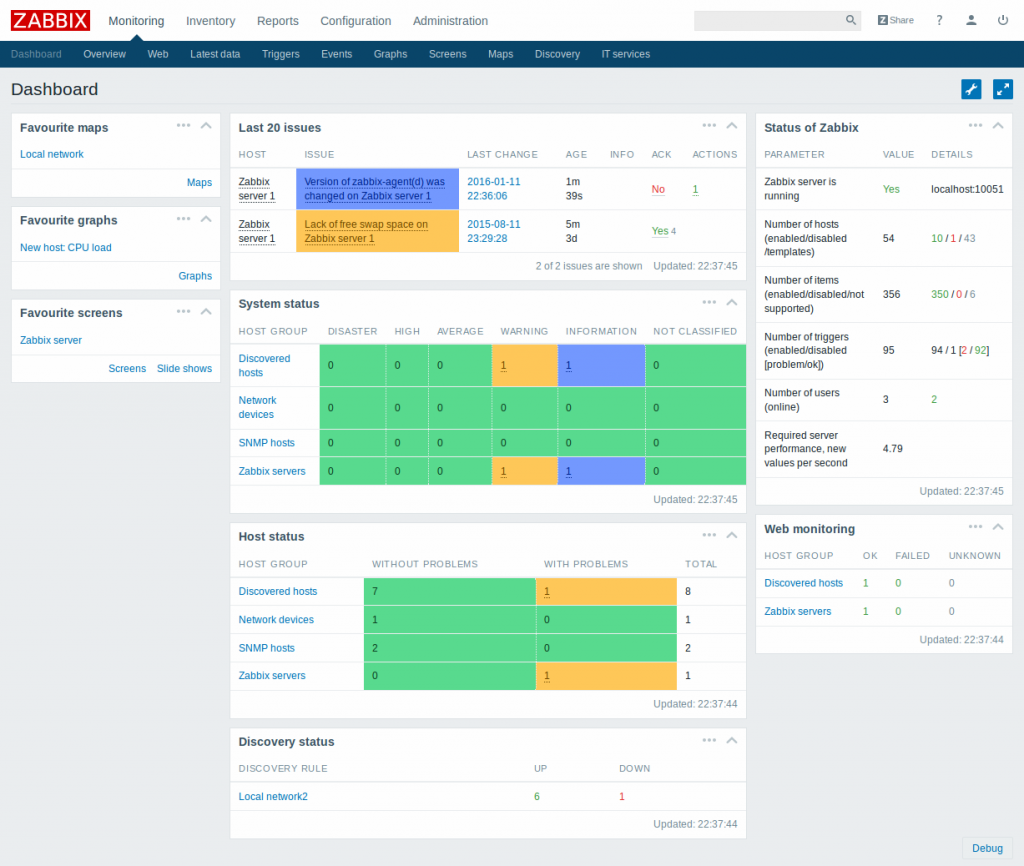
Zabbix is a free open source all-in-one network monitoring solution. It uses a client-server model where the Zabbix server gets monitoring information from the Zabbix agent (although agentless monitoring is also supported). Some of the features provided by Zabbix are:
- Web-based configuration
- Performance Monitoring
- Application Monitoring
- Monitoring templates for quick and easy setup
- Auto-Discovery
- Alerting
- Reporting
Pros:
- Open-source transparent tool
- Uses both SNMP and IPMP for a broader monitoring range
- Can detect new devices and configuration changes immediately
- Offers useful templates for quick insights
- Robust notification system supports SMS, email, custom script, and webhook
Cons:
- Could use updated and modernized
- Would like to see better alerts, specifically more intelligent alerting to reduce false positives
Zabbix is completely free – it does not have a paid enterprise edition. However, the company behind Zabbix offers paid support services including 5 tiers of technical support, integration service and consulting services.
11. Progress WhatsUp Gold
WhatsUp Gold, from Progress Software Corporation, is a network monitoring tool that is able to track all devices connected to a network.
The core service of WhatsUp Gold focuses on network device statuses. This system can be enhanced with additional modules that monitor applications, network traffic, and hypervisors to provide a complete infrastructure monitoring system. There is also a configuration management add-on.
The network performance monitoring service of WhatsUp Gold is called WhatsUp Gold Premium. Its features include:
- Network device discovery
- Automated topology mapping
- Live network statuses
- Drill-down network activity views
- Acceptable performance thresholds
- Status alerts
The higher edition of WhatsUp Gold is called WhatsUp Gold Total Plus. This has all of the add-on modules bundled into it. Buyers who don’t want the full package should buy the Premium edition and just add on those extra modules that they need.
Pros:
- Uses simple visualizations to help provide at-a-glance insights
- Supports modular pricing, allowing companies to pay only for features they intend to use
- Can monitor LANs, WANs, and cloud-based applications such as container environments
Cons:
- Modular upgrades might not be a good fit if you intend on utilizing all aspects of a networking monitor
The price you pay for WhatsUp Gold depends on how many devices and applications you have in your system, so there is no advertised fixed price. WhatsUp Gold installs on Windows Server and it is available for a 14-day free trial. Compare different editions on their official website and ask for a price quote.
Official Website: https://www.whatsupgold.com/
12. Icinga 2
Icinga is an open-source network monitoring tool that comes in two versions: Icinga 1 and Icinga 2. Icinga provides many features including:
- Performance Monitoring
- Alerting
- Reporting
- Graphing
- Extensibility through plugins
Icinga 1 is a fork of Nagios Core with added functionality like support for more databases, a better web interface, and easier plugin integration. Even though it is a fork, Icinga 1 is still compatible with Nagios plugins.
Icinga 2 is a complete rewrite of the Core and features a web interface that is smooth and responsive. Configuration is still done through text files but Icinga 2 reduces configuration complexity. Icinga 2 was designed to be scalable; therefore, it supports distributed monitoring.
Pros:
- Transparent open-source tool
- Can be configured via GUI or DSL, making it a good choice for admins who enjoy CLI tools
- Supports built-in visual reporting
- Modules allow for different functionality, keeping the base installation sleek and lightweight
- Can run on Linux as well as Windows operating systems
Cons:
- Reliant upon the open-source community for support and updates
- Designed for more technical users, other options have better out-of-box features
Icinga is free and does not have any paid editions. However, like Zabbix, paid support services are available. A live demo is provided here.
13. LibreNMS
LibreNMS is a free open-source network monitoring tool and a fork of Observium. It provides features such as:
- Great graphs
- Configuration can be done through a web interface or command-line interface.
- Auto network discovery
- Alerting (SMS, Email, Slack, etc.)
LibreNMS is completely free and does not even have any option for paid support. Support is available through several channels like community forums, IRC, GitHub, and Twitter. You can try LibreNMS by using the online demo.
Conclusion
In this article, we have discussed the need for monitoring IT infrastructure and went on to highlight some of the tools that can be used for this purpose including Progress WhatsUp Gold, LibreNMS, SolarWinds NPM, and Nagios XI.
As a final note, it is important to consider your own requirements before choosing a tool as there is no one-size-fits-all. If you are looking for simplicity, ease of use, and an inexpensive solution, then consider PRTG Network Monitor.
If you want a robust solution with a nice web interface, many modules and are not too concerned about cost, look at the SolarWinds Orion suite. All of these tools will help keep your data center, business, and network thriving by keeping tabs on every aspect and device you wish. Our recommendation would be to grab a Free download/Trial and see for yourself.
Our top picks?
Definitely SolarWinds Orion Suite (NPM and SAM) and PRTG Network Monitor. They have been around for decades now and are top of their classes in terms of features, updates, and support.
Best IT Infrastructure Monitoring Tools & Software FAQs
What should you look for in IT infrastructure monitoring tools?
We reviewed the market for IT infrastructure monitoring software and analyzed the options based on the following criteria:
- A system that can trace all services from the server’s resources up to applications
- An application dependency mapping service
- Nice to have a distributed tracing system for monitoring API actions
- Alerts for arising performance issues
- Integrations for specialist vendor service monitoring
- A free trial or a demo system for a risk-free assessment exercise
- Good value for money, represented by a fair price with the respect to the quality of services offered
What are some common metrics used in infrastructure monitoring?
Some common metrics used in infrastructure monitoring include resource utilization (e.g. CPU, memory, disk), network performance (e.g. latency, packet loss), and system availability (e.g. uptime).
How does infrastructure monitoring differ from application monitoring?
Infrastructure monitoring focuses on the underlying components of a network or IT infrastructure, while application monitoring focuses on the performance and availability of individual applications.
What are some popular tools for infrastructure monitoring?
Some popular tools for infrastructure monitoring include Nagios, Zabbix, Datadog, and SolarWinds.
What are some best practices for infrastructure monitoring?
Some best practices for infrastructure monitoring include defining clear policies and procedures, performing regular testing and maintenance, integrating with other enterprise systems, and providing proper training and support to end-users.
How does infrastructure monitoring fit into the overall DevOps process?
Infrastructure monitoring is a critical component of the DevOps process, as it helps ensure the availability and performance of the systems and applications that support the development and deployment of software. By providing real-time visibility into the infrastructure, infrastructure monitoring can help identify and resolve issues before they become major problems, improving the overall speed and reliability of the DevOps process.
Notice: All images used in this article are copyright of the respective tools.

