
Our funding comes from our readers, and we may earn a commission if you make a purchase through the links on our website.
VictorOps Review and Alternatives
UPDATED: February 27, 2024
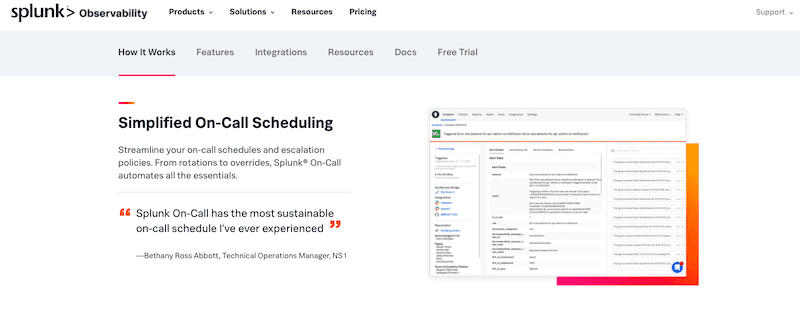
VictorOps (now Splunk On-Call) is an incident management and IT alerting platform for DevOps and IT Ops teams. With Splunk On-Call, these teams can provide better and faster proactive support. As a result, they can improve cross-functional resolution collaboration, resolve incidents more efficiently and reduce time-to-acknowledge times. In addition, these teams can also benefit from VictorOps from its rich contextual notifications and greater visibility to critical incidents.
If you don't want to take risks and manage your incident smartly, then we have listed the top-notch alternatives of victorOps that can be a valuable addition to your organization.
- Datadog (EDITOR'S CHOICE): it makes monitoring and managing your technology easier with ready-to-use connections. It effortlessly collects and organizes data from the entire development and operations (DevOps) toolkit and simplifies tracking metrics and events.
- PagerDuty: PagerDuty has amazing features like live call routing and automated escalation policies for easy on-call management; hence, you can optimize your team's response to incidents.
- Opsgenie: opsgenie is a reliable choice for streamlined on-call management, providing a smooth and effective scheduling experience for both small and large teams alike.
- xMatters: It offers faster delivery by minimizing interruptions and bottlenecks. This platform offers robust capabilities for DevOps and SRE (Site Reliability Engineering).
- Freshservice: It helps you stay organized and responsive with automated alert grouping, on-call management, and intelligent alert management to maintain optimal performance across all aspects of your operations.
- New Relic One: It provides clear visual insights into metrics like total incidents and correlated issues to understand common issues.
- Moogsoft : it uses AI and ML technologies to analyze patterns and proactively prevent their recurrence, ensuring a more resilient and efficient system.
- BigPanda: You can achieve end-to-end visibility and reduce incidents to have a smooth migration process with minimal impact and enhanced reliability.
What is VictorOps?
VictorOps (now Splunk On-Call) is a real-time incident management response platform designed for DevOps and IT Ops teams. The platform collects the critical IT and DevOps systems data from monitoring systems to provide efficient incident response management through centralized information, automated alerts, and robust documentation.
VictorOps handles the entire incident lifecycle, from identification, logging, categorization, prioritization, diagnosis, escalation, response resolution, and closure. In addition, it also introduces vital features like context-rich alerts, intelligent routing, and on-call management to deal with the people. Finally, the reporting and documentation provide the necessary actionable insights to solve the problem and knowledge feedback for future incidents.
- Deployment Cloud-app, SaaS, and web-based interface
- Mobile Android and iOS
- Customer Support Email, Help Desk, Phone, Chat, and Knowledge Base
- Pricing model Prices start at $5 per user/month for the Starter edition (more on pricing below)
- Free Trial Α free trial is available for 14 days
What is VictorOps known for?
VictorOps is known for its exceptional incident response automation. Users can automate vital incident response processes, including escalations (through escalation policies), war room, and post-incident reviews. In addition, VictorOps also introduces on-call scheduling and automated rotations. This level of automation allows teams to focus on incident resolution and remediation processes.
VictorOps (Splunk On-Call) Highlights
Below are some of the critical features of the VictorOps platform.
- Native iOS and Android applications Receive, act, and resolve incident alerts right from an iOS or Android-based device. In addition, the mobile app comes with features like rerouting and alert snoozing alerts so that you can attend to alerts on the move.
- It improved incident reporting Splunk On-Call comes with valuable reports such as Incident Frequency, MTTA/MTTR, and Post-Incident Review. These reports allow a better and cleaner incident analysis to drive simpler and faster problem resolution.
- Contextual incident information Accelerate problem-solving times and accuracy with the contextual incident information that every alert remediation comes with.
- Seamless integration with existing toolkits The VictorOps platform integrates seamlessly with your current monitoring and collaboration systems. It comes with pre-configured APIs to integrate easily with Slack, ServiceNow, StatusPage.io, Datadog, AppDynamics, AWS, and many more.
- Transmogrifier An advanced alerts and incident management feature. With the Transmogrifier, users can customize and adapt their alerts to suit the team's needs.
- Recommended Responders Recommend the correct user and information with a Machine Learning (ML) engine that looks at resolvers and similar historical incidents. These recommendations help teams resolve incidents faster and with higher accuracy.
- Rules Engine A feature that delivers “extra” helpful information and resources to users when notified of an incident. The rules engine adds more context to incidents, along with resources like remediation documentation, runbooks, articles, etc.
Pros:
- Robust collaboration and communication features
- Rich and seamless integration
- The mobile apps (Android and iOS) are fully developed
- Centralized view for incidents, timeline, and people
- Amazing customer support
Cons:
- API needs some improvement
- UI can be clunky at times
- Difficulty in managing the calendars
- It can be challenging to override shifts and call management
- It can be more expensive than most competition
Getting Started with VictorOps (Splunk On-Call)
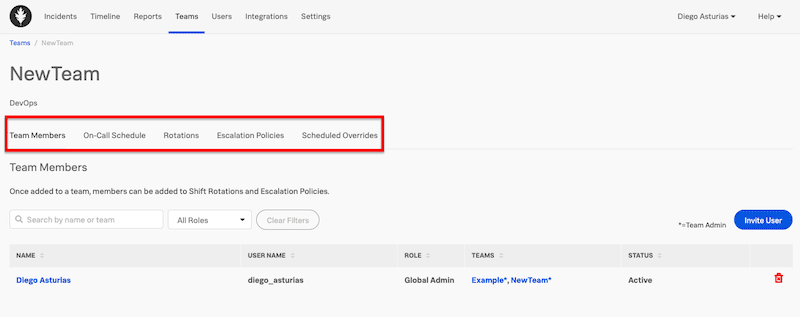
VictorOps recommends creating the Teams as a first step.
- To create a Team > go to Teams > Add Team. This menu item lets you configure user-member lists, on-call schedules, shifts, rotations, escalation policies, and scheduled overrides. Creating a team will make all communication, collaboration, automation, and scheduling tasks much more accessible. In addition, once you create your team, you can go ahead and invite users.
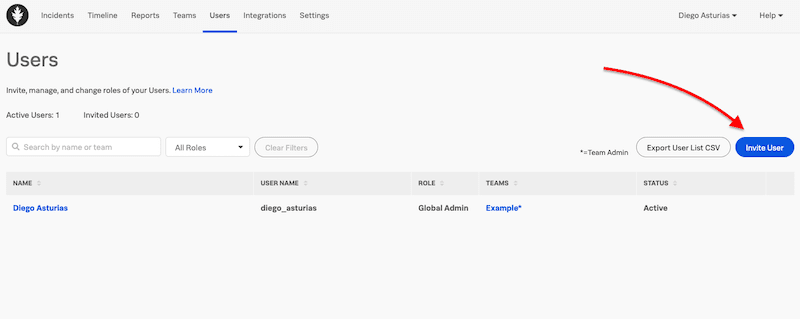
- You can add users from: Users > Invite Users > Input their email address.
- You can also add users by integrating an existing application through its API. To integrate an application, go to Integrations > API. Here you would need to provide the ID and key.
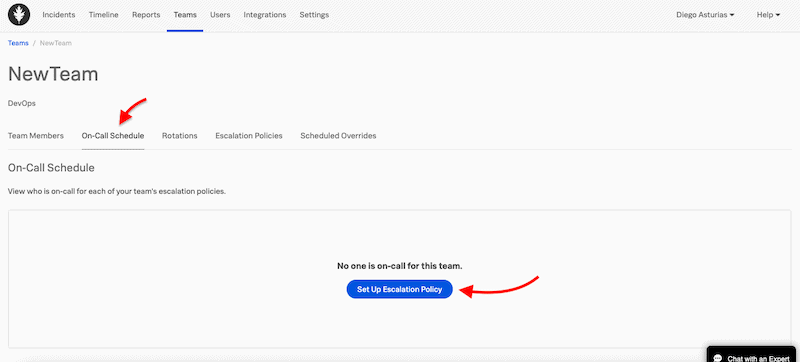
Once you have the teams and team members, it is time to build scheduled rotations and escalation policies. The rotations or on-call shifts are shared across multiple users. These rotations need to be tied to an escalation policy, which specifies how to treat an incident, for instance, which incidents to route, to whom, and how to escalate.
- To do this, head to Teams > On-Call Schedule > Set up Escalation Policy.
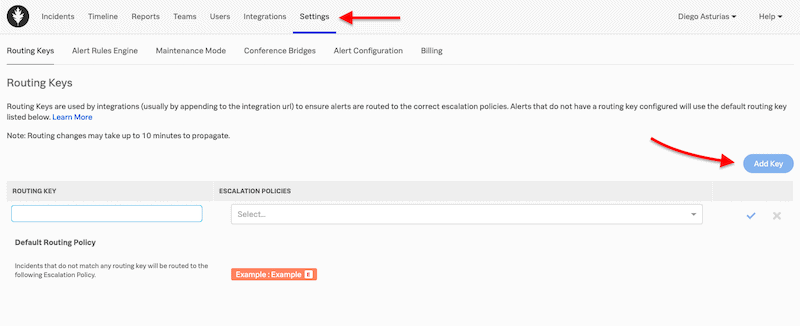
As the next step, set up routing keys. A routing key is an essential initial configuration step. It links an alert from a third-party monitoring tool to the specific user, team, or escalation policy. All kinds of alerts have routing keys. For example, routing keys in Splunk On-Call help get the right person to work on the problem, thus reducing alert noise for those users and teams unrelated to the incident.
- To set a routing key, head to Settings > Routing Keys > Add Key.
- Input a Name. It is recommended to use the team’s name or policy in charge of the alerts or the monitoring tool alerts source.
Navigating through the VictorOps console
The web console comes with seven sub-menus found in the top navigation bar; Incidents, Timeline, Reports, Teams, Users, Integrations, and Settings.
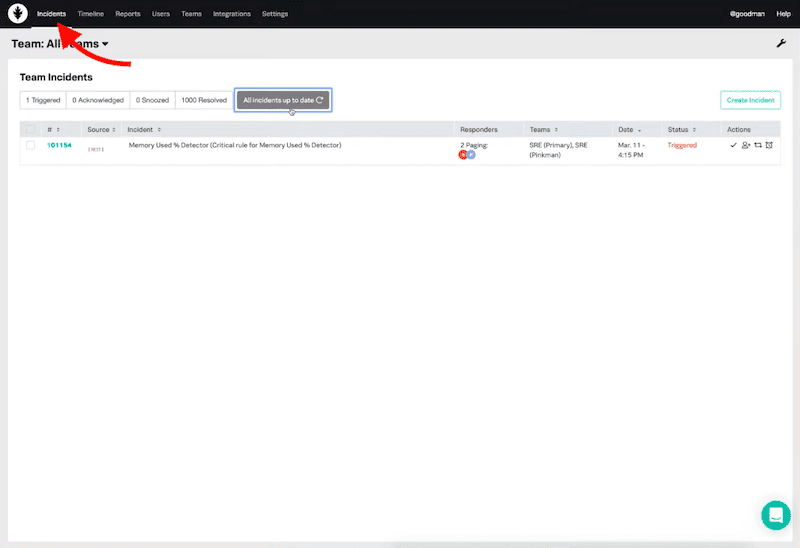
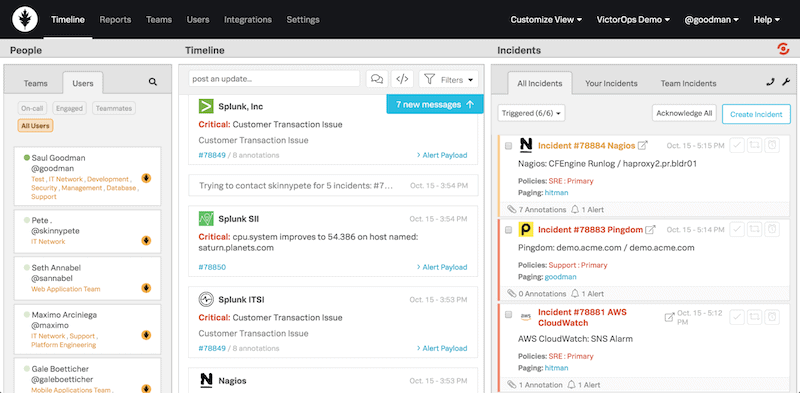
The Incidents View
The incidents view shows an update of all teams incidents. This list summarizes the triggered, acknowledged, snoozed, and resolved incidents.
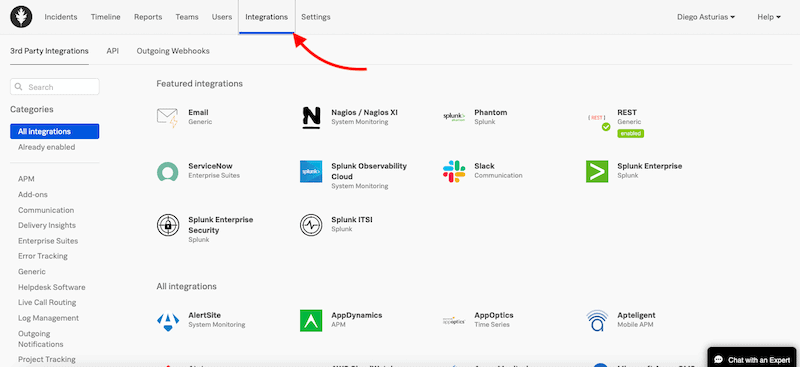
Integrations
To start with Splunk On-Call, it is essential to centralize all the alerts from data sources. We do this by integrating it with the monitoring and alerting authorities. With Splunk On-Call, all your integrations will feed the alerts page and create incidents.
The software can integrate with a diverse and large number of tools, including monitoring, DevOps, Business, and Security software.
- To see all the integrations, go to Integrations in the top navigation bar.
- Splunk On-Call recommends configuring non-alerting integrations like a chat before setting up alert integrations.
The Timeline View
The Splunk On-Call Timeline View is a single central dashboard. According to Splunk, the Timeline view “gives you a real-time firehose to give your team the full context during the firefight.”
The timeline view divides into people, timeline, and incidents. It allows you to keep up a well-informed on-real time status on the current happenings, browse through the timeline, and collaborate with people via the native and integrated chat.
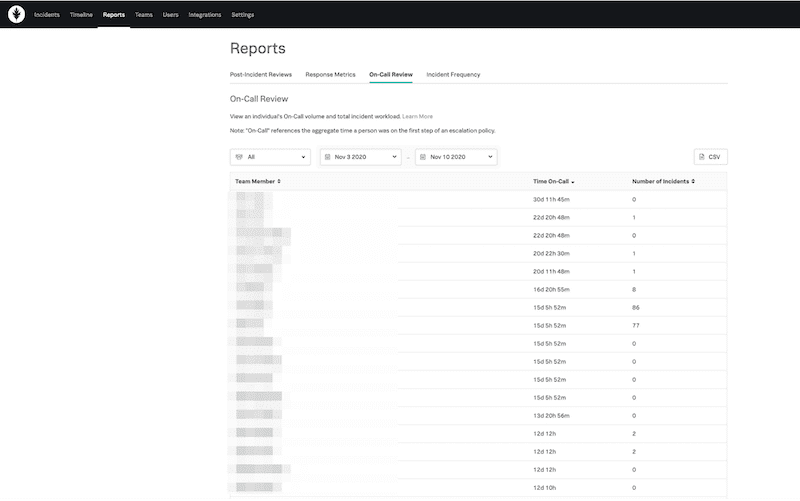
The Reports Page
This page gives constant and updated documentation to keep track of all activity associated with a specific time, user, teams, or alerts, then generates customized reports. Such reports are vital to keeping track of team activity and its performance.
- To generate a report, go to the Reports page in the top navigation bar.
Splunk On-Call comes with four reporting features:
- Post-Incident Review This report shows you a historical insight into particular events specific to a singular incident or time range. If you have a similar problem, the post-incident review provides you with a well-documented account for correcting the problem.
- Performance (MTTA/MTTR) Report This report provides you with the complete picture of achieving quantified objectives. It uses critical metrics such as the Response Metrics MTTA (Mean Time to Acknowledge) and MTTR (Mean Time to Resolve) to show overall performance.
- On-Call Report A report that provides an overview of the team’s workload and a detailed view of the individual’s workload.
- Incident Frequency Report A report that lets you and your team analyze the flow of incidents after they happened. The incident frequency report helps you move to the source of the problem to solve incidents with more precision.
VictorOps (Splunk On-Call) Pricing
The VictorOps, now Splunk On-Call software, is part of Splunk’s observability solutions. The platform is priced on a per-user/month basis. If you decide to pay annually, the price starts at $5 (Starter), Growth ($23), and Enterprise ($25). But you may also pay monthly, with different pricing, starting at $10 (Starter), Growth ($35), and Enterprise ($45).
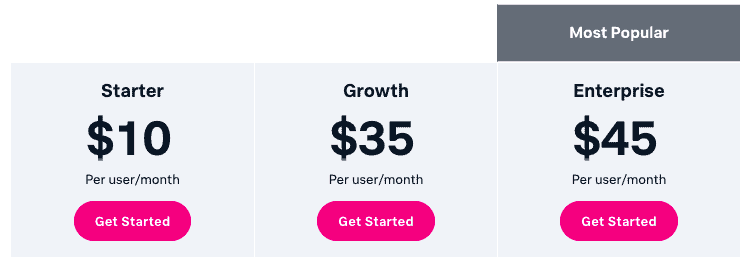
Note that all the plans include the iOS and Android Mobile App. Below is a brief description of every plan:
- Starter Up to 10 users for collaborative incident response. It does not support ITSM Integrations (ServiceNow, JIRA).
- Growth Unlimited users. It does not support ITSM Integrations (ServiceNow, JIRA).
- Enterprise Unlimited users. Support ITSM Integrations (ServiceNow, JIRA). Includes Machine Learning to identify similar incidents and suggested responders.
Free Trial? Register without a credit card to try VictorOps (Splunk On-Call) free for 14 days.
Top VictorOps Alternatives List
Below are the top alternatives for VictorOps. These alternatives are similar incident management and response software targeted for DevOps, SRE, and IT Ops teams, with robust integration capabilities. In contrast, other VictorOps alternatives described below are the monitoring, observability, or AIOps tools that come with incident management capabilities.
Our methodology for selecting VictorOps alternative tools
Choosing the right incident management and the on-call tool is crucial for ensuring effective communication and resolution of incidents in your organization. Below, we have listed the proven methodology to choose the best alternatives for incident management for you.
- Evaluate the features and capabilities
- Check for integration with your existing tools
- Checkout the on-call scheduling features
- Check its automation and customization features
- Availability of documentation and training resources
- Consider Security and Compliance that fits into your organization
- Consider budget
- Go for a free trial and explore the features
1. Datadog
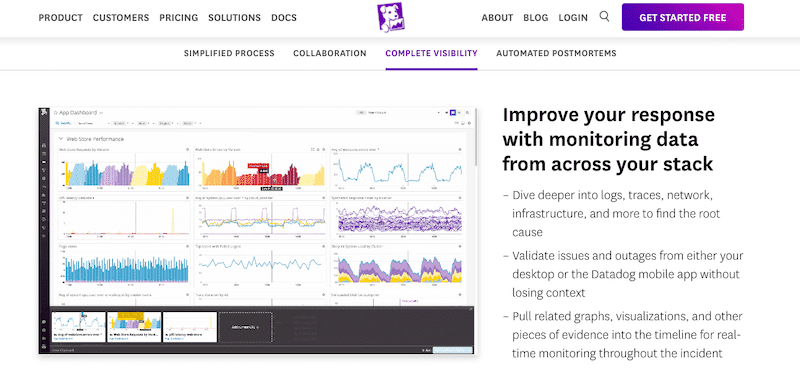
Datadog is an Infrastructure and Application Monitoring SaaS-based solution. It provides monitoring for the entire application stack (on-prem or cloud) at any scale— all through a SaaS-based data analytics platform. In addition, Datadog also provides robust incident management and error tracking.
Key features
- It supports Dependency Tracking
- Efficient Dashboards and Visualizations
- Root Cause Analysis
- Threat Intelligence and vulnerability assessment
Why do we recommend it?
The Datadog is an invaluable tool for monitoring app performance and identifying user pain points. It helps to detect bottlenecks and work on improving the user experience. Datadog's extensive data analytics tools offer substantial value, justifying the effort and cost of the insightful metrics it provides.
Who is it recommended for?
Web and IT professionals, particularly those responsible for website reliability and performance, find this tool very useful. It helps to receive alerts for website downtime, errors, significant changes, and other events. The best thing about this tool is that it can monitor multiple websites simultaneously and organize them with dashboards to focus on the seamless operation and optimal performance of online platforms.
Pros:
- Offers numerous real user monitors via templates and widgets
- Can monitor both internally and externally giving network admins a holistic view of network performance and accessibility
- Changes made to the network are reflected in near real-time
- Allows businesses to scale their monitoring efforts reliably through flexible pricing options
Cons:
- Would like to see a longer trial period for testing
Register for a 14-days Free Trial!
EDITOR'S CHOICE
Datadog stands out as a top choice because it provides comprehensive API access to observe both applications and infrastructure. It easily captures events and metrics using client libraries. Also, it allows users to gain valuable insights into their systems, making it a preferred solution for effective and informed decision-making.
Download: Get a 14-day free trial
OS: Windows Server
2. PagerDuty
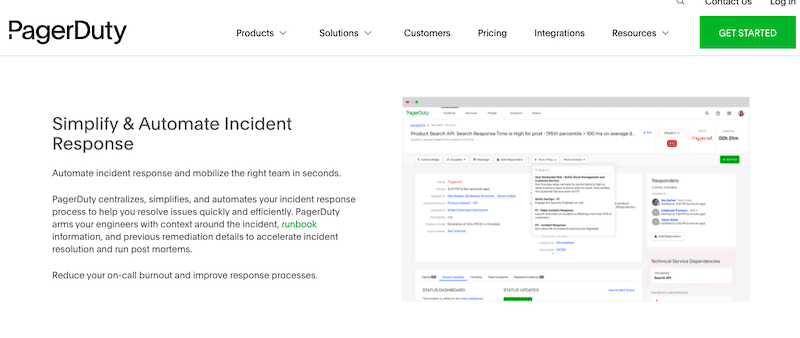
PagerDuty is an incident management and response platform for real-time operations. It integrates machine data with human intelligence to enhance the organizations' visibility. PagerDuty also provides on-call management, automated incident response, runbook automation, event management, and operational analysis.
Key Features:
- Intelligent Automation
- Workflow Management
- Utilizes AIOps for optimal performance
- Proactive Workflow and error alerts
- Constant monitoring
Why do we recommend it?
PagerDuty is a user-friendly tool and has plenty of versatile features. With multiple integrations, it is easy to set up, allows teams to manage schedules, and offers flexible overrides. It supports a plethora of notification and escalation options, along with personalized communication preferences for users, making it a reliable choice for seamless incident management.
Who is it recommended for?
PagerDuty is recommended for experts and DevOps professionals managing critical issues, especially those in remote-first and distributed crisis management teams. It helps in critical incident management by orchestrating responses from any platform. PagerDuty provides the necessary tools for streamlined crisis resolution in diverse and dynamic work environments.
Pros:
- Combination of communication and incident response platform
- Ideal for small to medium-sized teams
- Leverages AI to improve alerting functions
- Is offered as a flexible SaaS product
Cons:
- Enterprises might be left wanting more
- No self-hosted version is available
Sign up for a 14-days free trial.
3. Opsgenie
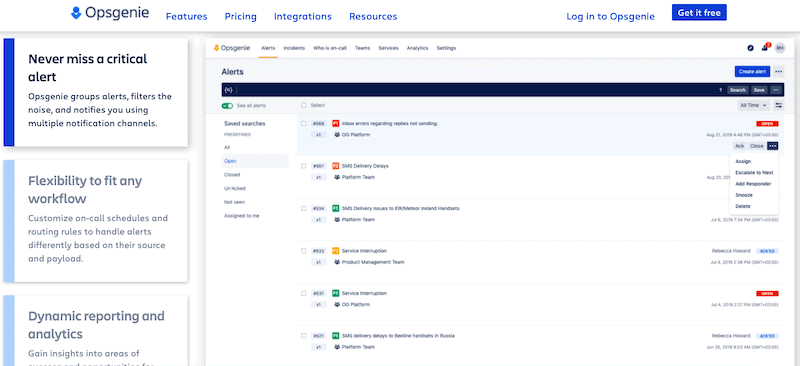
Opsgenie by Atlassian is a modern incident management platform. It integrates with third-party monitoring systems and applications to receive alerts. In addition, Opsgenie comes with features like on-call scheduling, escalation policies, actionable and reliable alerting, and advanced reporting and analytics.
Key Features:
- Custom alerts and notifications
- On-call management & escalations
- Advanced Reporting & Analytics
- Effective communication and collaboration
- Post-Incident Analysis
Why do we recommend it?
Opsgenie can be seamlessly integrated into various Jira Service Management plans, offering end-to-end incident management. It supports integrations with over 200 leading monitoring, ITSM, ChatOps, and collaboration tools, providing a comprehensive solution for efficient and effective operations across different platforms.
Who is it recommended for?
Opsgenie is the number 1 tool for alerting and response; hence, it is perfect for experts and professionals in IT operations who require a tailored approach to alert management. The tool allows customization of on-call schedules and routing rules, enabling the handling of alerts based on their source and payload. This flexibility ensures that alerts are managed in a way that aligns with the specific needs and workflows of different teams and organizations.
Pros:
- INtegrates into a wide variety of alerting and third-party tools
- Includes various escalation and incident response templates
- Has various templates that make onboarding easy
- Great interface – easy to use and learn
Cons:
- Could user a longer trial period
Sign up for a 14-days free trial!
4. xMatters
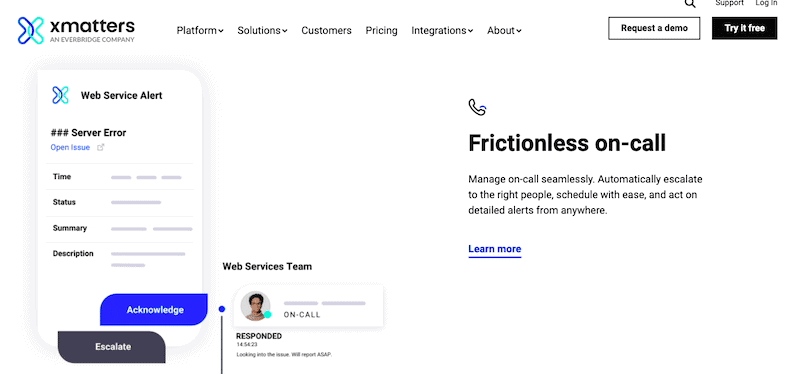
xMatters is a service reliability platform targeted to help DevOps, SREs, and IT operations teams ensure their applications are up and running. The xMatters platform includes automated incident management, on-call management, alerts intelligence, workflow automation, and analytics.
Key Features:
- It has a scalable architecture
- Supports role-based permissions
- Comes with ready-made integrations
- Flexible API to connect with other platforms
- Continuous improvement and collaborative response
Why do we recommend it?
We recommend xMatters for its intelligent targeting capabilities. It allows you to reach the right people efficiently by employing skill-based and availability routing. This ensures that critical information is directed to individuals with the relevant expertise and availability, optimizing communication and incident response within organizations.
Who is it recommended for?
xMatters is widely used by network experts and professionals involved in incident management and service reliability. This tool gives detailed post-incident reports, instant replays on the event timeline, real-time visibility into service-level indicators, and user/team performance metrics to have comprehensive insights and analytics for continuous improvement in managing incidents and maintaining high service standards.
Pros:
- Built for helpdesk as well as DevOps teams – highly flexible
- Has various custom alerts templates
- Includes workflow automation for easy onboarding
Cons:
- Better suited for SMB environments
5. Freshservice
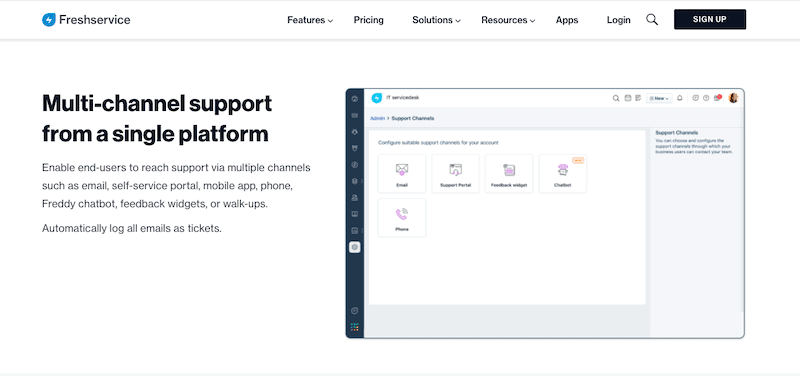
Freshservice is an intelligent and unified cloud-based service desk and IT Service Management (ITSM) solution. It is designed with ITIL's best practices to manage IT operations problems and service requests more efficiently. Freshservice is also easy to use, set up, provides a diverse and broad integration list, and comes with robust incident management features.
Key Features:
- Intuitive Consumer-Grade Service
- Supports Active Directory Integration
- Major incident Management and SLA management
- AI-powered service management
Why do we recommend it?
Freshservice has numerous robust features that support end-users through powerful chatbots, boost agent productivity with intelligent suggestions, and provide valuable insights through AI-driven analytics. It is easy to deploy and offers immediate value delivery, making Freshworks AI a practical choice for organizations looking to enhance their customer support and service management processes.
Who is it recommended for?
Freshservice is helpful for organizations and service management professionals who use a unified platform for multiple teams. This tool allows various teams to coexist seamlessly on a single platform, providing control over work and visibility for each department individually. It is perfect for experts and professionals who want to collaborate across different areas without impacting security.
Pros:
- One of the better user interfaces for ITSM tools
- Flexible subscription and annual pricing options
- Includes a self-service portal to help reduce inbound tickets
- Simple ticket creation is user friendly for new staff
Cons:
- The trial could be a bit longer
- Integrations into other ITSM tools can be complicated
Sign up for a 21-days free trial.
6. New Relic One
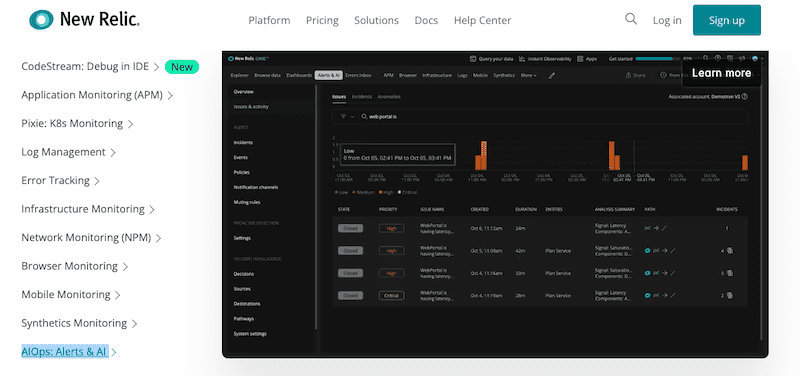
New Relic One is a robust cloud-based observability platform that helps DevOps teams collaborate and solve problems. New Relic focuses on performance and availability monitoring. It keeps track of applications (APM), network, infrastructure, log management, and more. In addition, New Relic also allows incident orchestration and response with AIOps.
Key Features:
- Full-stack observability
- Supports multiple integrations
- real-time instrumentation and analytics
- Flexible dashboards
- Get accurate transaction data
Why do we recommend it?
New Relic One is well-known for its unique capability, where APM agents operate within applications to provide unparalleled access for deep diagnostics and profiling. This allows for comprehensive insights, making it an ideal choice for those seeking advanced performance monitoring and optimization within their applications.
Who is it recommended for?
New Relic One is used by various developers, IT professionals, and businesses aiming to monitor and optimize application performance. The cloud-based platform simplifies the instrumentation process, allowing users to collect detailed application performance data seamlessly as their applications transition from on-premise to the cloud.
Pros:
- Certified for Microsoft Azure monitoring
- Uses anomaly detection to highlight abnormal behavior in your Azure environment
- Uses simple but intuitive admin dashboards
Cons:
- Better suited for small to medium-sized Azure networks
New Relic offers a perpetual free limited license.
7. Moogsoft
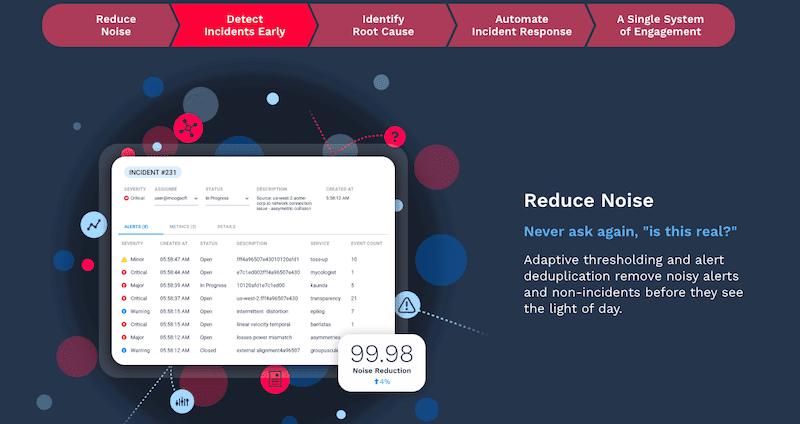
Moogsoft is an AIOps and observability platform for DevOps, SRE, and IT operations teams. This tool provides a central platform for all data sources and monitoring tools. It collects raw data, such as metrics and notifications, then correlates and normalizes it into a list of incidents.
Key Features:
- It supports custom integration
- Incident reporting and prioritization
- Collaboration and management
- Pattern discovery
- Root cause identification
Why do we recommend it?
Moogsoft is known for its capability to bring continuous improvement by automating the incident management workflow. This will help users to save time, allowing them to focus on more important and enjoyable tasks rather than getting bogged down in manual incident management processes.
Who is it recommended for?
Moogsoft is widely used by IT administrators and software engineers who deal with incident resolution and outage prevention. It helps in correlating similar events, offering features like metric data ingestion, anomaly detection, event duplication management, alert correlation, and effective data retention. This makes it a valuable asset for professionals dedicated to maintaining robust and reliable IT systems.
Pros:
- Sleek and simple admin console
- Built for enterprise AIOps
- Uses noise reduction AI to reduce alert fatigue and duplicate alerts
- Offers realtime analysis – even at scale
- Supports a free version
Cons:
- Can take time to fully explore all the platforms features
Sign up to get a 14-days free trial.
8. BigPanda
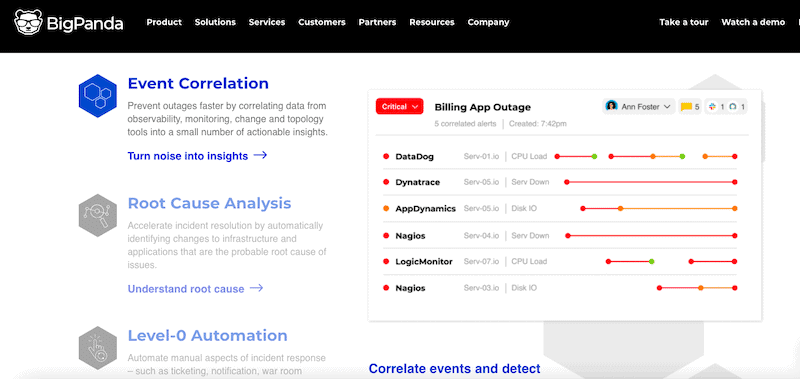
BigPanda is an IT Ops event correlation and automation platform powered by AIOps. It aggregates, correlates, and normalizes data gathered from different monitoring and observability tools. Then it uses AI and ML to correlate data into actionable insights. The tool also provides automated root-cause analysis and level-0 automation.
Key Features:
- AI-Generated Incident Analysis.
- Supports root cause analysis
- rapid identification and escalation
- Workflow automation and analytics
- Enterprise security and safety
Why do we recommend it?
BigPanda efficiently collects, cleans, and prepares data for AIOps processing. It follows an engineering process along with multiple stages, including filtering, normalization, deduplication, aggregation, and enrichment to convert raw events into valuable insights with precision and effectiveness.
Who is it recommended for?
BigPanda is recommended for experts and professionals in the field of IT operations, particularly those handling incident management and root cause analysis. The tool's Root Cause Changes feature is designed for individuals who work with various change feeds and tools, such as CI/CD, Change Management, and Auditing. It uses a text-matching algorithm to identify potential root cause changes for active incidents to address issues efficiently.
Pros:
- Leverages AI to collect, interpret, and manage a variety of data points
- Uses automation to streamline workflows and improve team intelligence
- Clean and highly intuitive UI
Cons:
- Would like to see a trial versus a demo

