
Our funding comes from our readers, and we may earn a commission if you make a purchase through the links on our website.
The Best Router Monitoring Software & Tools for Bandwidth & Traffic Analysis
UPDATED: March 20, 2024
We understand the headache that network administrators go through when monitoring network traffic, bandwidth usage, load-balancing, network devices, etc. Overloaded routers can represent a risk for your company’s communication system. This is why network admins should count on reliable IT Infrastructure monitoring tools, such as the software we are going to talk about.
As you look for powerful and affordable tools, there are some extra features that you should not miss. For example, port management, traffic analysis, and even network security.
Here is our list of the eight best router monitoring software and tools:
- SolarWinds Network Insight for Cisco ASA Monitoring – EDITOR'S CHOICE A group of software products that includes the Network Performance Monitor. The NPM communicates with switches and routers to extract status reports with the Simple Network Management Protocol. The NetFlow Traffic Analyzer watches over traffic patterns. Both run on Windows Server. Start a 30-day free trial.
- Paessler PRTG Router Monitoring – FREE TRIAL A package of monitoring systems for networks, servers, and applications that includes SNMP routines for router status monitoring plus traffic management systems. Installs on Windows Server. Stat a 30-day free trial.
- ManageEngine OpManager – FREE TRIAL A network monitor that includes status monitoring for switches and routers and also bandwidth analysis features. Available for Windows Server and Linux. Download the 30-day free trial.
- Site24x7 Network Monitoring – FREE TRIAL This monitor uses SNMP to monitor the statuses of network devices and is delivered from the cloud. Start a 30-day free trial.
- Nagios XI A system monitoring package that includes SNMP status checking for switches and routers plus traffic monitoring services. Runs on Linus or on Windows over a VM.
- Zenoss A system monitoring package that includes network performance and traffic analysis and can be extended by ZenPacks. There is a ZenPack for Cisco network device monitoring. Available as a paid cloud platform or for installation on Linux for free (Zenoss Core).
- WhatsUp Gold A network monitoring tool that uses SNMP for network device monitoring and can be extended by an add-on to include traffic monitoring. Installs on Windows Server.
- Icinga 2 A fork of Nagios that takes all of the Nagios plug-ins. The core system includes the monitoring of network devices and traffic analysis features. Installs on Linux.
In this article, we will review and take a closer look to the best monitoring software and tools for, port/interface management and bandwidth/traffic analysis. We hope by the time you finish reading you will have a better understanding of each one of these tools.
The Best Router Monitoring Tools & Software
What should you look for in router monitoring tools?
We reviewed the market for bandwidth and traffic management tools that communicate with routers and analyzed the options based on the following criteria:
- A service that can collect performance data from switches and routers
- A service that is able to use SNMP for status querying
- An alerting mechanism to warn of impending problems
- A dashboard that shows live performance data
- An autodiscovery function for automated device enrollment
- A free trial or a free package
- A free tool that is worth installing or a paid tool that offers value for money
With these selection criteria in mind, we have found monitoring systems that will query switches for their statuses as well as watching over router performance. Our selection includes packages that will install on Windows and Linux.
1. SolarWinds Network Insights for Cisco ASA Monitoring – FREE TRIAL
SolarWinds Network Insight for Cisco ASA will allow you to monitor the performance of your routers and firewalls. This software provides you with continuous monitoring to ensure the availability of your networks are at an all time high. This platform also offers complete visibility of your firewalls in a single dashboard, allowing you to identify any error and reduce downtime, helping you to ensure service availability.
Key Features:
- Monitor Multiple Cisco Devices: It includes advanced networking devices to integrate everything in one tool.
- Automatic Discovery of Cisco Devices: It has a dashboard that automatically discovers and monitors the Cisco devices.
- Dynamic Mapping: It allows to create dynamic custom topology to have a view of the entire network and performance.
- Track Network and Response Time: You can identify the downtime and configure your dashboards according to the factors.
Why do we recommend it?
SolarWinds Network Insight for Cisco ASA Monitoring is recommended because it allows for the easy discovery and monitoring of Cisco devices using NPM's features. With an intuitive dashboard, you can efficiently monitor critical nodes by adding relevant Cisco devices to your inventory, ensuring effective network management and troubleshooting.
This software is based on two solutions, Network Performance Monitor and Network Configuration Manager, each one with its own features.
Network Performance Monitor Features:
Reduce network outages and improve performance, very simple to use, customizable dashboards.
- Multi-vendor network monitoring.
- Network Insights for deeper visibility.
- Intelligent maps.
- NetPath and PerfStack for easy troubleshooting.
- Smarter scalability for large environments.
- Advanced alerting.
Network Configuration Manager Features:
Automated network configuration and compliance management, reduces the time required to manage critical changes. It also resolves operational issues faster and reduces downtime. Network Configuration Manager helps to identify that the network is compliant.
- Network automation
- Network compliance
- Configuration backup
- Vulnerability assessment
- Network Insights for Cisco ASA and Cisco Nexus
- Integration with Network Performance Monitor
Who is it recommended for?
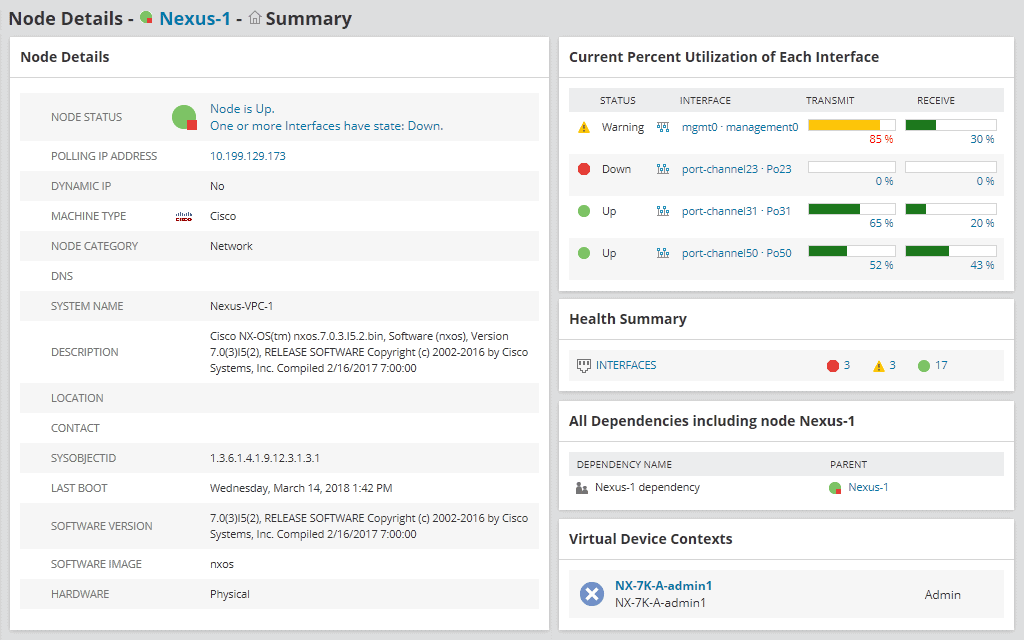
This tool is recommended for network administrators and IT professionals who manage Cisco SwitchStacks, Nexus devices, and Cisco ASA firewalls. Experts use it to assess the health of SwitchStack members, identify issues, monitor data connections, and ensure the optimal performance and security of Nexus devices and Cisco ASA firewalls for uninterrupted service availability.
Here is what the Cisco ASA Network Management Software looks like:
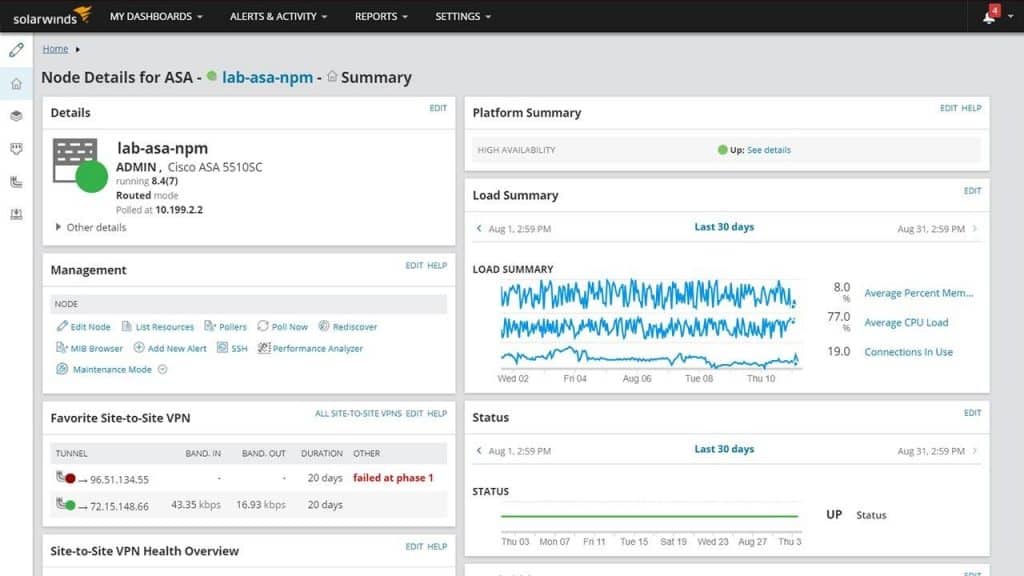
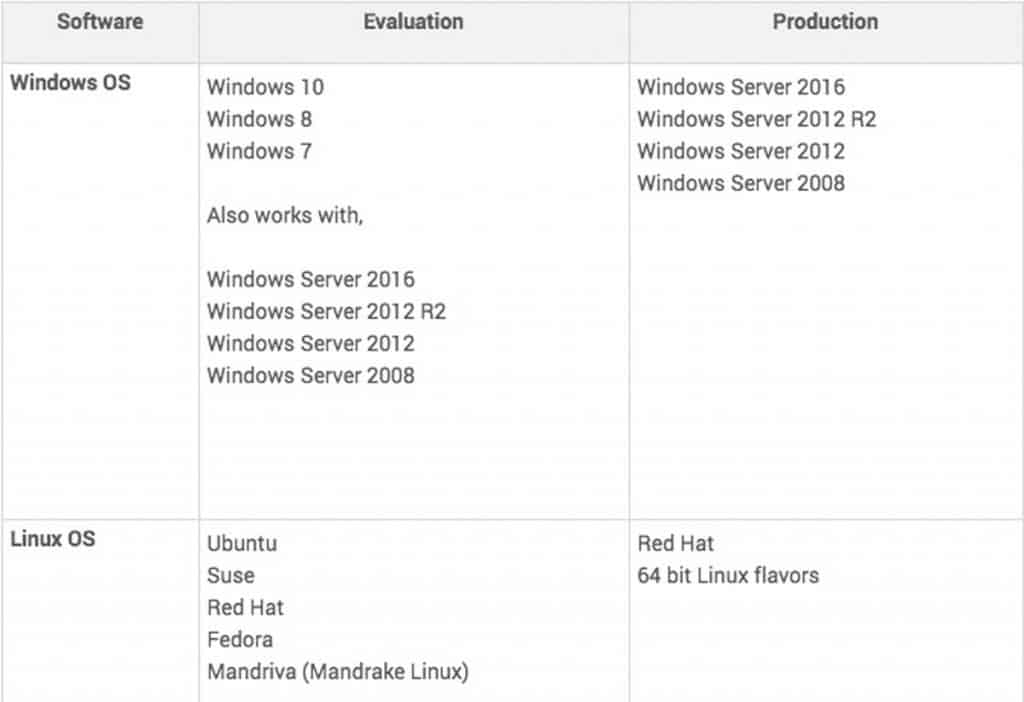
Implementation and System Requirements:
- Network Performance Monitor: Operating System: Windows Server 2012 and 2012 R2
Here are some other software requirements:
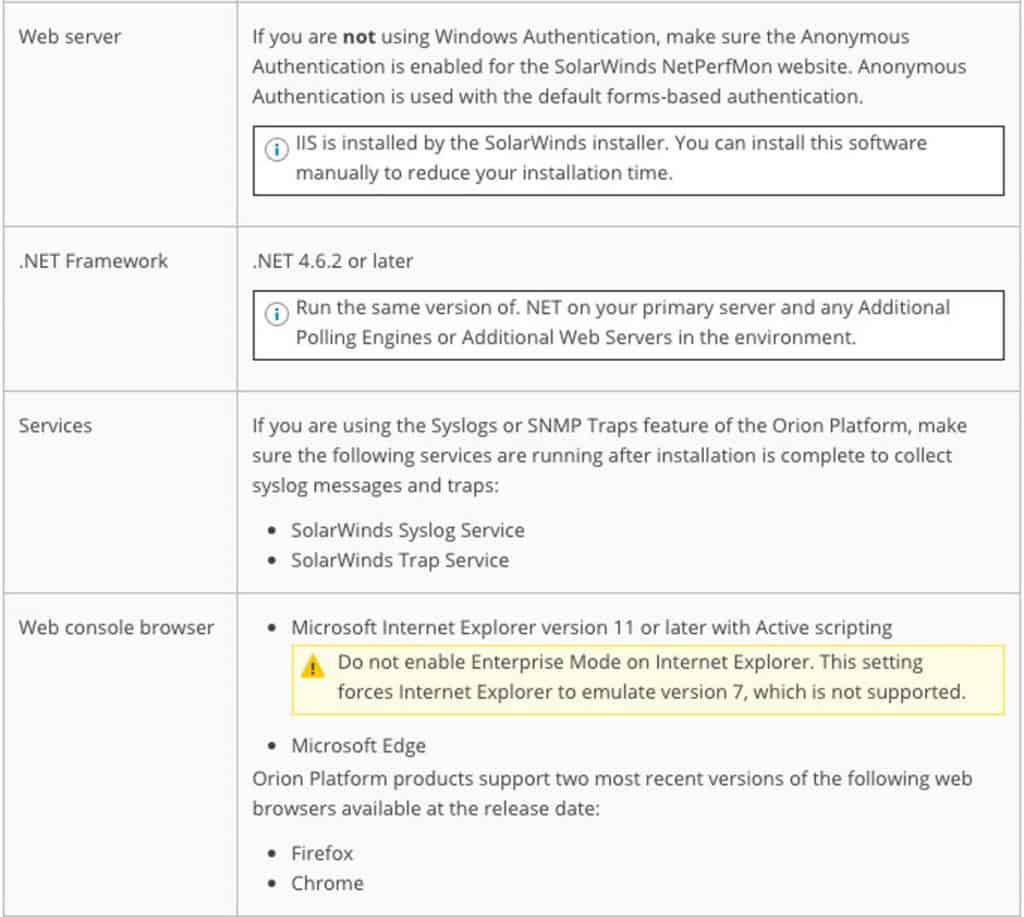
You can see the complete list of requirements for the Network Performance Monitor here.
- Network Configuration Manager: Operating System: Windows Server 2012 And Windows 2012 R2, Windows 2016.
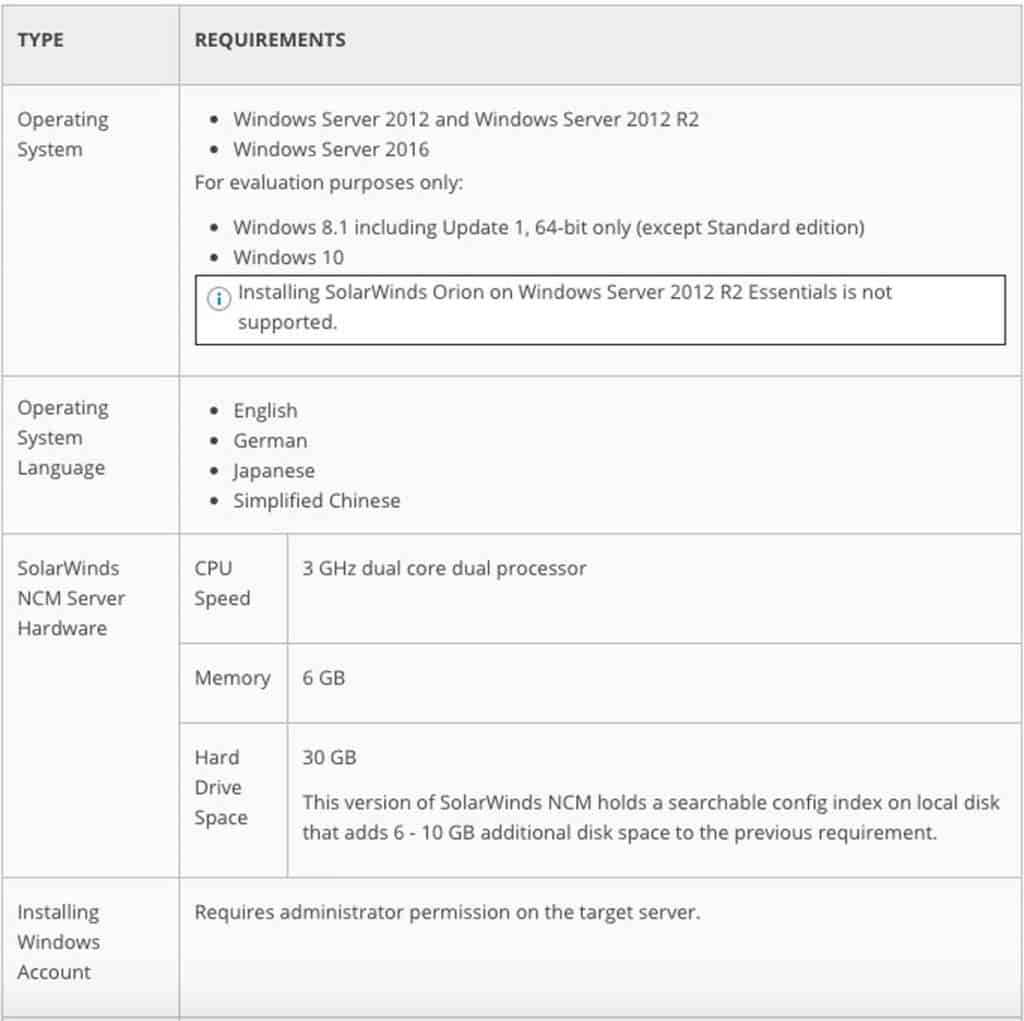
You can see the complete list of other requirements for the Network Configuration Manager, such as port requirements, here.
Pros:
- Designed specifically to monitor Cisco hardware metrics
- Simple yet intuitive dashboards – uses color well to highlight key insights
- Can access insights from most modern browsers
- Offers condition and threshold-based alerting templates
Cons:
- Designed for network professionals, the platform can take time to fully explore
EDITOR'S CHOICE
The Network Insights group of monitoring systems is our top pick for router monitoring software because it combines three individual SolarWinds tools that are written on a common platform, called Orion. These tools provided total network monitoring and management services, offering network performance monitoring, which queries routers and switches to head off problems. The NetFlow Traffic Analyzer extracts traffic flow information and gives you options to implement traffic shaping. The Configuration Manager helps you to standardize the settings of your network devices and prevent unauthorized changes to them.
Download: Start 30-day Free Trial
Official Site: solarwinds.com/topics/network-insight-cisco-asa/registration
OS: Windows Server
2. Paessler PRTG Router Monitoring – FREE TRIAL
The PRTG Router Monitoring is a software suite that is a Great Network Monitoring tool as well as a Router and Infrastructure monitoring software as well.
Key Features:
- Customizable Alerts: Set up personalized alerts to get notifications when something's not right with your router, ensuring prompt action to prevent issues.
- Detailed Reports: PRTG automates the generation of reports, saving time and effort in summarizing router performance for analysis or sharing with stakeholders.
- SSL/TLS-Secure Web Server: it works as a single-page application and saves a lot of time; you don't need to reload every time.
- Highly Customized: You can create personalized templates, sensors, and notifications according to changing needs.
Why do we recommend it?
We recommend Paessler PRTG Router Monitoring to assess router connections. It helps track bandwidth usage, identify top traffic generators, and locate network bottlenecks. With detailed insights, administrators can efficiently manage and optimize network performance, making their work easier and ensuring smooth operations.
Its purpose is to avoid overloaded routers by checking bandwidth consumption, network traffic, and router error messages. It can also detect suspicious traffic to your routers. This software is very flexible and customizable, and it’s also accessible through its web interface.
Who is it recommended for?
Paessler PRTG Router Monitoring is recommended for network administrators and IT professionals. Experts use this tool to stay informed about VPN connection status and receive automatic alerts for potential issues within routers or network traffic. PRTG enables quick action to prevent bandwidth bottlenecks, ensuring a smoothly functioning network.
Common Features:
- Flexible Alerting:
Schedule Alarms and Alerts to suit your needs, with different alert Types such as email, push notifications with your mobile phone, etc. - Multiple User Interfaces:
You can access this software from the web interface, the enterprise console (native Windows application) and the apps (iOS and Android). All the interfaces can be used simultaneously. - Cluster Failover Solutions:
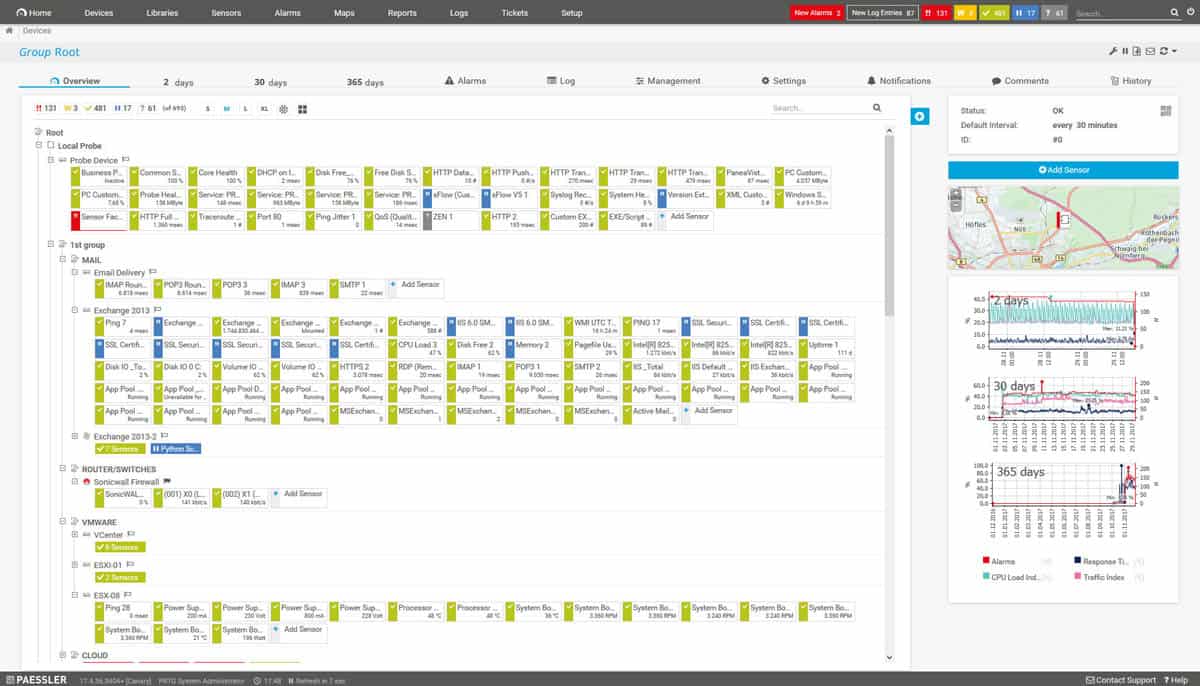
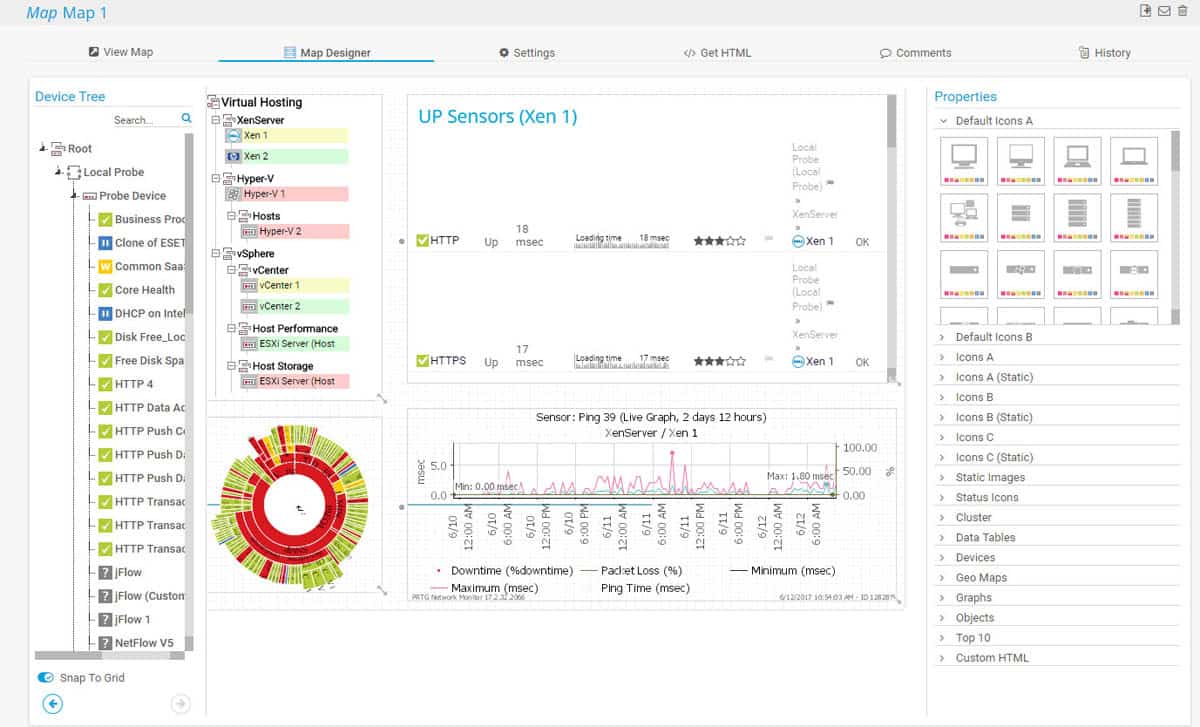
The risk of a cluster being down is high, but PRTG allows failover tolerant monitoring, providing automatic failover handling. This is extremely helpful if the primary master of the cluster fails, another node will take over. - Maps and Dashboards:
One of the most important features, because you can customize dashboards with the PRTG map designer, which can be created with HTML.
Here you can see the maps and dashboards of the PRTG:
- Distributed Monitoring:
You can use remote probes to distribute monitoring load and to monitor your LAN connection. Also, monitor several networks at the same time. - In-Depth Reporting:
Reporting is another of the preferred features, you can personalize your reporting based on your needs. You can also export the reporting in many formats and schedule regular reports.
Implementation and System Requirements:
An advantage of this software is that the developer made it very easy to install, using a Step-by-Step installation wizard unlike some Open-Source monitoring tools on the market. You are fully guided by Modules to the installation by an e-learning module.
There are two installers for the PRTG: one for the Free Trial and Freeware version and one for the Commercial Version. If you have a Free Trial and you want to install the Commercial version, you just have to install it on the top of your trial.
It is important to know that you require to have a Windows machine to install this software, the recommended system requirements are specifically x64 PC/server hardware (not older than 2 years) or Windows Server 2012 R2 having .NET Framework 4.5 or later installed.
Many parameters should be taken into consideration for optimal performance and stability, but you can refer to the following sizing recommendations for the hardware of the PRTG server:
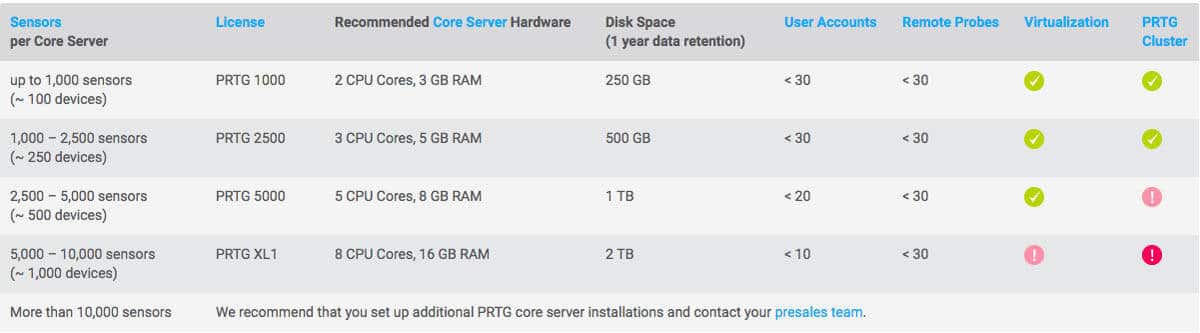
The price range depends on your needs and varies from a Free Version with includes Up To 100 Sensors FREE the way up to $1600, which includes 500 sensors and 1 server installation, to $60,000 including unlimited sensors and 5 server installations. If you need a personalized quotation you also have this option.
Pros:
- Uses a combination of packet sniffing, WMI, and SNMP to report network performance data
- Fully customizable dashboard is great for both lone administrators as well as NOC teams
- Drag and drop editor makes it easy to build custom views and reports
- Supports a wide range of alert mediums such as SMS, email, and third-party integrations into platforms like Slack
- Supports a free
Cons:
- Is a very comprehensive platform with many features and moving parts that require time to learn
Download Your 30-day Free Trial of PRTG and Get Started Today!
3. ManageEngine OpManager – FREE TRIAL
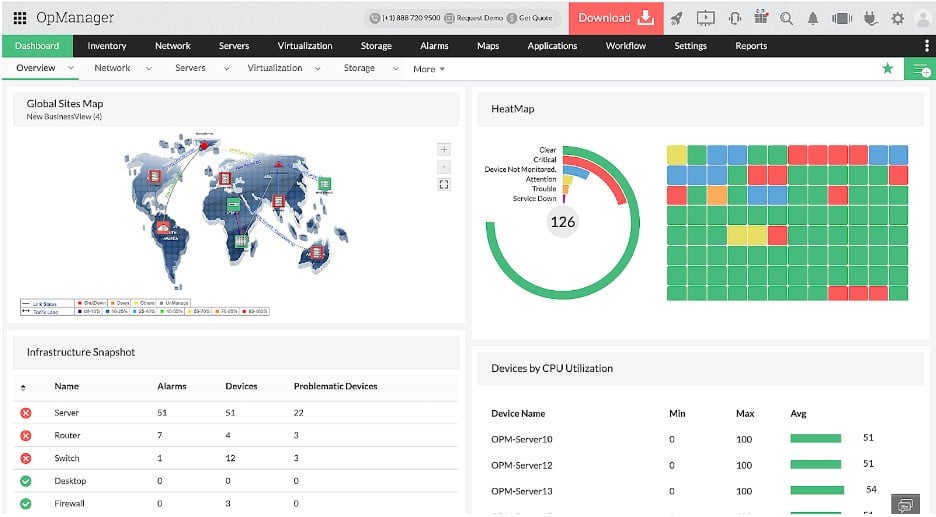
ManageEngine OpManager is a network management application which will help you manage network traffic, bandwidth usage, monitoring network devices such as routers, from one integrated platform. This tool is easy to use and doesn’t require any setup or consultation fee. You can monitor over 15,000 interfaces in just one minute.
Key Features:
- Multi-vendor Support: You can use it with a variety of network devices from different vendors.
- Fault Management: This tool quickly detects and addresses faults in your network; hence, you can minimize downtime.
- Performance Monitoring: You can keep your eye on the performance of network elements, applications, and servers to make sure everything is working well.
- Automated Workflows: It reduces manual effort with the help of computerized workflows and manages other network tasks efficiently.
Why do we recommend it?
ManageEngine OpManager provides robust support in monitoring and maintaining various wireless devices like access points, routers, switches, laptops, and WiFi systems. You can easily track wireless network traffic and WiFi strength and check detailed insights through availability and health reports to manage your wireless network.
With ManageEngine OpManager comes with a full router monitoring solution allows monitoring of critical WAN links and its routers. You can measure bandwidth and traffic in order to improve bandwidth allocation.
OpManager can check various features on router performance such as:
- CPU Utilization
- Memory Utilization
- Errors
- Temperature and Voltage
- CRC errors and Collisions
- Buffer statistics.
Who is it recommended for?
Storage administrators and IT professionals who manage storage infrastructure use this tool in day-to-day life. It helps monitor storage devices such as Fiber channel switches, storage arrays, and tape libraries.
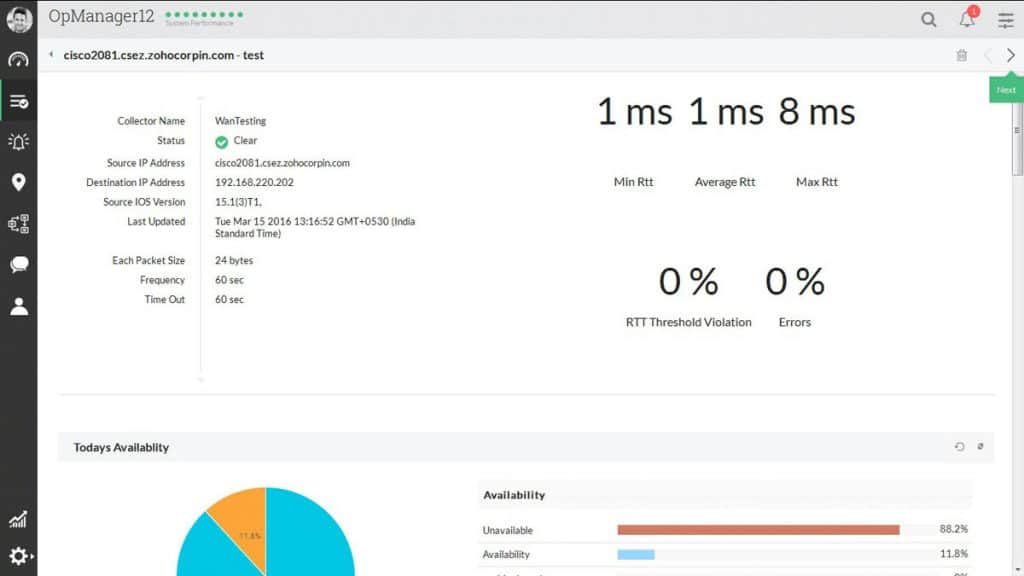
Screenshots
- WAN Monitoring:
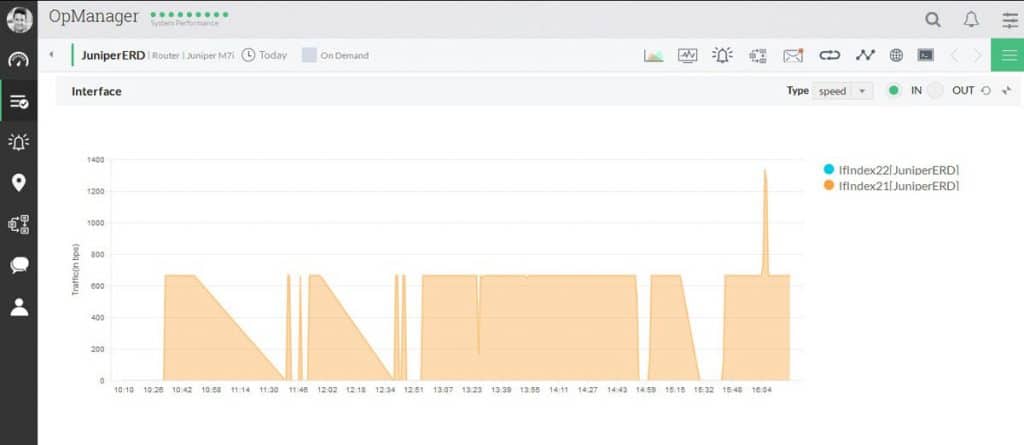
- Router Interface Reports:
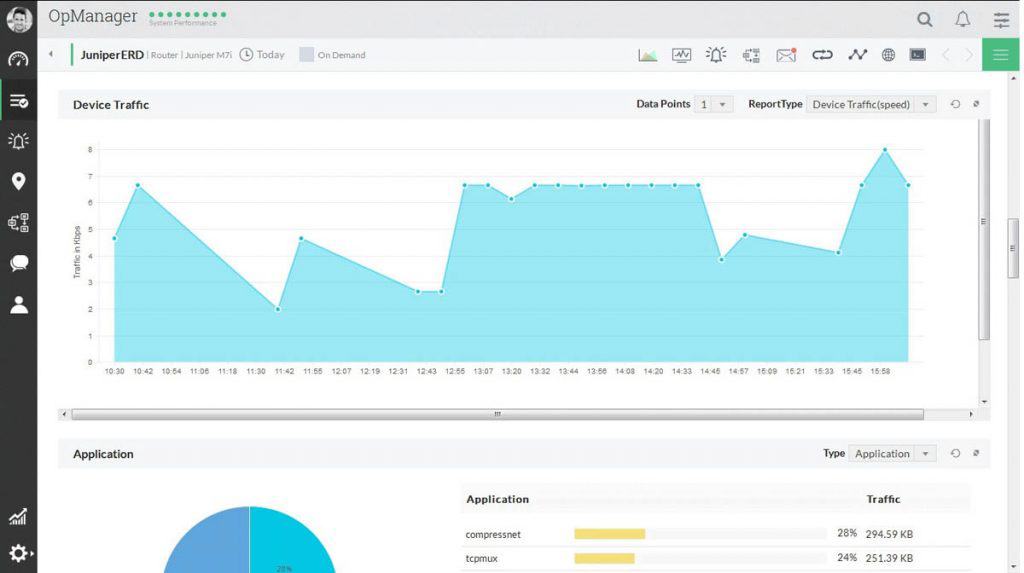
- Router Traffic Reports
System Requirements:
You can install ManageEngine OpManager in Windows and Linux OS. For more information, refer to the screenshot below.
You can check the complete list of the system requirements here.
Pros:
- Supports a freeware version
- Uses both SNMP and NetFlow for monitoring giving it more coverage options than other tools
- Can scale easily, Enterprise package supports up to 10,000 endpoints
- Utilizes automatic network discovery to create live inventories and network maps for administrators to track assets and network size
- Viable for both large and small networks
Cons:
- OpManager is dense with features, integrations, and settings, and may take time to fully learn
You can get a 30-day free trial of OpManager, which includes monitoring up to 10 devices.
Then there are three editions of the Paid Version:
- Essential, which includes monitoring up to 1K devices from a single server
- Enterprise, which includes monitoring up to 50K devices or 100K interfaces from a single server
- Service Packs, for 12300 & above customers
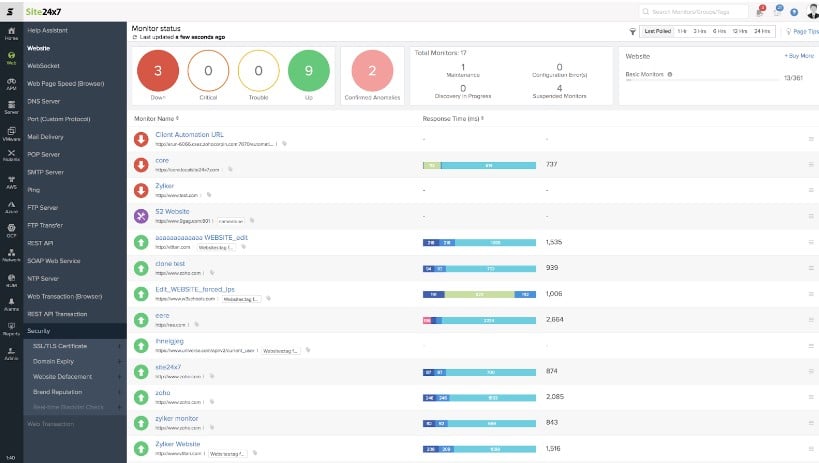
4. Site24x7 Network Monitoring – FREE TRIAL
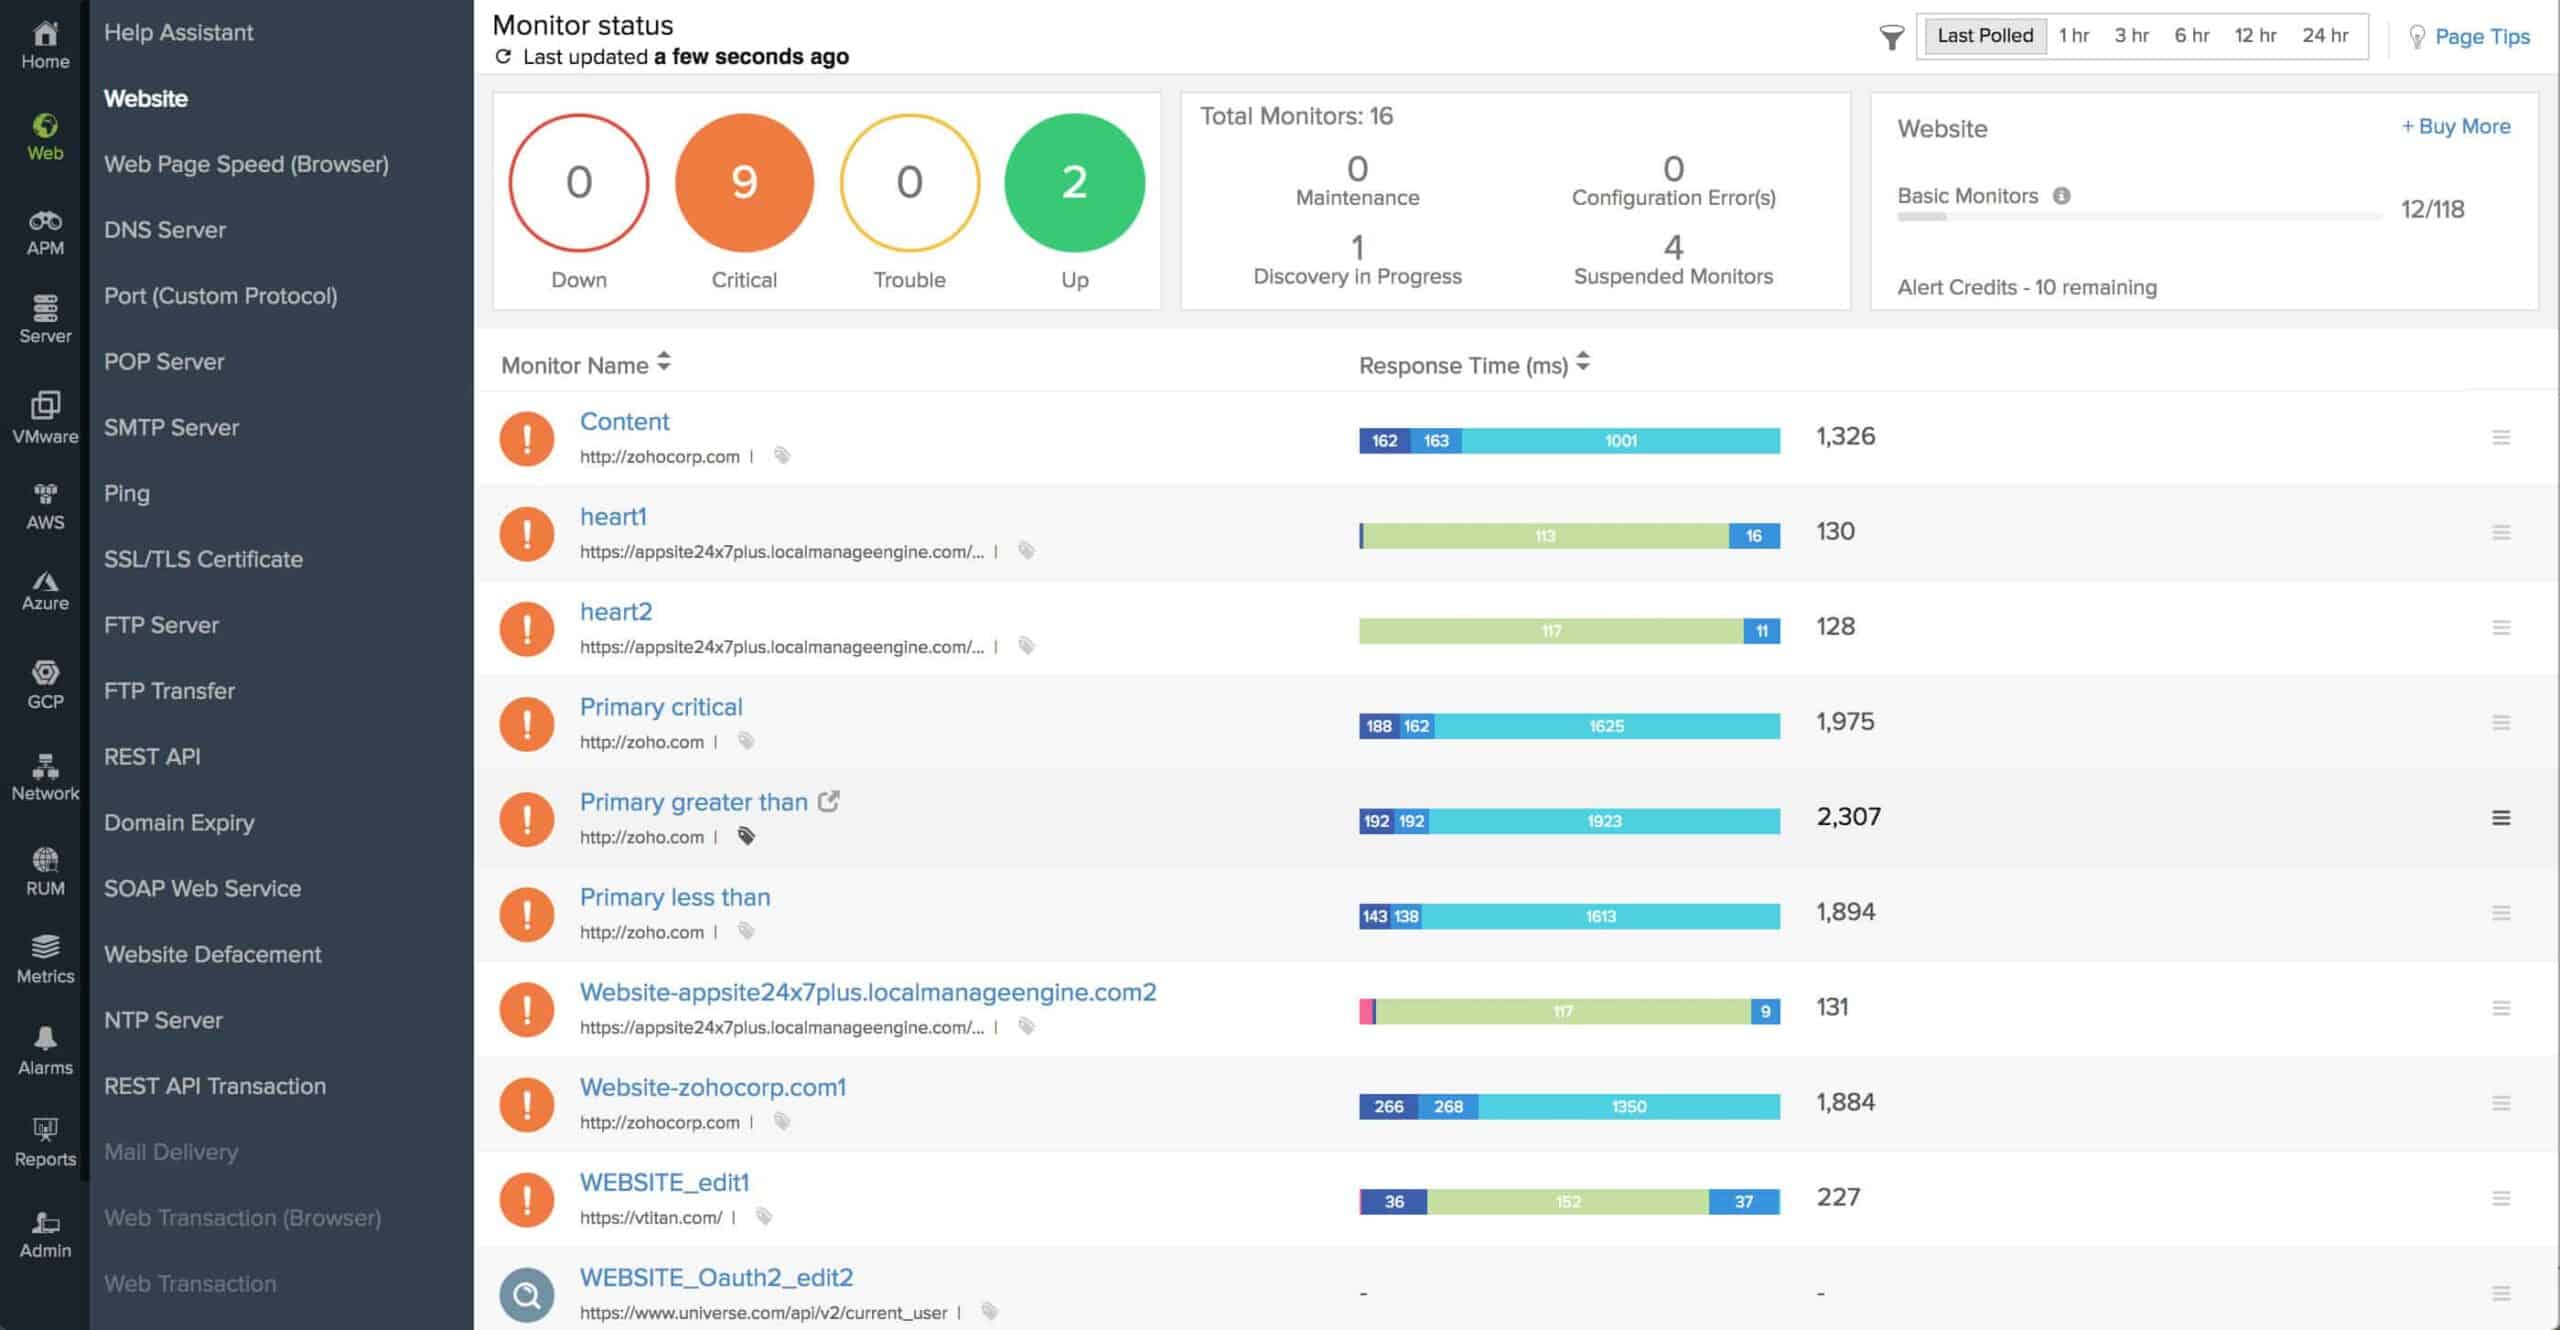
The Site24x7 Network Monitoring system is part of a package of system monitors that are offered on a cloud platform. The service includes a network device performance monitor, that checks on the statuses of routers, switches, and hardware firewalls.
Key Features:
- Comprehensive Network Visibility: You can have a complete view of your network to monitor the health and performance of devices, servers, and applications in one centralized platform.
- Real-time Alerts: It gives instant notifications when issues arise to solve the problems quickly.
- Customizable Dashboards: It allows creating personalized dashboards tailored to your preferences to access specific information.
- Remote Monitoring: You can monitor your network from anywhere and manage insights efficiently.
Why do we recommend it?
We recommend Site24x7 Network Monitoring for its versatile support of devices from various vendors like Cisco, Juniper, and D-Link. It monitors critical performance attributes, analyzes VPN performance, and provides detailed router monitoring; hence, you can easily resolve issues with accurate data on network activities and traffic sources. Interface-level availability and performance are efficiently tracked with this tool.
The Site24x7 system uses the Simple Network Management Protocol to request status reports from device agents at regular intervals. The responses to the broadcasted request enable the Site24x7 system to compile an asset inventory and network topology map.
Who is it recommended for?
Site24x7 Network Monitoring is recommended for network administrators and IT professionals. Experts use this tool to identify unusual behaviors and analyze problematic routers through root cause analysis to take correct actions at the right time. It enables monitoring of individual port traffic and tracking traffic sources for SNMP devices to identify and address suspicious activities.
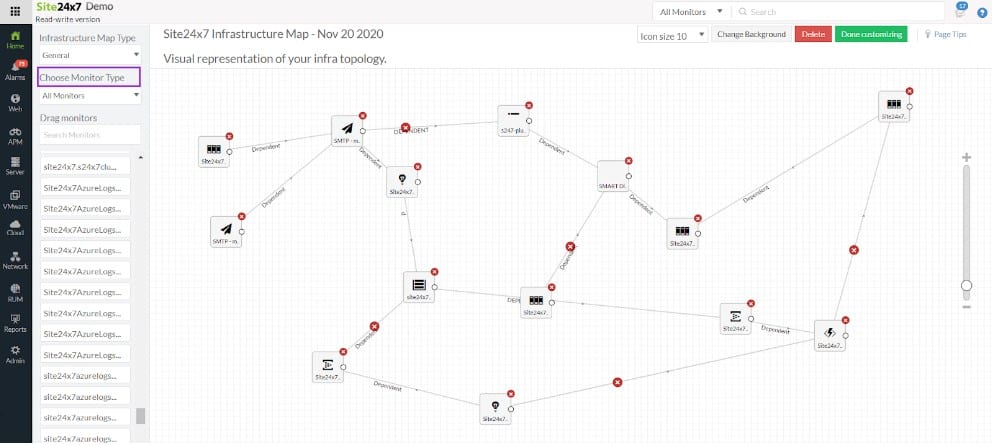
Click on any device in the map or the inventory to get live status reports. The tool can tell you details about the CPU and interface activities of each router and switch. You will also be able to see what components are in trouble, which could tell you to take action to route traffic around that device.
Extra Features:
As well as monitoring network devices, the Site24x7 Network Monitoring service provides bandwidth analysis. You will be able to see traffic volumes around the network and the bandwidth of each link. Test a path through the network end-to-end or use the system to spot traffic bottlenecks.
The Network Monitor is bundled in with other monitoring tools in subscription packages. These provide server, application, and Web asset monitoring as well.
Implementation and System Requirements:
As it is hosted in the cloud, you don’t need to download software onto your site. So, there are no hardware requirements for the Site24x7 system. To get started, you sign up for a 30-day free trial at the Site24x7 website. This gets you immediate access to the monitoring dashboard, which will download an agent onto one of the endpoints on your network.
Pros:
- Access the system through any standard dashboard – no need to host
- Get constant updates on router and switch statuses
- Notification when device issues arise
Cons:
- Doesn’t include system management functions
Site24x7 offers four editions and all of them include router monitoring. They are:
- Website Monitoring – Starting at $9 per month
- Infrastructure Monitoring – Starting at $9 per month
- Application Performance Monitor – Starting at $35 per month
- All-in-one – Starting at $35 per month
- MSP – Starting at $35 per month
Use the Site24x7 system for free for 30 days.
5. Nagios Router Monitoring
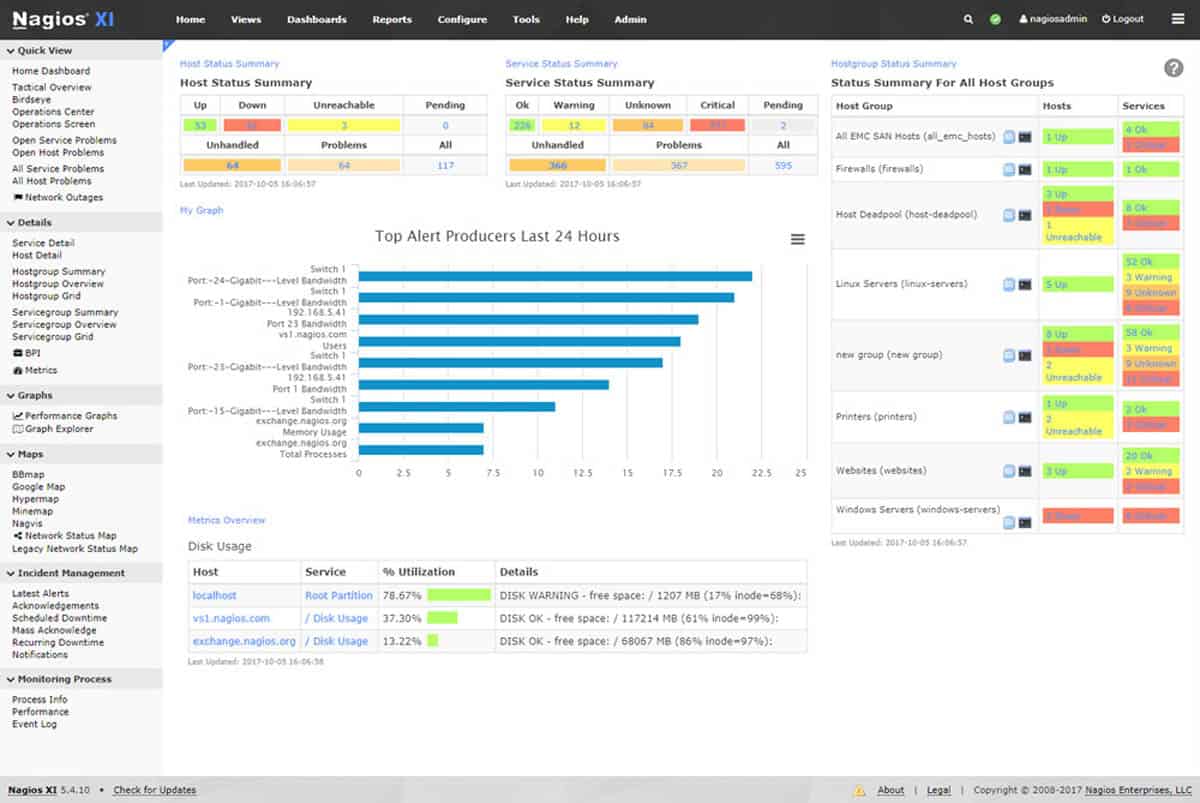
Nagios monitors the status of routers and network switches. Nagios will help you keep your devices under control by sending pings and SNMP replies. With a connection established, Nagios can:
- Monitor packet loss.
- SNMP status information.
- Bandwidth and traffic rate.
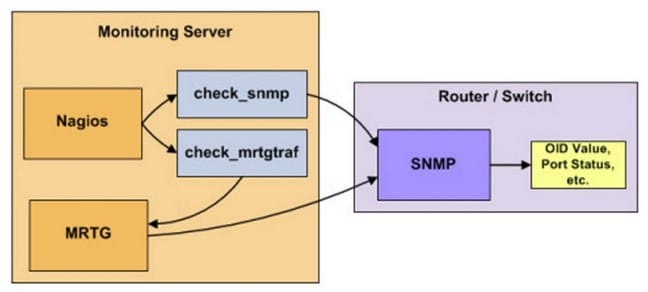
When the switch supports SNMP, Nagios is able to monitor the status of ports, so you don’t rely on IP. This is how Nagios will monitor your devices using SNMP.
Key Features:
- Extensive Plugin Support: It supports a wide range of plugins to monitor diverse devices, applications, and services.
- Role-based Access Control: You can secure your monitoring environment by assigning specific roles and permissions to different users.
- Graphical Reporting: It offers graphical reports for a visual representation of your network's health to understand and interpret complex data.
Why do we recommend it?
Nagios XI helps in tracking specific subsets of network flow information and maintains comprehensive historical data. It makes data management much easier by allowing users to monitor, manage, visualize, archive, analyze, and set alerts for all logs. This is your go-to tool if you want proactive network monitoring and troubleshooting.
Aside from monitoring your traffic going through your routers and switches, Nagios can also monitor their systems, protocols, applications, databases, logs, and bandwidth.
Nagios needs a quick configuration by editing the main Nagios config file and then creating some object definitions. For more details go into the Nagios website.
Who is it recommended for?
Nagios XI is recommended for IT professionals and teams seeking advanced user management capabilities. It is the best tool because of its advanced user options. You can easily collaborate among IT teams to work within the network. It is especially beneficial for experts engaged in intricate network management tasks and operational efficiency.
Pros:
- Is open-source and completely free, with a paid option for enterprises
- Supports autodiscovery for easy device management
- Highly customizable and detailed dashboard
Cons:
- Network mapping visualizations need improvement
- Not nearly as comprehensive as some of our top choices
- Must pay extra for support
Nagios has four pricing options, depending on your needs:
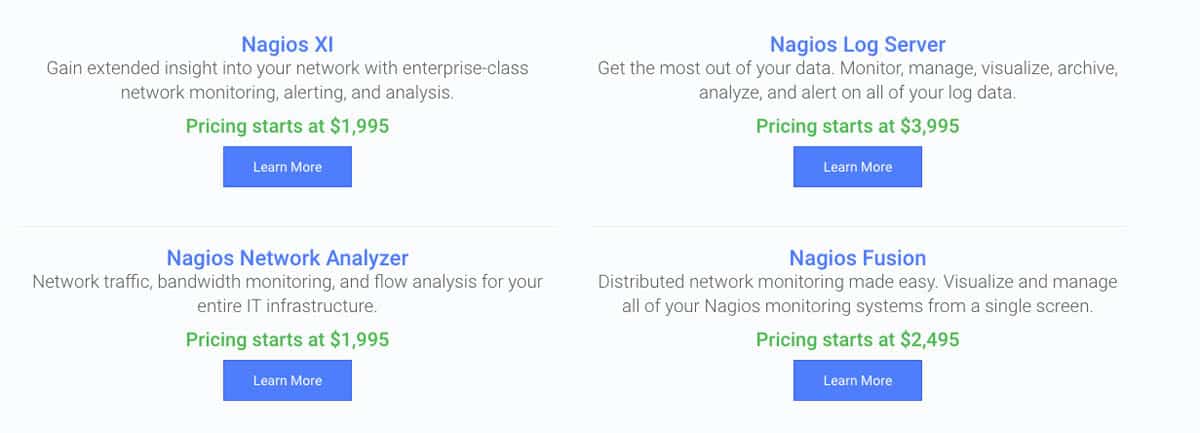
You can get a free download for three of the above options:
6. Zenoss Cisco Monitor ZenPack
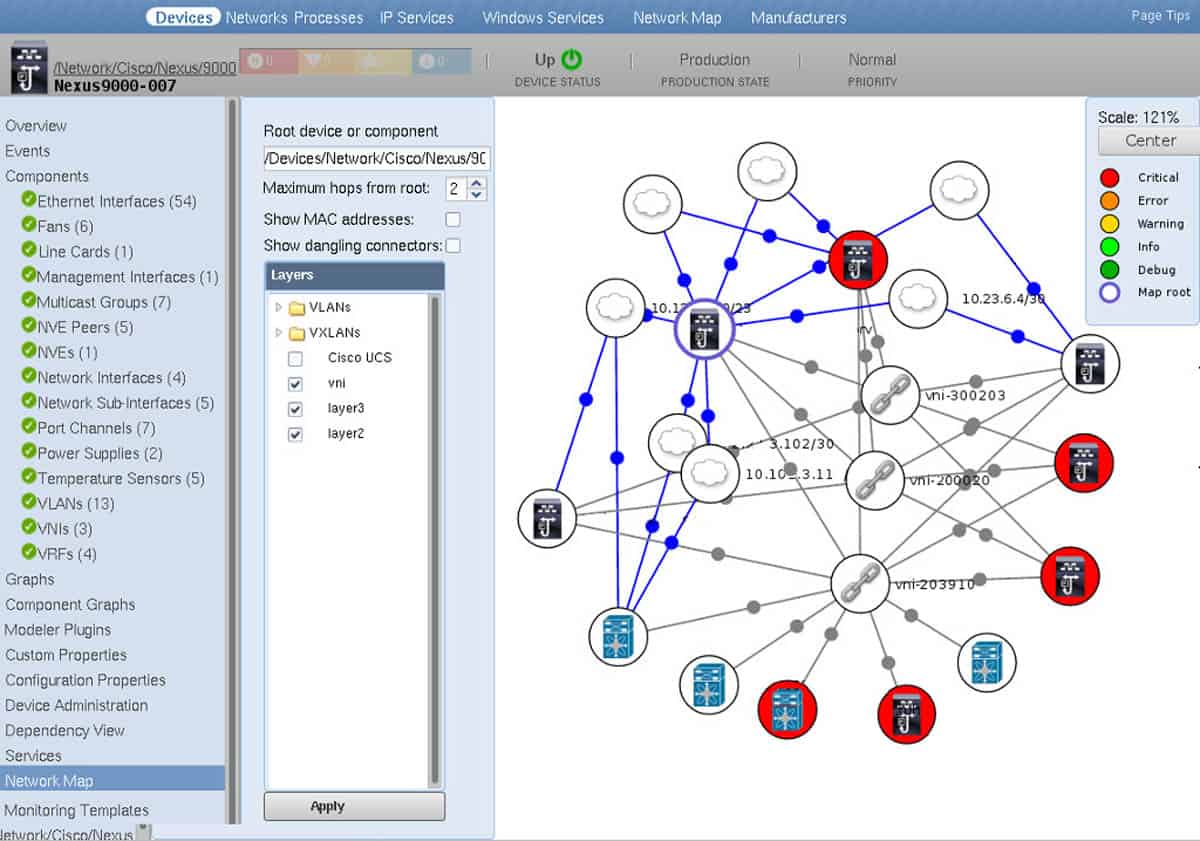
The Zenoss solution ZenPack for Cisco Monitoring provides performance monitoring and health checks for Cisco Layer 2, 3, and 4 devices, including virtual firewalls, virtual load balancers and vLANs. This tool collects events using syslog and SNMP traps. The solution support must Cisco devices, from ASA, ASR Catalyst, Nexus series.
Key Features:
- Scalable Infrastructure Monitoring: It fits both small businesses and large enterprises for monitoring a variety of infrastructures.
- Unified Monitoring Platform: As it is a centralized platform, you can monitor diverse elements such as devices, databases, applications, and cloud services.
- Intelligent IT Operations Management: As a SaaS-based solution, it helps in intelligent IT operations management by streaming and normalizing machine data.
- CiscoMonitor ZenPack: It allows monitoring of Cisco devices like switches, routers, and virtual resources, ensuring comprehensive visibility and control.
Why do we recommend it?
Experts love Zenoss because it comes with the CiscoMonitor ZenPack, which helps keep an eye on the health and performance of various Cisco devices like switches and routers. Other than this, it even monitors virtual stuff like firewalls and load balancers to ensure a thorough check on your network's well-being.
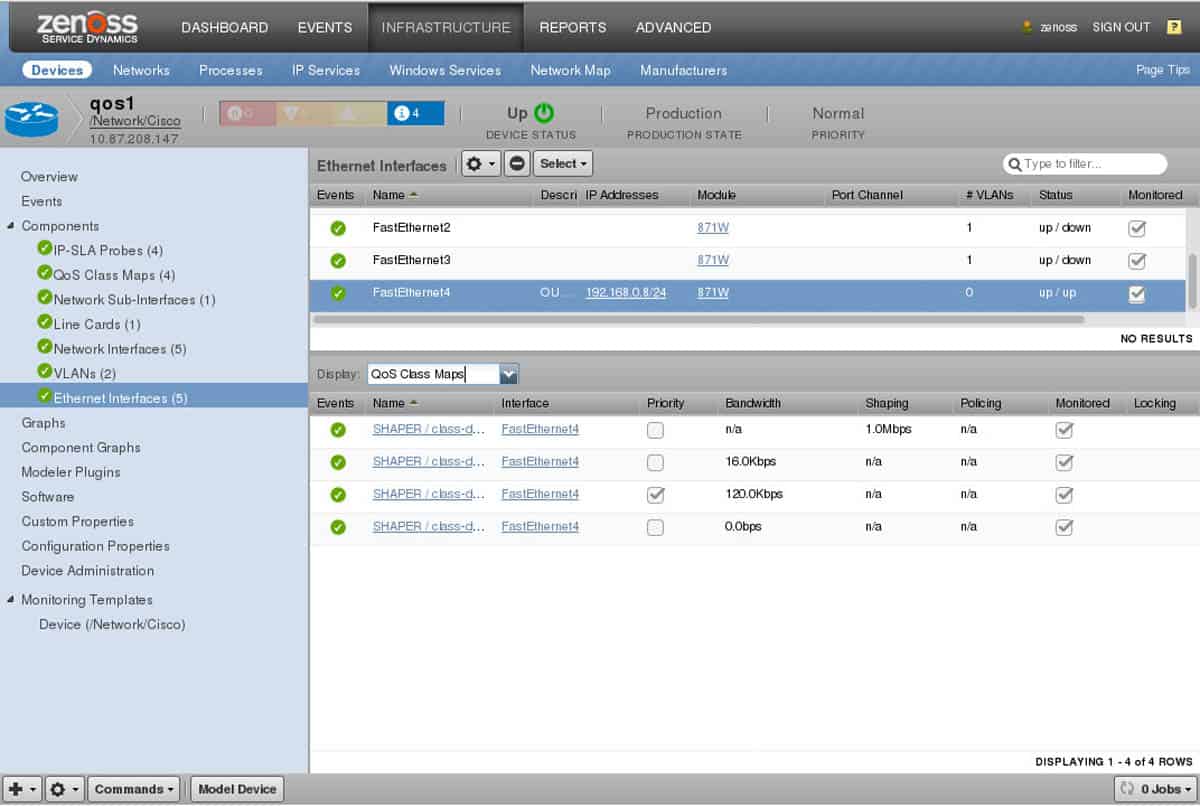
Its comprehensive auto-discovery feature, allows easy and fast discovery of a router’s characteristics such as physical parameters (fans, chassis, power, voltage, temperature, fiber channel interfaces, modules, line cards) and also logical parameters, such as interfaces, port channels, QoS, VLANs, and VRFs.
Who is it recommended for?
IT experts and teams focused on intelligent IT operations management widely use this tool. It's a SaaS-based platform that normalizes machine data; hence, it is easy to understand the insights and address complex issues in modern IT environments.
Zenoss models QoS class maps with network interfaces using the SNMP MIB (Management Information Base). You can search all modeled QoS class maps for each device.
Pros:
- Open-source, completely free tool with two paid options
- Uses network discovery to automatically pull in new devices that enter the network
- Supports Cisco Layer 2-4 devices
Cons:
- Support only for paid tiers
- Dashboard interface needs improvement, specifically the nested menu options on the home screen
Zenoss price should be requested, there are two options for Zenoss:
- Professional: For smaller, simpler environments with Limited data and Basic support.
- Enterprise: For larger, dynamic environments with Large-scale data and Premium support.
7. WhatsUp Gold Network Traffic Monitor
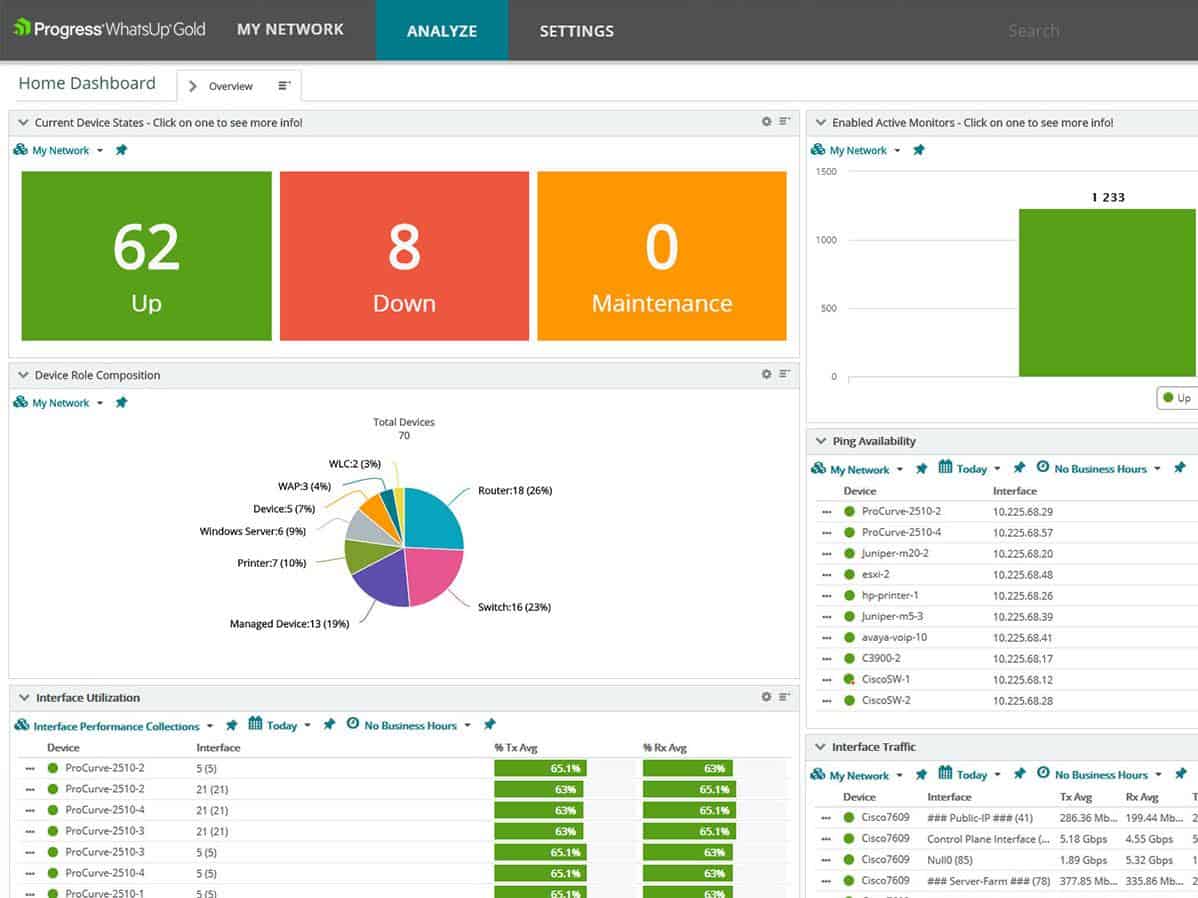
WhatsUp Gold Network Traffic Monitor is a network traffic and bandwidth analyzer. It will help you get a broad view of the traffic into your network, and see who are the top consumers, whether is a user, an application or a protocol. With this information in hand you can configure bandwidth usage policies and make sure that bandwidth is evenly distributed.
Key Features:
- Bandwidth Usage Tracking: You can monitor and analyze the usage of your network's bandwidth to find the bottlenecks or unauthorized heavy usage.
- Dark Web and Suspicious Site Detection: It can detect and report on traffic to and from the dark web or other suspicious sites to take security measures instantly.
- Customizable Alerts: You can set up alerts tailored to your preferences to get notified promptly when any issues or unusual activities are detected.
Why do we recommend it?
We recommend WhatsUp Gold because it gathers info on network traffic and bandwidth use from any device. It helps track down unauthorized heavy users, like those streaming or gaming and can detect/report traffic to suspicious places like the dark web. It's a handy tool for keeping your network secure and efficient.
WhatsUp Gold Network Traffic Monitor is one of the best ways to avoid failures due to increased bandwidth usage.
Other Features:
- Network Traffic Visibility. Allows you deep insight into bandwidth consumption in order to provide a better performance to your infrastructure.
- Faster Troubleshooting. Knowing bandwidth consumption in detail helps to identify the source of a problem so you can provide a solution ahead.
- Find backups or file transfers running during peak load periods. So you can avoid overloaded bandwidth and bottlenecks.
- Track bandwidth high consumers like video streaming or gaming.
- Reprioritized authorized activities that consume a uneven share of bandwidth.
- Reporting features. Reports that show who is using the most bandwidth (top consumers), for gaming, streaming, video-conferencing, etc.
Who is it recommended for?
WhatsUp Gold is recommended for IT experts and teams who focus on bandwidth usage across networks, servers, and applications. It's a perfect tool if you want to identify backups or file transfers happening during peak load periods, offering valuable insights for efficient network management and performance optimization.
WhatsUp Gold will run on Windows 7, 8.1, and 10. It requires Windows Server 2008 (32 and 64-bit), 2008 R2 (64-bit), 2012 (64-bit), and 2012 R2 (64-bit) and Windows 2016.
Pros:
- Uses simple visualizations to help provide at-a-glance insights
- Supports modular pricing, allowing companies to pay only for features they intend to use
- Offers router monitoring alongside bandwidth management capabilities
Cons:
- Modular upgrades might not be a good fit if you intend on utilizing all aspects of a networking monitor
Download a free trial. The price starts at $2,656 for up to 25 devices. For more information check WhatsUp Gold Official license information site.
8. Icinga
Icinga is an open-source infrastructure and service monitoring tool to monitor your network, servers, and applications. The tool is easy to use and comes with pre-configured templates and plugins. Icinga can be configured in the most popular Linux distros, such as Ubuntu, SUSE, Debian, and Red Hat (Fedora and CentOS).
Key Features:
- Scalability: It is highly scalable, so it can quickly adapt to different needs, making it suitable for both small setups and large, complex infrastructures.
- Secure Monitoring: SSL-encrypted connections provide a safe environment for monitoring sensitive information across your network.
- Customizable Monitoring: You can monitor a wide array of devices, databases, applications, and more suitable to organization needs.
Why do we recommend it?
We recommend Icinga because it suits everyone, from small start-ups to big businesses. It easily adapts to any infrastructure. Moreover, you can also divide monitoring into separate zones for different teams or customers. Plus, it's customizable to monitor a wide range of things like devices, databases, applications, cloud services, websites, and networks.
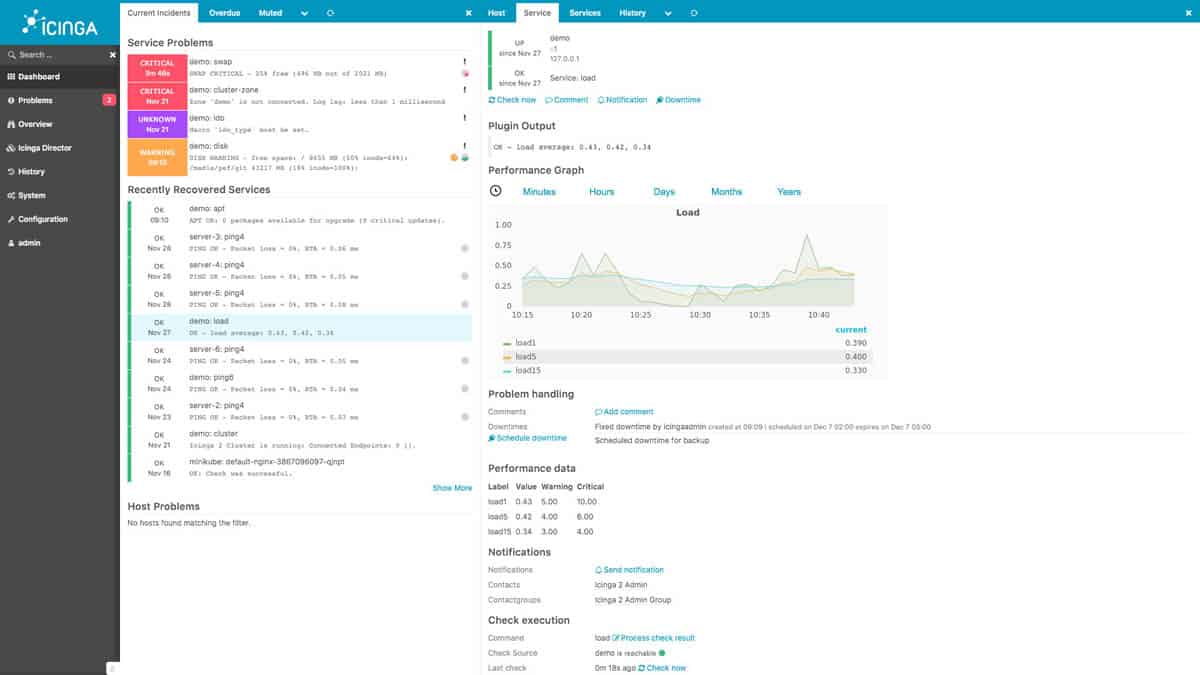
Icinga is a great tool to monitor the status of your network devices, such as routers or switches. It can discover them either through pings or SNMP reply. Once discovered, the tool can quickly find parameters such as packet loss and bandwidth.
Who is it recommended for?
Icinga is recommended for security-conscious IT experts and teams. Its secure monitoring system relies on SSL-encrypted connections, ensuring data protection. The tool allows granular control by offering role-based access control, allowing permissions to be granted selectively to different teams and members, enhancing overall security measures.
Other Features:
- Web Interface: Analyze problems from the web interface anywhere and from any device.
- Flexibility: Write your own extension or choose from existing supported modules.
- Integrations: Integrate Inciga with your favorite workflows and tools.
- Cloud: Get a fully pre-configured monitoring stack from the cloud.
Implementation and System Requirements:
Icinga needs a quick configuration by editing the main Icinga config file, and then creating some object definitions. Although Icinga does not publish specific hardware requirements, the software can run pretty good on a quad-core processor with 4GB RAM
Pros:
- Transparent and open-source tool
- Can be configured via GUI or DSL, making it a good choice for admins who enjoy CLI tools
- Supports built-in visual reporting
- Modules allow for different functionality, keeping the base installation sleek and lightweight
- Can run on Linux as well as Windows operating systems
Cons:
- Reliant upon the open-source community for support and updates
- Designed for more technical users, other options have better out-of-box features
Icinga is Free and Open Source.
Conclusion
All of the above software is specially designed for the different requirements of your networking equipment. Some are specific to monitor routers, firewalls, switches, etc. All of them offer great advantages to help your IT manager, making his life easier and allowing him to focus on other important day-to-day matters.
We suggest you Download a Couple of the Top Router and Switch Monitoring tools from Above to get a Feel for how they work in your Infrastructure and Environment before making a Decision – As they have different features and capabilities that differ from each other.
* We'll Be continually Updating this List as more software becomes available *
Router monitoring FAQs
How do you monitor a router?
You can monitor a router directly by connecting to it over the internet and accessing its management control panel. The exact range of information shown in this console and the menu location of performance data depends on your router’s make and model. The easiest way to monitor router health and performance is to use a network monitoring tool.
Can you monitor Internet traffic through a router?
All router types will give information on Internet traffic. If the router is being used as a gateway, it is only necessary to query the traffic statistics of one interface in order to get Internet traffic data. If the router is placed within the network, you should query traffic by source and destination IP address and aggregate data related to those packets that have addresses from outside the network.
How can I monitor free traffic on my router?
Traffic space that is still free and available for use can be calculated by accessing the capacity data for your router per interface and also the full CPU c\apacity of the device. Next, watch the live throughput statistics. The gap between current throughput and the device’s capacity is free for processing extra traffic.

