
Our funding comes from our readers, and we may earn a commission if you make a purchase through the links on our website.
Riemann Beginner’s Guide

UPDATED: April 26, 2023
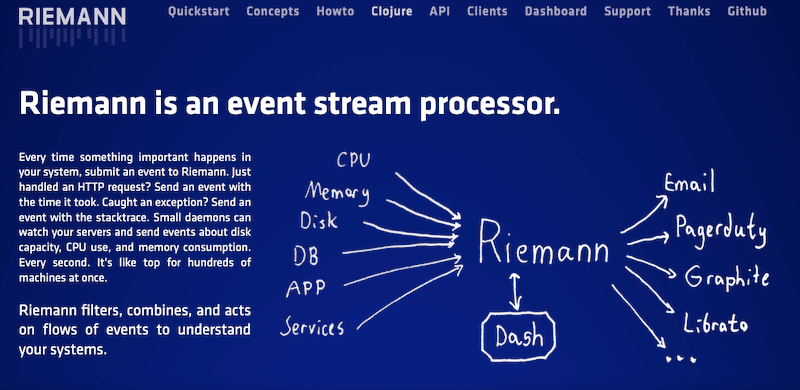
Riemann is, in three words: “An event aggregator”. — Anytime there is an event in your system or application, Riemann will collect this event (using clients) and immediately submit it to a Riemann server. This server will, in turn, filter, aggregate, and act upon all streams of events. Riemann uses a strong stream processing language written in Clojure to aggregate these events.
Using Riemann correctly as a part of your monitoring strategy can help you decrease business risk, plan for capacity, improve stability and reliability and comply with SLAs.
In this Riemann beginner’s guide, we will go through all the basics of Riemann. You’ll learn how Riemann works under the hood, its integrations, and support. We will also go through its limitations and strengths. In the latter sections, you will learn how to install it and configure its clients, integrations, and dashboard.
Table of Contents
- What is Riemann?
- How does Riemann work under the hood?
- Riemann’s strengths and limitations:
- Riemann support.
- How does Riemann integrate with other tools?
- How to start with Riemann?
- Let’s install and configure a Riemann client.
- How to use the Riemann Dashboard.
1. What is Riemann?
Riemann is an open-source ‘event aggregator engine’ that collects and combines events from hosts, servers, and applications. It can then feed these aggregated events into a powerful stream-processing language. It uses this language to process unbounded sequences of data items (streams) and perform actions such as changing or summarizing data.
Riemann uses the traditional monitoring scheme; clients and the server. The Riemann clients work in the background (daemons), watching and pushing their events (including metrics like CPU, memory, etc.) to Riemann’s server, making them available and visible instantly. Riemann works with very low latencies to let network admins know when there is an outage and fix the problems faster.
Riemann can be integrated into your alerting systems. It can send alerts via chat, email, SMS, and other messaging platforms like Slack or PagerDuty. In addition, Riemann can also be integrated to send data to tools like Graphite (for graphing) or Librato Metrics (monitoring).
Interesting fact! The Riemann event stream processor was named after the popular mathematician Bernhard Riemann—for his mathematical analysis contribution. The Riemann tool can “also” perform several numerical analyses on the data that it collects.
Additional details
- What is the goal of Riemann? This event stream processor is intended to help in automatic monitoring, analytics, and alerting. It aims to measure as many events as possible and with the least effort.
- How is Riemann’s architecture? Riemann comprises three core parts: the clients, the server, and the dashboard.
- Who uses Riemann? According to Riemann’s developer: “I wrote Riemann for operations staff trying to keep a large, dynamic infrastructure running with unreliable but fault-tolerant components.” Riemann can also be used by network admins and engineers that need better ways to pinpoint performance bottlenecks and sources of errors.
- How is Riemann’s throughput? The throughput varies according to what the streams do with the events. But generally, having Riemman deployed on a commodity x86 hardware server would be able to handle up to millions of events per second at very low latencies.
- How much is Riemann? Riemann is free and open source. It is licensed under the terms of the Eclipse Public License – v 2.0.
2. How does Riemann work under the hood?
Riemann can be considered a streaming application because it continuously consumes input streams (events like CPU, memory, disk, etc.) and generates output streams (Graphite, Librato, Email, etc.) It uses a powerful stream processing language (Clojure-based function streams) to aggregate events received from servers and applications. Riemann accepts events with common fields, such as host, source, source type, or service.
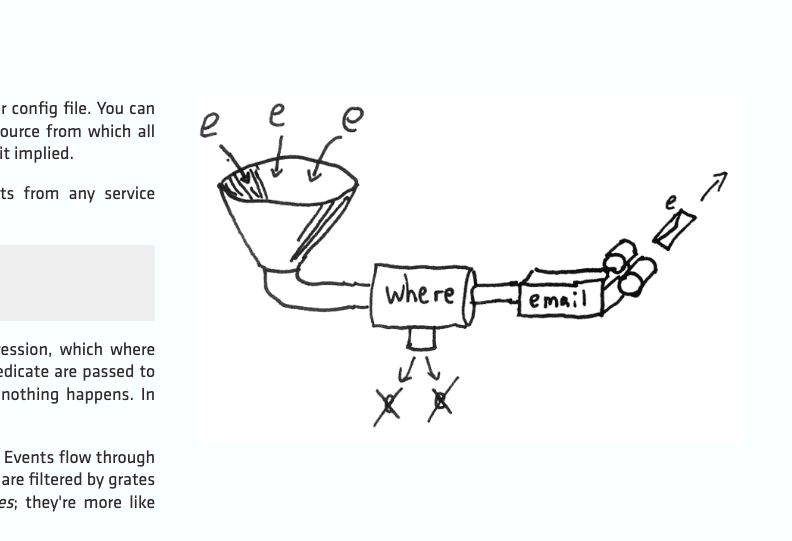
Riemann was developed in Clojure— a dynamic and functional dialect of Lisp that targets Java Virtual Machine (JVM). Riemann is configured through a Clojure-based config file, which is also directly processed as a Clojure program. The advantage of having Riemann’s configuration based on Clojure is that its syntax is brief and extendable. Configuring Riemann through code can be challenging in the beginning (for those learning Clojure), but in the end, it minimizes repeated sections of code and gives more flexibility.
So, to process events and metrics and send alerts, you’ll need to write and program in Clojure. Although you could use many different built-in streams to filter, aggregate events, and alert and only tweak their parameters; generally, you can also write your own.
3. Riemann’s strengths and limitations
Riemann is a pretty attractive monitoring solution for network and system admins with an edge on programming (as its configuration is via code). It can be configured to monitor systems and applications automatically. But for those network admins that are not familiar with programming, as learning Clojure requires investing time and money, it can be a challenging solution in the beginning.
Strengths:
- Riemann is known for monitoring code. You don’t need lots of plugins to integrate your distributed monitoring systems. With Riemann, you can simply write some code (in Clojure) and send it to your server.
- Riemann can be configured to take all events from hosts and applications. It comes with low-latency events processing monitoring engine. Riemann, configured on the proper hardware, could handle hundreds of thousands to millions of events per second.
- Use other languages to fine-tune your configuration. If Clojure is limited when tuning your Riemann configuration, you can use other programming languages such as Chef, Puppet, and Ansible to create a template of your configuration file.
- Riemann is extremely flexible. Since its configuration is code and the events “streams” are functions, Riemann is extremely flexible. In addition, Riemann uses an advanced and sophisticated stream processing DSL (Domain Specific Language) so that you can leverage its rich library of composable functions.
Limitations:
- There is a learning curve. You must pick up Clojure to understand Riemann. Although being written in Clojure is not a limitation but a strength, it presents some challenges for beginners. Although you don’t need to become a Clojure expert, you do (as a network admin) need to know the basics of the language. Learning Clojure to configure and optimize Riemann can be a time-consuming process initially.
- In Riemann, the configuration is code. The Riemann configuration is not a config file but an executable of Clojure code. For some operations staff, monitoring as code can be a limitation. And unfortunately, with stream processing engines like Riemann, the configuration will always be code.
- Riemann is not a replacement for a complete monitoring system. Riemann is simply an event aggregator— stream processing engine that inputs and outputs streams, and not a comprehensive monitoring solution. It is not a replacement for alerting systems or graphing mechanisms. Riemann can be paired with other solutions, such as Graphite and Librato.
4. Riemann support
Being open-source and free, Riemann does not offer any “dedicated customer support.” But still, you can get in touch with Riemann’s community through their support channels. You can communicate with Riemann’s community via their IRC (server: irc.libera.chat and channel: #riemann) or ask via their (riemann-users) mailing list. There are also other ways to contact them, via GitHub Riemann Issues or by mentioning @riemannio on Twitter.
Below is a screenshot of Riemann’s IRC. The IRC server and channel work, but they generally take a long time to answer (due to low membership).
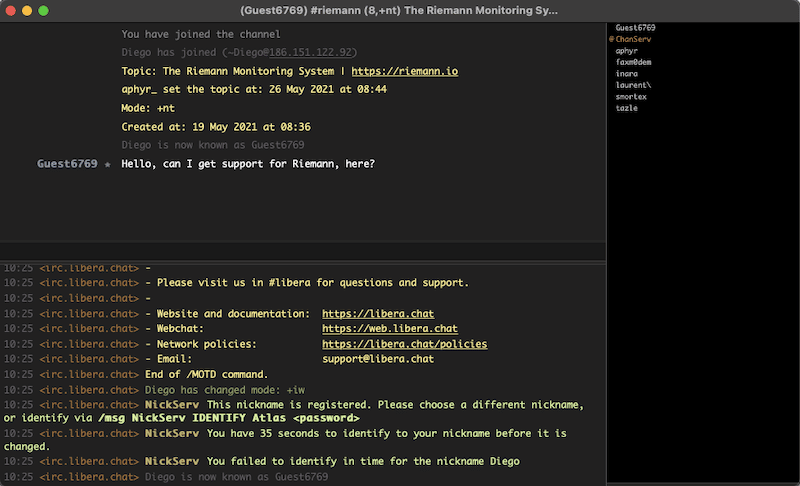
Riemann’s support is not the best, but they do have a very comprehensive knowledge base (wiki) and documentation on their site and GitHub.
5. How does Riemann integrate with other tools?
Again, Riemann is a pure event aggregator engine— it is not an entire network monitoring solution. It is simply one of the best tools for processing event streams. So, to monitor your systems and applications with Riemann, you would need to bring additional tools into your monitoring strategy.
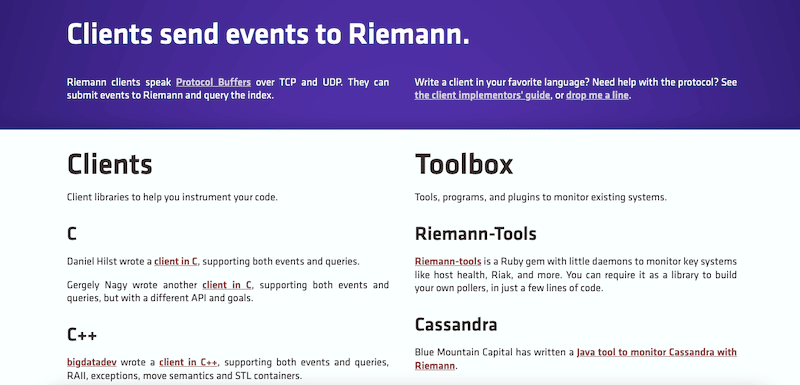
Riemann consists of various clients and plugins that can submit events to the Riemann server and query the index. In addition, to strengthen your monitoring strategy even more, Riemann allows full integration with other tools for notification, alerting, graphing, analysis, etc. Once Riemann collects events and processes and combines them, it can then forward to systems like Graphite, InfluxDB, or Elasticsearch or perform actions like sending emails or notifications to Slack or PagerDuty.
Riemann’s integrations fall into three different categories:
- Client libraries Riemann comes with client libraries to allow you to instrument your code. It includes code to help you monitor the performance of any application. Examples of Riemann client libraries are C, C++, C#, Python, Java, Lua, Go, Perl, Scala, Clojure, Ruby (which we will install later), and more.
- Plugins Riemann’s plugins are external libraries that provide added capabilities and functionalities. These include collectd, thresholds, cond-dt, discovery, and acknowledgment.
- Additional Tools These are additional programs and plugins that allow extended monitoring. These tools can be anything from Graphite, collectd, Cassandra, Chef, JMX, Logstash, MySQL, Nagios, Wireshark, Alerta, Librato Metrics, Syslog-ng, InfluxDB, Elasticsearch, Ruby-based Riemann-tools, and many more.
To get a complete list of Riemann clients, check Riemann’s official client list.
How to integrate Riemann with these tools?
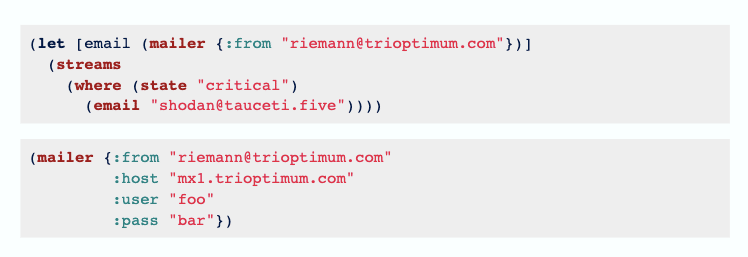
The integration process varies from tool to plugin to client. For instance, installing the Riemann client is a pretty straightforward process (we will show this process below). But if you want to integrate email into your server— to allow your Riemann server to send an email, you’ll need to configure the Clojure function: (riemann.email).
Riemann accepts events with common fields, such as host, source, source type, or service, through streams which are Clojure functions. An example of the function riemann.email that can send events via email is as shown in the screenshot below:
6. How to start with Riemann?
Although we could run Riemann on multiple nodes through network configuration, to keep this Riemann Beginner’s guide simple, we will run Riemann locally. Riemann is configured out-of-the-box to work on a local host.
To illustrate the Riemann installation process, we will use a Debian VM (deployed on the cloud) and install the TAR file. Note that we could also use DEB or RPM (for other Linux distros).
In addition, to installing Riemann, you’ll need to install some dependencies; these include:
- Java
- Ruby
a. Installing Riemann requirements
1. Install Java
Install Java on your system and make sure it is updated. For Debian or Ubuntu, use the following commands.
- Update the package repository.
$ sudo apt-get update - Check whether Java is already installed with:
$ java -version
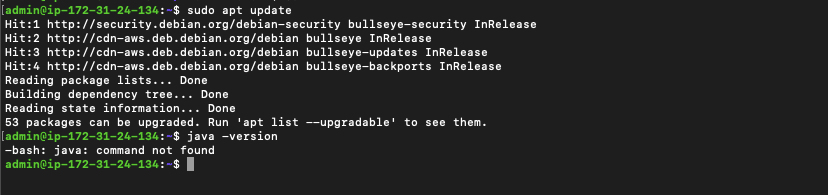
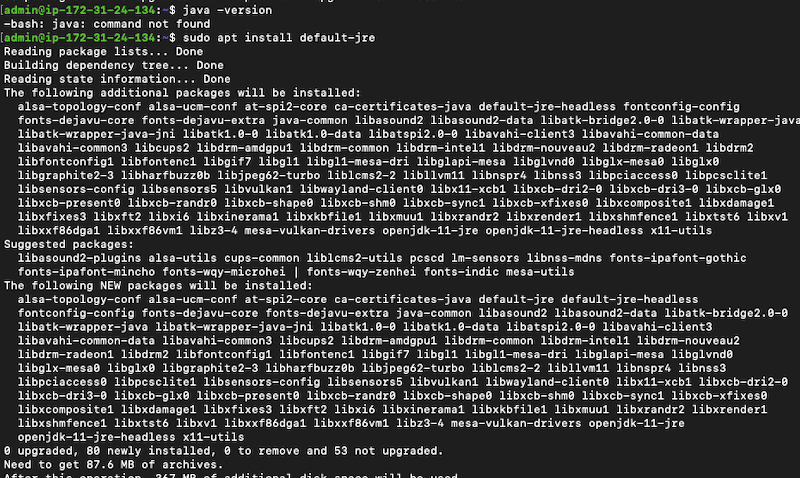
- If Java is not installed, use the following command:
$ sudo apt install default-jre
- Check whether Java was successfully installed with:
$ java -version
2. Install Ruby
You can install Ruby on Rails and also install Ruby Version Manager (RVM).
- Let’s first install Ruby’s dependencies with the following command:
$ sudo apt install apt-transport-https ca-certificates gnupg2 curl
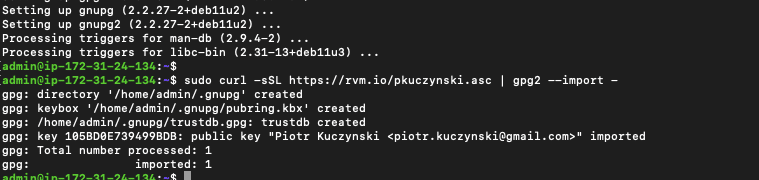
- Now let’s import the GPG key:
$ sudo curl -ssl https://rvm.io/pkuczynski.asc | gpg2 --import -
- Now, let’s install the latest stable version of Ruby. Use the following command:
$ curl -ssl https://get.rvm.io | bash -s stable --ruby
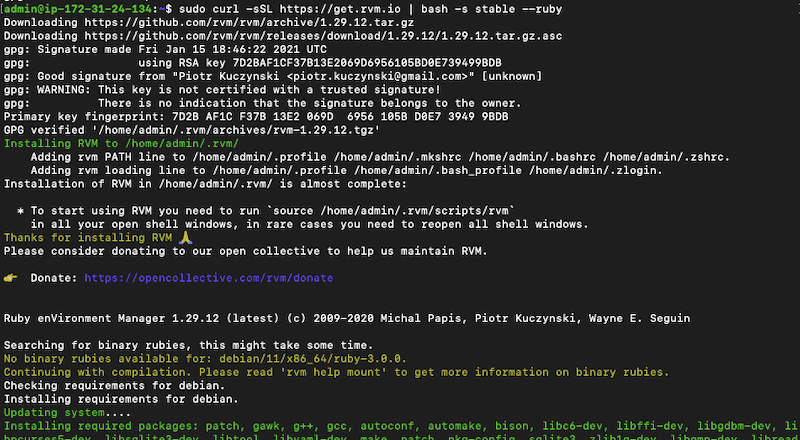
- To start using Ruby you would need to run the following command:
$ source /usr/local/rvm/scripts/rvm- or
$ source /home/admin/.rvm/scripts/rvm
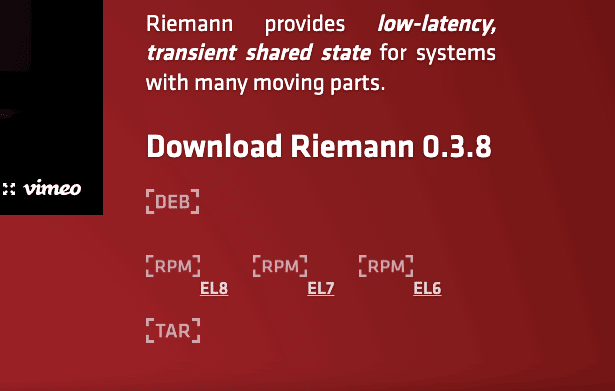
b. Downloading Riemann
Download Riemann 0.3.8 (the latest version as of Oct 2022) from the riemann.io website. As you can see from the screenshot below, Riemann can be installed through different packages, including DEB, RPM, and TAR.
c. Installing Riemann
- Update the package repository.
$ sudo apt-get update
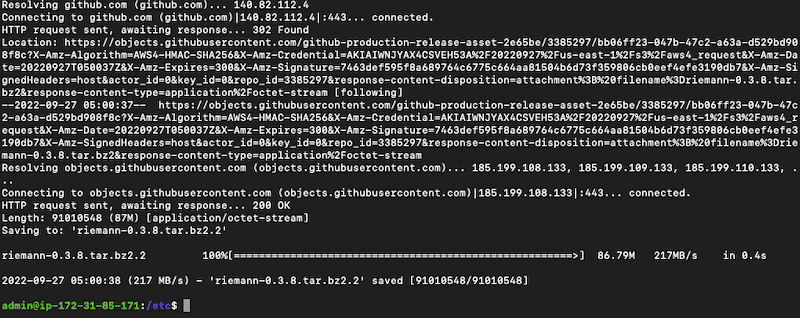
- Download the latest package (you can find the latest releases on Github). To download Riemann use the following command.
$ wget https://github.com/riemann/riemann/releases/download/0.3.8/riemann-0.3.8.tar.bz2
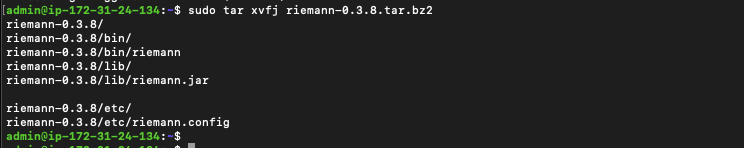
- Now, we’ll have to decompress the “riemann-0.3.8.tar.bz2” file that we just downloaded. For many different distributions of Linux, you can use bzip2. Run the following command.
$ tar xvfj riemann-0.3.8.tar.bz2
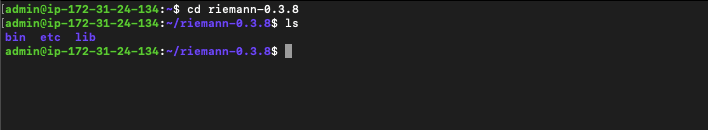
- Go into the directory where Riemann is installed
$ cd riemann-0.3.8
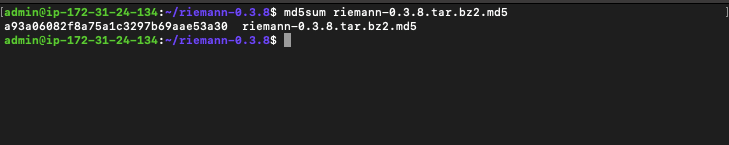
- You’ll need to verify the integrity of the Tarball file with the md5sum; use the following command:
$ wget https://github.com/riemann/riemann/releases/download/0.3.8/riemann-0.3.8.tar.bz2.md5$ md5sum riemann-0.3.8.tar.bz2.md5
- Now, let’s start the Riemann server with the following command:
$ bin/riemann etc/riemann.config
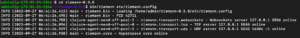
- Now, the server should start listening to events.
Note: There are other ways to install Riemann.
In the above example, we installed Riemann through a tar file, but you can also install it through the RPM and DEB packages. In addition, there are other modules for installing and managing Riemann. These include Puppet, Vagrant, and Chef.
7. Let’s install and configure a Riemann client
The Riemann clients can deliver events to the Riemann event system (or server) and also query the index. Riemann clients are configured through Clojure. An example of a simple client in Clojure:
- r = Riemann::Client.new
- r << {service: “www”, state: “down”, metric: 10000}
- r[‘state = “down”‘]
- # => [#<Riemann::Event @service=”www” … >]
Riemann clients communicate over TCP or UDP. They may use a UDP connection to send lightweight events and a TCP connection for queries and larger events. UDP connections are ‘unreliable’ but a lot faster than TCP. On the other hand, a TCP connection can be used when reliability is required, as they can tell if the server is down or there was an error.
Note: By default, all clients (including server and dashboard) listen to the loopback interface — the device itself with a loopback address of 127.0.0.1 or domain localhost. This means that initially, all Riemann components (clients, plugins, etc.) only listen to traffic on the internal host and not on external traffic across the network.
a. Let’s install the Ruby Riemann Client
We are going to install the Ruby Riemann client to be able to send states. As shown in the previous section, client libraries such as (Ruby client) help you instrument code so that you can monitor the performance of virtually any application. The Ruby client auto-retries connections and is safe from threads. It supports both TCP and UDP connections. It also provides utility classes to help manage the service state of a host.
Note: Bear in mind that you will need to have Ruby installed. Go back to the previous section if you haven’t installed this dependency.
You can download the Ruby client from its GitHub repository.
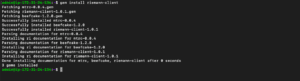
- To install the Ruby client, use the following command:
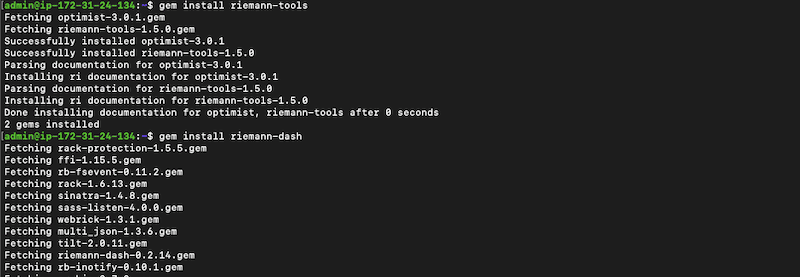
$ gem install riemann-client
- You also need to install the utility package and dashboard:
$ gem install riemann-dash$ gem install riemann-tools
- Use the following command to start the Riemann dashboard.
$ riemann-dash
b. Let’s use the Riemann client
You use the Riemann client to forward events to the Riemann server. You can use the riemann-health daemon to submit events to the Riemann server. These events include the server’s CPU, memory, load, and disks.
- Use the following command to start this daemon.
$ riemann-health
- Configure your client, including host, port, and timeout.
c = Riemann::Client.new host: 'localhost', port: 5555, timeout: 5
- Send a simple event to your Riemann server with the following line:
c << {service: 'testing', metric: 2.5}
- Use the << to send events. An example of a more complex event (an HTTP request):
c << {host: "www1",service: "http req",metric: 2.53,state: "critical",description: "Request took 2.53 seconds.",tags: ["http"]}
Now, the Riemann client will send these events to the dashboard and display them in different color codes and grids.
8. How to use the Riemann Dashboard
The Riemann dashboard (Riemann-dash) is a WebSockets-powered dashboard based on JavaScript. By default, when you open the dashboard, it connects the local host (your browser) to the local Riemann server’s WebSocket interface (you can change this connection to a remote server).
The dashboard will also show a manual and allow you to search the Riemann index using the simple query language. It will also show an update of events as soon as they appear.
- To install and start a dashboard, refer to the previous section.
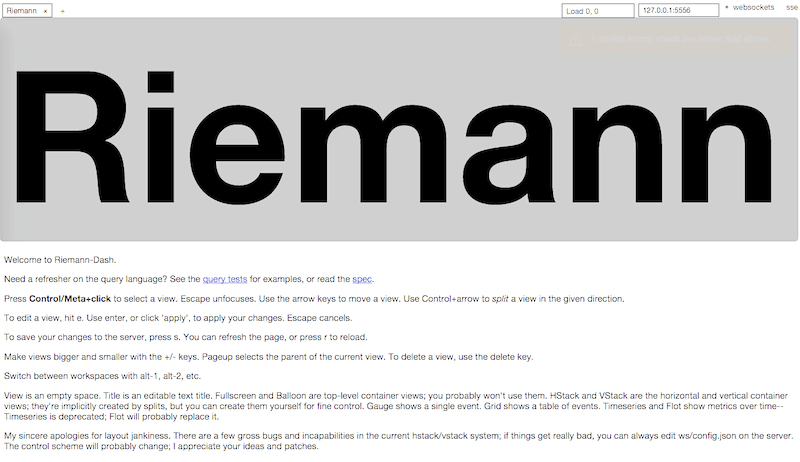
- Open Riemann-Dash (http://localhost:4567) through your local browser. As soon as Riemann opens, you’ll see big, bold letters and a simple Quick Start manual on how to start using the dashboard.
- As you learned, Riemann’s clients, server, and dashboard all listen to the loopback interface.
- If your server is not localhost, you can change the IP address from 127.0.0.1:5556 to the Riemann server’s IP in the top right of your dashboard. As you can see from the below screenshot, this is localhost (127.0.0.1:5556).
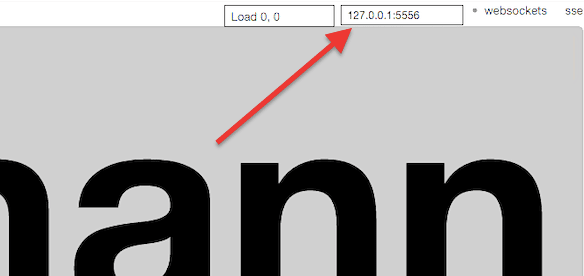
- If you change this IP address, the browser will immediately establish a WebSocket connection to this IP address and start displaying the events. The real-time WebSockets dashboard will show updated events as soon as they come.
- Below is an example of a fully populated Riemann dashboard, including graphs for three servers and their key metrics, such as TCP and UDP latency, core latency, and server throughput.
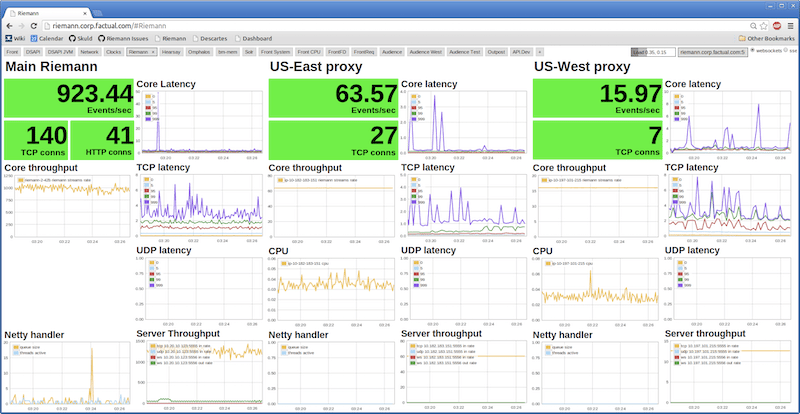
- Notice that in the top-right corner, the dashboard shows the current host that the browser is connected to. In this case: riemann.corp.factual.com:5556
- In the top-left corner, you’ll see a couple of tabs that show your Riemann workspaces.
- The Riemann dashboard also allows you to change the view styles between ‘title’ and ‘grid.’ It also provides a good level of interaction, as it lets you see the description of each event when you hover over it with the mouse pointer.
a. Dashboard troubleshooting
If you configured an IP address in the Riemann dashboard to open a WebSocket connection to the server, but it is not showing anything or displaying a connection alert error, check the following:
- If it is connected but not showing anything, it may simply have nothing to show.
- Ensure that you are using the correct IP address, host, and port
- Ensure that the server is up and running.
- Make sure that its WebSocket is reachable from the web browser.
- Check and ensure that the firewall is allowing the traffic to pass.

