
Our funding comes from our readers, and we may earn a commission if you make a purchase through the links on our website.
Network Device Monitoring Guide
UPDATED: February 5, 2024
Keeping a close eye on a network’s performance and availability is paramount. In most cases, it only takes a single faulty line or overloaded network device to significantly impact the entire network’s performance and cause service interruptions.
Network monitoring practices and tools can help network admins proactively identify issues before they cause major outages or, better yet, optimize networks, so they perform well.
In this network device monitoring guide, we will provide you with the foundations of network monitoring; What is it? What should you monitor? And how should you do it? At the end of the article, we’ll provide a short intro to network device monitoring tools along with some recommendations.
Without further ado, let’s get going!
What is Network Monitoring?
Network monitoring is one of the most critical processes within network management. In this process, network managers and admins keep track of the performance and availability of all networking devices, including routers, switches, load balancers, WiFi APs, and servers.
Network managers can use best networking monitoring practices, and tools to help them proactively (rather than reactively) find performance bottlenecks at their early stages and maintain network availability.
Although a network manager could use manual commands and utilities (such as ping, Syslog, traceroute, debug, and SNMP) to keep track of a network, in reality, networks can get so complex when they scale and become distributed. So it becomes nearly impossible to monitor every single vital metric of every network device in real-time with CLI commands. An efficient network monitoring system relies on the right tools, which help centralize the efforts and expand visibility. The network monitoring software detects the malfunction and quickly informs the network administrators so that they can take hands-on action.
What Needs to be Monitored?
When monitoring a network, there are various aspects that you must keep an eye on, including availability, performance, reliability, and security. Although all aspects are equally important, network availability (or uptime) should be the most crucial factor when monitoring a network. Without an available network, employees can’t work, customers can’t reach services, and even remote engineers can’t connect for troubleshooting.
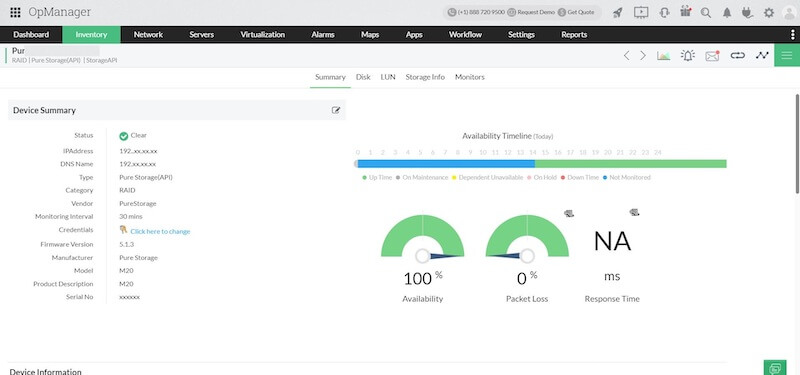
What is Network Availability? Network availability is the average uptime (in percentage) during which a network device performs its function. Network availability is always “proactively extracted” from real-time performance monitoring tools, allowing network admins to catch glimpses of network availability failures as they happen. Network availability is also reactively monitored and alerted when the network is down.
Below is a picture of ManageEngine’s OpManager keeping track of the availability timeline.
Other key network components that need to be monitored aside from availability are:
- Performance is not as evident as network availability, but monitoring it is almost equally important. Network performance is the analysis and summary of combined network statistics. It defines the quality of service of an underlying network. Network admins can achieve good network performance by monitoring vital network metrics like throughput, latency, bandwidth, errors, QoS, and wireless or hardware-based metrics such as CPU, disk, memory usage, temperature, fan speed, etc.
- Reliability is another vital component to monitor within a network. Reliability tracks how long a network device or infrastructure operates without interruptions. So a reliable network offers the same services even during a failure. An available network may still be unreliable (but not vice versa).
- Security Network security monitoring is usually placed in an area of its own. Monitoring network security efficiently and adequately is so different that it must be dealt with by its own principles and tools. Monitoring network security is beyond the scope of this guide.
Hierarchical Levels for Network Monitoring
A network admin can leverage important frameworks like the OSI model to improve network monitoring efficiency. The OSI model breaks down networking operations into different layers (7 layers) to standardize the critical functions of a network using protocols.
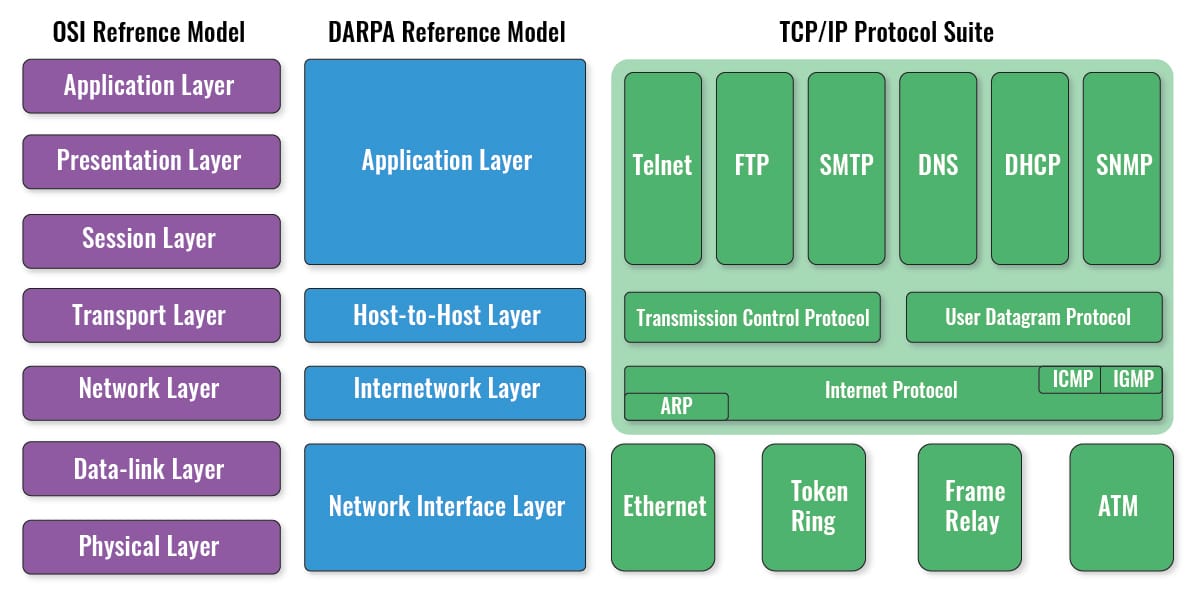
So, ideally, physical (layer 1) components, including hardware itself (temperature, fan speed, etc.), cables, interfaces, NICs, WiFi, etc., should be the most vital components for monitoring. When physical networking problems arise, these may quickly escalate into availability emergencies— a cable, NIC, or transceiver breaks. The next layer to monitor is the data link (layer 2), which includes physical addressing (MAC), Ethernet, Wireless Ethernet, serial links, and PPP. Monitoring layer two components ensure LANs, WLANs (WiFi), and WANs are available and performing well.
OSI’s Network (Layer 3) is the next level for monitoring. Layer 3 includes vital protocols, such as IP, ICMP, or IPSec. Usually, monitoring the network layer ensures network devices (local or remote) are available. OSI’s Transport (Layer 4), Session (Layer 5), and Presentation (Layer 6) are not commonly monitored (except layer 4 for security). OSI’s application (layer 7) is the last yet critical level for network monitoring. This layer includes all application protocols like HTTP, FTP, IRC, SSH, DNS, SNMP, WMI, etc. For instance, monitoring DNS or HTTP services can be critical for websites.
Discovery: The First Stage for Network Monitoring
The first step to monitoring a network is identifying the known (and unknown) networking devices and their performance metrics. Network discovery (or network inventorying) is the process that helps network managers get more visibility into their networks, especially when BYOD policies are established. The network discovery process creates a network inventory of all the network servers, workstations, routers, switches, Wireless Access points, mobiles, etc. Networking monitoring systems use the OSI layers 2, 3, and 7 to discover network devices and apps.
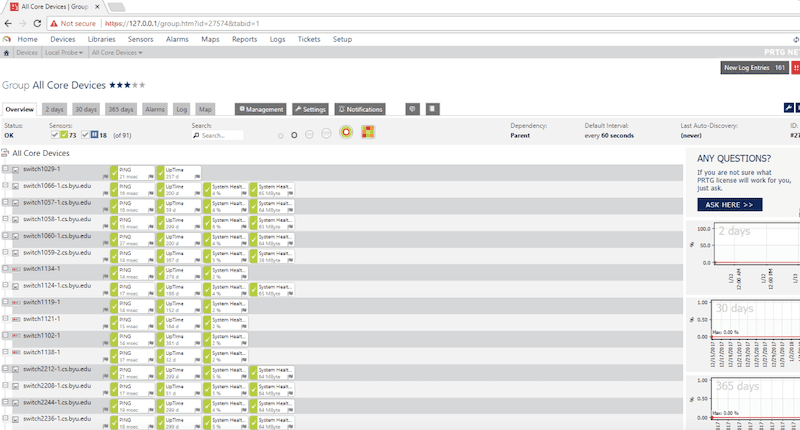
Network discovery can be achieved through simple “manual” network scans (ping sweep or port mapping) to the use of more comprehensive “auto-discovery” methods using fingerprinting and protocols like SNMP, WMI, or LLDP. Some network discovery methods won't require installing additional agent software to gather data at the endpoints; protocols like SNMP are widely supported. Other network discovery methods use software agents installed on the endpoints, which can help with network discoveries by quickly connecting with the monitoring server and sending (by push or pull) performance information.
Below is a picture of probing (discovery and inventorying) for local network devices with Paessler PRTG Network Monitor.
Some advanced network monitoring systems are also able to generate topology maps. They can automatically identify the interdependencies of networked devices and create a topology map that provides a higher level of network visibility.
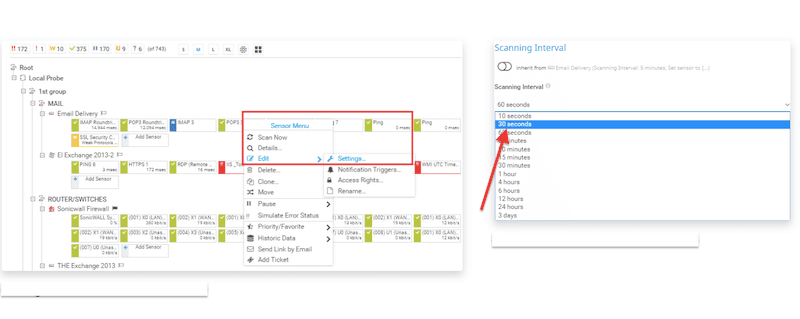
Configuring the Monitoring Intervals: Second Stage
With a network inventory of all the discovered and reachable devices (and optionally, a topology map), a network admin can start polling specific metrics. The polling time intervals for performance, availability, or reliability metrics depend according to which network device is being monitored. Bear in mind that watching too many metrics at too frequent time intervals may consume too many networking and computing resources.
For example, OSI layer one performance metrics like CPU, disk utilization, temperature, power supply, and fan speed in critical servers or routers would need to be monitored at short time intervals— for example, every five minutes. If layer one components are not working, then for sure, the rest won’t. Other performance metrics like latency or throughput can also be monitored, but generally at longer intervals.
Next, the availability status (OSI layer 2 or 3, like ICMP ping) of the same sensitive network device would have to be monitored at shorter time intervals (perhaps seconds). If the website is not reachable at layer 3, it is most likely down. Finally, monitoring OSI 7 layer networking applications and services, such as DNS, FTP, or HTTP, can be configured at longer time intervals.
Alerting and Notification
A monitoring system should use alerts and notifications to keep a network admin “proactively” informed when something is about to fail. However, the monitoring system may also leverage a real-time reactive alerting system to help respond quickly during emergencies. With a comprehensive alert system, the network admins have the necessary information about a failure and can act quickly as possible. Alerts can be sent via SMS, email, or even as PUSH (API-based) notification systems for mobile apps.
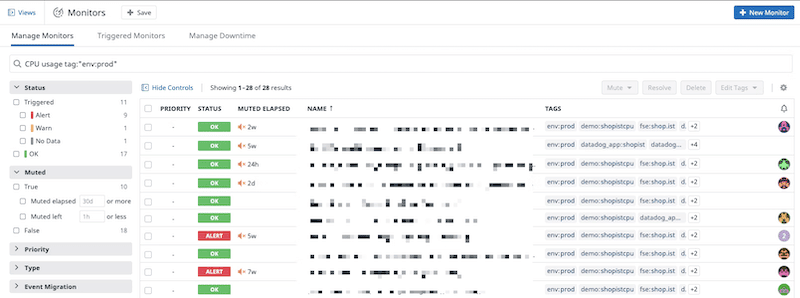
Alerts are usually triggered when a metric value exceeds (pre-defined or established) thresholds. For instance, a network monitoring system can be configured to detect excedent CPU utilization thresholds and trigger an alarm when a server's CPU utilization reaches above 85%. These threshold-based triggers can also be tied to conditions like time, which is useful when metrics scale up and down quickly (i.e., during peak and low hours). For instance, an alert only happens when the CPU utilization passes the 85% threshold for more than 20 minutes. This type of conditional alarm helps reduce alert fatigue and monitoring overloads.
Below is a picture of Datadog’s Monitor alerting system.
Reporting
Reports can be used to help companies keep a close eye on their network, increase productivity, help in decision-making, troubleshoot, and plan for capacity. Reports also help meet strict compliance, audits, or document Service Level Agreements (SLAs).
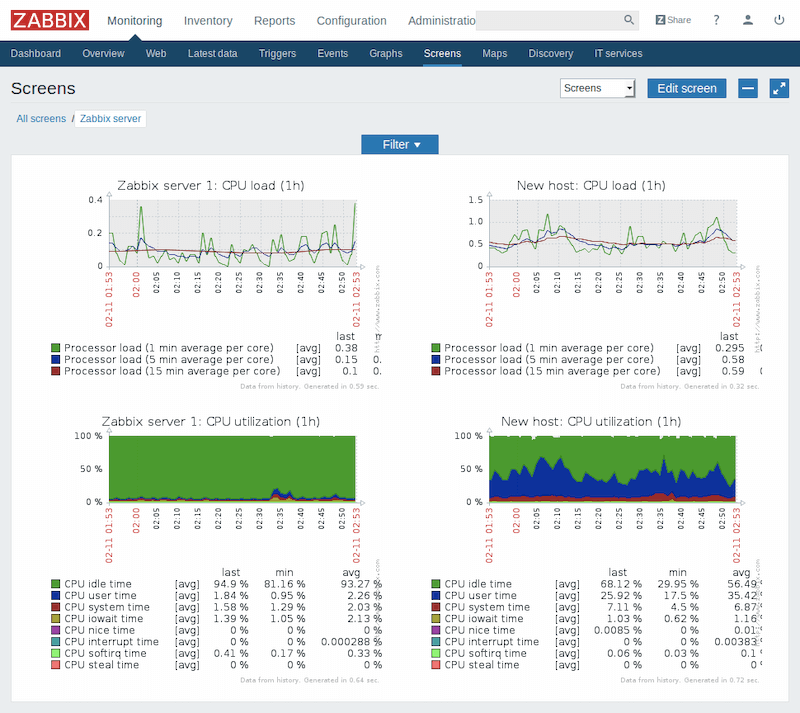
The majority of modern network monitoring tools come with reporting capabilities. They provide access to real-time and historical reports. These tools gather historical monitoring data and display it in out-of-the-box or customizable report templates or collect real-time data and display it on dashboards. A monitoring tool can help generate reports with a wide range of key performance parameters, from CPU utilization, bandwidth, and unresolved issues, to trends.
Below is a picture showing a report generated by the monitoring tool Zabbix.
Network Device Monitoring Tools
Network device monitoring always comes down to the tools. A good network device monitoring solution will help you proactively keep an eye on your network 24/7 and significantly reduce outages.
Network device monitoring tools differ in their capabilities. For instance, some tools are better at monitoring networking servers and services, while others are better for network devices. Some tools are Windows-based, others are Linux-based, some require an agent, and others are agentless. Some are free and open-source (supported by the community); others are paid, proprietary, and provide excellent customer support.
So, when trying to find out which network monitoring tools, you first need to define your requirements. What are you trying to monitor? What is your budget?
Below are some of the best recommended network device monitoring tools:
- Auvik – FREE TRIAL This SaaS platform, delivered from the cloud provides network discovery and automatic system documentation, including mapping. The package implements device status monitoring with the Simple Network Monitoring Protocol. It also implements network traffic analysis through NetFlow, sFlow, J-Flow, and IPFIX. Subscribers get a network configuration manager as well. Access a 14-day free trial.
- Paessler PRTG Network Monitor – FREE TRIAL One of the best and most popular network device monitoring tools. PRTG has a flexible approach to licensing based on the number of sensors. You can get to the product for free and monitor up to 100 sensors or expand its monitoring capabilities by buying more monitoring sensors. Download for free.
- Site24x7 – FREE TRIAL Offers a robust solution for network device monitoring, catering to the needs of modern IT infrastructures where constant vigilance over network devices is crucial. This tool distinguishes itself by providing detailed insights into the performance and health of a wide range of network devices, making it an excellent choice for organizations seeking comprehensive network monitoring capabilities. Start a 30-day free trial.
- Zabbix A one-of-a-kind enterprise-class open-source and free IT monitoring tool. Zabbix can virtually monitor anything, from network devices, containers, VMs, cloud, OS, databases, applications, services, IoT sensors, websites, and more. Download for free.
- Prometheus + Grafana Prometheus is an open-source monitoring system with a time-series database and powerful alerting. Grafana, on the other hand, is an open-source visualization software that helps understand complex data with metrics. Although Prometheus and Grafana belong to different developers, they integrate well, and when combined, the solution becomes one of the most powerful network device monitoring tools.
- OpManager from ManageEngine Network management and monitoring solution capable of monitoring/managing networks and servers, analyzing bandwidth, and managing configuration and faults. OpManager can be used in networks of all sizes and is affordable and easy to use. Download the free edition and monitor up to 3 Devices.
- Datadog Network Monitoring A cloud-based network monitoring system capable of discovering all connected network devices across your cloud, on-premises, or hybrid environments. Datadog creates an asset inventory and generates a network topology map. Try a 14-day free trial.
- WhatsUp Gold Network availability and performance monitoring solution that has been in the industry for a long time but has matured (and innovated) lately. WhatsUp Gold provides broad visibility into the performance and status of your network devices, servers, and applications deployed in the cloud or on-premises. Free trial available.
- LibreNMS A favorite open-source, free, and fully-featured network monitoring tool for Linux. LibreNMS provides an auto-discovery feature and uses SNMP to manage and monitor devices. The software also provides a customizable alerting system, a billing system to monitor bandwidth bills, automatic updates, and more. Download for free.
Network Device Monitoring Guide FAQs
What are some common features of network device monitoring tools?
- Real-time monitoring and reporting of network device status and performance
- Alerting and notification of critical events or performance issues
- Configuration management and tracking
- Historical data tracking and analysis
- Remote access and management
What are some popular network device monitoring tools?
- SolarWinds Network Performance Monitor
- PRTG Network Monitor
- Nagios XI
- ManageEngine OpManager
- Zabbix
What are some use cases for network device monitoring?
- Network infrastructure monitoring and management
- Security and threat detection
- Compliance reporting and tracking
- Performance tuning and optimization
How can I choose the right network device monitoring tool for my organization?
When choosing a network device monitoring tool, you should consider factors such as the features and functionality that are most important to your business, the ease of use and deployment, the level of customer support, and the pricing and licensing model. You may also want to evaluate the vendor's reputation and customer reviews.

