
Our funding comes from our readers, and we may earn a commission if you make a purchase through the links on our website.
NAT Lookup Tools & Software Verifying Network Address Translation
UPDATED: March 20, 2024
There are two reasons to use Network Address Translation (NAT); to improve security and maximize address space. Not to mention that it is quite common to see NAT deployed in many of today's networks. But sometimes NAT fails— and getting to the root of the problem can be quite tricky.
There could be some overlapping NAT policies, failed firewall translations, IP address issues that could be hard to troubleshoot, or a myriad of other issues. It can be hard to find the root of the problem without logging in to one of these NAT devices, like a firewall or router. And once inside, you will most likely have to sort through a long list of sessions— which only makes things more time-consuming.
In this post, we'll go through some popular NAT lookup tools.
A NAT lookup tool helps admins troubleshoot and keep NAT's records (sometimes without connecting to the device) by filtering, sorting, and providing other ways to simplify the output.
Here is our list of the best NAT Lookup Tools & Software:
- FortiView for FortiGate Firewalls – EDITOR’S CHOICE This data explorer is an add-on to the major Fortinet products and it partners with the FortiAnalyzer data examiner. Get a range of statistics from it, including NAT information.
- netstat-nat A Linux tool showing NATed connections via iptables or netfilters, useful for servers acting as routers or firewalls.
- Cisco’s IOS “show ip nat translation” A query command for network devices, offering NAT-specific options to display translation records.
- “pfctl” for OpenBSD PF Manages OpenBSD's firewall settings, configuring rules or fetching firewall status with robust command options.
- pfSense WebGUI A top free, open-source firewall/router, is a customized FreeBSD OS distribution for network device use.
- Juniper’s J-Web A web interface for Juniper's SRX Series Gateways, enabling monitoring, configuration, and troubleshooting via HTTPS, bypassing the JunOS CLI.
What does a NAT lookup Tool Do?
Traditional NAT requires a router (or firewall) with an interface pointing inbound to an internal network and another interface outbound to an external network (or Internet).
NAT also requires a set of rules that state how the address is to be translated.
NAT Requirements:
- Inside Interface
An inside interface configured with a “private” IP address. - Outside Interface
An interface pointing to an external network, like the Internet. The IP address is usually a public IP followed with a port number. - The NAT policy, rule, or ACL
This policy specifies the list of inside source addresses that will be translated to which outside address. These rules include a pool of global IPs.
When a user or service requests a new external IP (or public), the router or firewall facing the Internet creates a new NAT session.
These NAT sessions remain open so that the internal end-user can use the public-facing IP as long as necessary (or configured).
The NAT Lookup Tool
The NAT Lookup tool looks into the current translations and rules stored in NAT tables from routers/or firewalls.
They display as much information regarding NATed connections and policies and help sort or filter the results— this helps admins save time and effort significantly.
Retrieving NAT policies established to specific IPs, getting to know their type of NAT mapping (static, dynamic, overload, PAT), see their status, and source/destination translation— all from a single platform can be a real time-saver.
The Best NAT Lookup Tools & Software
Our methodology for selecting a NAT lookup tool
We reviewed the market for software that verifies network address translation and shows address mappings and we assessed the tools based on the following criteria:
- A service that gives you an ad-hoc query facility
- Software that will display the current address mapping continuously
- A tool to reset mappings or clear expired translation records
- A console that can be accessed across the network or the internet
- The ability to manage NAT settings from the viewer console
- Systems that integrate with the mechanisms that implement NAT
- A fair price that is affordable for its target market or a free tool
1. FortiView for FortiGate Firewalls
FortiView is the primary logging tool for FortiGate firewalls. It shows real-time and historical logs from different dashboards (applications, Wifi, websites, etc.). You can browse and filter through logs if you are looking for specific results.
Key Features:
- Part of FortiManager
- Partners with FortiAnalyzer
- Runs on Fortinet devices
- A service on AWS, Azure, and GCP
- Currently free to use
Why do we recommend it?
FortiView is an integrated part of the ForiGate, FortiCarrier, and FortiClient EMS systems. You can get this package as a service on AWS, GCP, and Azure along with FortiManager and FortiAnalyzer. You access the FortiView service through the FortiManager console but it won’t show you any statistics unless you active FortiAnalyzer.
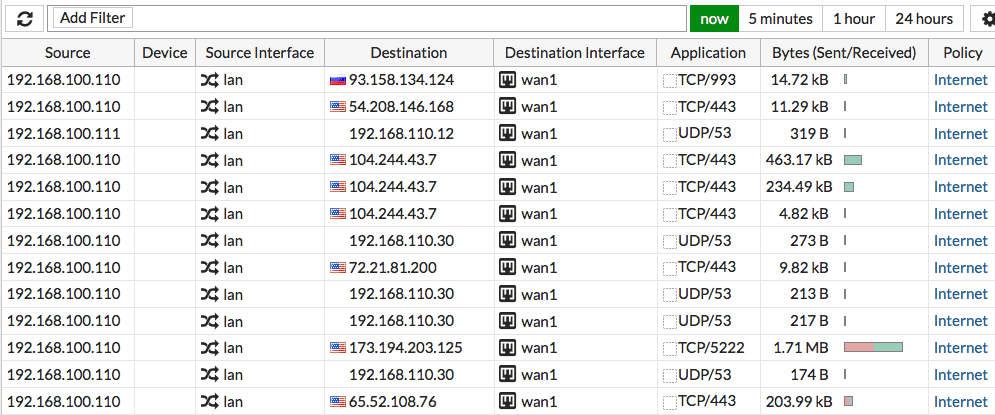
The FortiView lets you analyze the firewall sessions, which displays all current sessions since the application started. The output likely shows a very long list, especially for large networks.
You can create filters to browse through those firewall and NAT sessions and reduce the output.
You can filter through the following logs:
- Source or destination address
- NAT address or port
- Applications
- And more.
Who is it recommended for?
You can only use FortiView if you have a FortiGate, FortiClient, or FortiCarrier system. The tool displays data that FortiAnalyzer collects from those devices. So, if you don’t have any of those Fortinet systems, you can’t use FortiView. Fortinet used to charge for FortiManager and FortiView, but in 2021, the company dropped its charges. Although this gives you the tool for free, the offer is structured as a never-ending free trial.
Pros:
- Simple yet informative interface
- Can easily see and sort traffic and destination
- Can see historical logs
Cons:
- Can slow down on very large networks
Where to find it? FortiView is the FortiOS log tool for all FortiGate firewalls. It is, by default, enabled on all FortiGates running FortiOS version 5.2 or above.
EDITOR'S CHOICE
FortiView is our top pick for a NAT lookup tool because it links directly into FortiGate firewalls to extract current address translation statuses. The system is also available for FortiCarrier and FortiClient EMS devices. The tool can also be accessed through FortiGate Cloud and as a service on AWS, Azure, and GCP. This system is currently free for Fortinet product users.
OS: Cloud, network device
2. netstat-nat
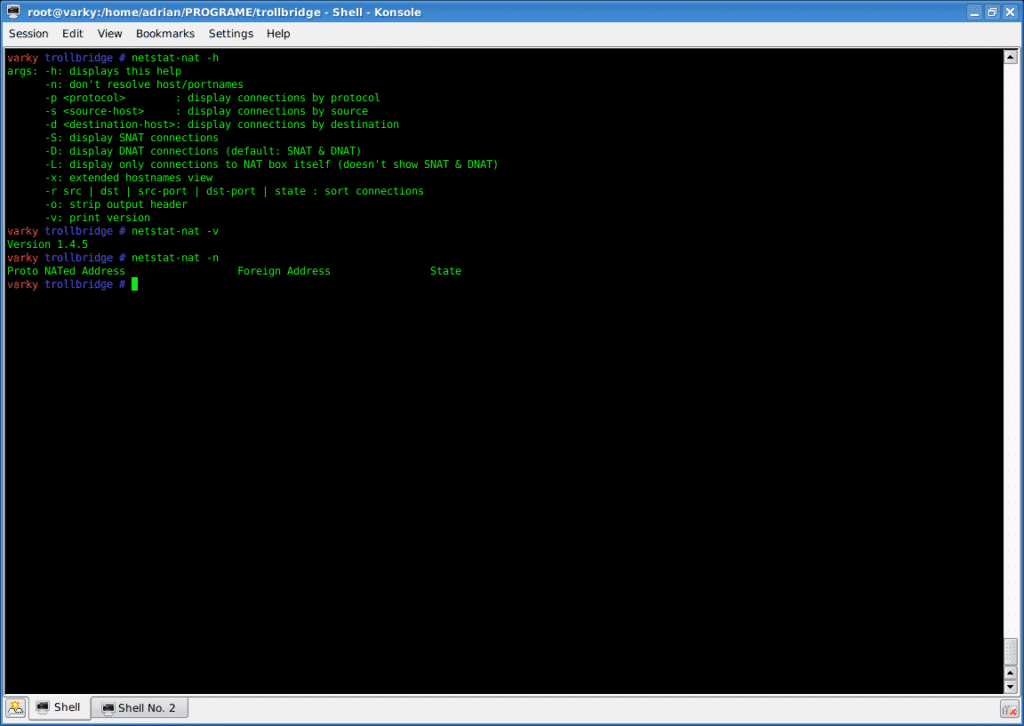
The “netstat-nat” is a Linux utility that displays all NATed connections, managed by iptables or netfilters. For example, a server configured as a router or firewall running Linux iptables may use the netstat-nat utility to show all its NATted or router connections.
Key Features:
- Command line utility
- Free on Linux
- Protocol filtering
- SNAT and DNAT modes
Why do we recommend it?
The Netstat-nat command is built into all distros of Linux that are based on Linux 2.4.x and above. This means that the tool is free to use. It accesses the cross-reference table that your firewall uses to translate addresses. The Netstat-nat command has a number of options that improve or limit its output. For example, if you are implementing port address translation, you can extract just the records that relate to a specific port.
The lightweight utility reads information from the temporary conntrack-storage of Netfilter (‘/proc/net/ip_conntrack' or ‘/proc/net/nf_conntrack').
To make the utility work, make sure Netfilter is enabled in the Kernel.
What can you do with netstat-nat?
- You can display only SNAT, DNAT, or both connections.
- Display all NAT connections.
- Filter according to protocol number.
- Filter by source IP.
- Display connections from a specific destination IP/hostname.
- Sort NAT connections.
- And more…
The utility is supported by the popular Linux distros, including Debian, Ubuntu, Suse, Redhat.
Who is it recommended for?
Any network administrator that has a Linux machine can use this tool. It isn’t available on Windows. The package provides a method for an ad-hoc query. However, any administrator that likes to set up scripts could create a repeated query for live monitoring.
Pros:
- Can quickly show which connections are actively established on a machine
- Can find suspicious connections quickly if you know how to interpret netstat information
- Can filter by TCP connections to limit your scope on noisier networks
Cons:
- Doesn’t provide geolocation mapping for connections found
- Requires training to understand how to properly use netstat in a meaningful way
This Linux utility is free and you can get more information from the netstat-nat project.
3. Cisco’s IOS “show ip nat translation”
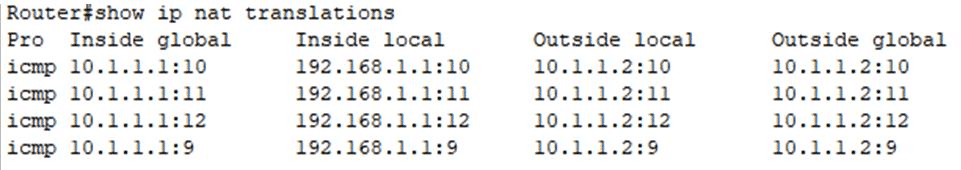
The most efficient method to check the NAT table and its contents from Cisco devices is with the IOS CLI command “show ip nat translations.”
Key Features:
- Available on all Cisco network devices
- Free tool
- Show command
Why do we recommend it?
The Cisco IOS operating system for switches, routers, and other network devices includes a query command that has many subcommands available. One of those subcommands is show ip and it has a NAT-specific option to list NAT translation records.
The command shows all currently active NAT translations on the router.
The output from this command allows you to see five different columns:
- Protocol:
The protocol type. Whatever protocol is busting a NAT connection: ICMP, TCP, UDP, etc. - Inside global:
This is the IP address of the “inside” local device as it is seen from outside (global). - Inside local:
This is the inside device’s IP address as it is seen from the inside. In other words, the real private IP. - Outside local:
Technically, this is an outside host as it appears from the inside network. According to Cisco, this is not a legitimate address, and it is used in unique scenarios. - Outside global:
The IP address of the outside host as it appears in the outside world. The IP is allocated from a globally routable network space (public IP).
Another useful Cisco’s IOS command to find information about NAT rules and translations is “show IP nat statistics; this command shows IP translations based on interface, percentage of hits and misses, etc.
With the show IP translation, you can also see the ACL (NAT rule) applied to each specific IP pool.
Who is it recommended for?
The show commands are well known to all network managers and so, as a network professional, you should already be familiar with the show ip options. Using the show ip nat translation command provides an easy-to-read table of the current translation table.
Pros:
- Completely free
- Easy to remember the syntaxs
- Built-in all Cisco devices
Cons:
- Lacks a graphical interface
- Designed only for Cisco products
Both commands “show IP nat translations” and “show IP nat statistics” are available in all Cisco devices with IOS.
4. “pfctl” for OpenBSD PF
The pfctl stands for packet filtering control. It is the utility that connects with the packet filter device, specifically for OpenBSD PFs. The pfctl can set configuration and rules or retrieve status information from the packet filtering (or firewall) device. It is very robust and provides a vast number of commands.
Key Features:
- Packet filter
- Runs on OpenBSD Unix
- Built-in and free
Why do we recommend it?
The Unix command set includes pfctl, which is a packet filter access service (packet filter control). The command has a lot of options and it isn’t just provided to query the network address translation table, so you need to use a specific option to get NAT data. The NAT tables is called the state table, so you need to user the -s states (or -s state) option to see the NAT table.
To display the current active NAT translations with the pfctl utility, append (-s state) option, following the command.
This array “pfctl -s state” will list all current NAT sessions.

The output will show you a list with multiple columns:
- The interface that the NAT session is bound to.
- The protocol used for the connection (TCP, UDP, ICMP, IGMP, etc.)
- Internal IP: The internal local IP address.
- The internal (Global): The IP address as seen from the outside.
- External IP: The address translated to an external IP and port (in case of PAT).
- State: The state that the connection is on right now.
Who is it recommended for?
This Unix utility isn’t as smart as the Linux command but if you have a Unix terminal, you only have this option. If you don’t like the output of this tool and you have a Cisco router, you could go directly to the router and get its NAT table, which has a better layout.
Pros:
- Extremely fast and lightweight utility
- Offers a robust variety of commands
- Best for those who enjoy CLI tools
Cons:
- Specfic for only OpenBSD
- No GUI
The pfctl utility, designed specifically for OpenBSD systems, is available for download free of charge.
5. pfSense WebGUI
The pfSense is one of the most popular free and open-source firewalls and routers. It is a customized distribution of the FreeBSD OS, adapted to be used as one of those devices.
Key Features:
- Free firewall software
- Runs on FreeBSD
- Comprehensive activity data
Why do we recommend it?
The pfSense WebGUI is a point-and-click interface for your pfSense firewall software. If you run a virtual firewall through a computer and operate it with pfSense software, the Web front-end option is easier to use than the command line interface.
pfSense comes with an easy-to-use web user interface.
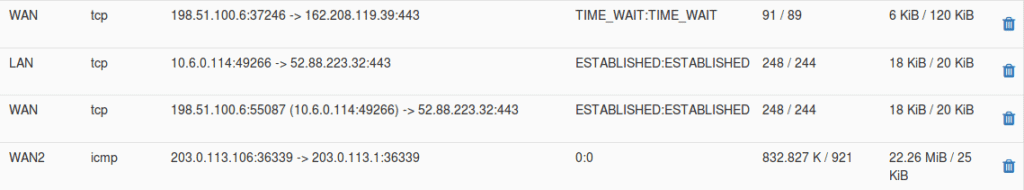
With pfSense’s WebGUI, you can see a list of all firewall and NAT states, it includes:
- The interface: Where the state is bound.
- The protocol: The type of protocol that initiated that state.
- The source and destination. The IP address before and after it is NATted. The arrow indicates the direction (inbound to outbound or vice versa).
- The state: The status of the state’s connection. These vary according to the protocol.
- Packets: number of packets that match the state, from source to destination.
- Bytes: The total size of packets, from source to destination.
When the session list is too big to find what you are looking for, you can apply state filters.
These filters help you search quickly regarding specific search criteria.
For example, you can search based on IP or the entire subnet.
Who is it recommended for?
The Web interface is a lot easier to use than the command line option and it is likely that even the most techhead veteran will prefer to use the GUI menu instead of typing in a series of commands. This option lets you get to the NAGT table through a menu structure.
Pros:
- Easy to use and read at scale
- Open source transparent tool
- Can easily sort and filter by packets, destination, traffic, etc
- Is completely free
Cons:
- Best used with pfSence products
For more information on viewing the Firewall states with the WebGUI, please refer to the official pfSense guide. The pfSense WebGUI is free with PfSense.
6. Juniper’s J-Web
J-Web is the web user interface for Juniper’s SRX Series Services Gateways.
The tool allows you to monitor, configure, and troubleshoot the firewall via HTTPS. The J-Web GUI frees you from using the JunOS CLI.
Key Features:
- Designed for Juniper network devices
- Built-in
- NAT query
Why do we recommend it?
Juniper Networks matches the functionality that Cisco provides on its network devices by producing its own command set. The Juniper J-Web interface is a little like the WebGUI provided by pfSense. This gives you a menu for navigation, so you don’t have to learn a special command language.
The NAT sessions and rules section in the J-Web interface lets you configure NAT.
It also shows you all current NAT translations and their policies.
You can also create filters when browsing through information in real-time (or historical).
You can monitor:
- Source NAT: Display all configured information about source NAT rules, pools, persistent NAT, and its bound addresses.
- Destination NAT: Display the destination NAT table containing information about the NAT address pool.
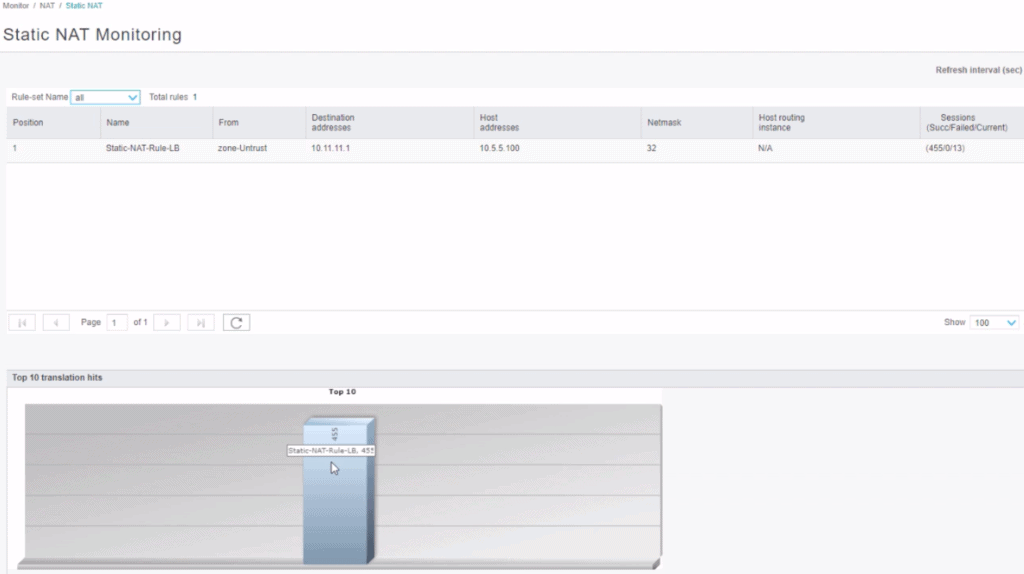
- Static NAT: View all configured static NAT rules.
- Interface NAT ports. Display the port utilization for the specific source pool.
- Monitoring NAT Incoming Table Information. View NAT table information in real-time.
The NAT monitoring tool will give you a breadth of information regarding the NAT sessions, from the interface, rule (policy), destination/source address, protocol, alarms, hits, and much more.
Who is it recommended for?
This tool is only relevant for networks that have devices from Juniper Networks. It is a Web-based GUI frontend, which is easier to use than a command set that needs to be typed in. You can’t use this front end with the network devices of any other network system provider.
Pros:
- Offers better visualizations than most NAT lookup tools
- Can sort traffic quickly – even in a live setting
- Offers both a GUI and CLI version
Cons:
- Specifically for Juniper devices
Where to find it? J-Web comes free with the Juniper device.
Final Words
A NAT Lookup tool is essential for troubleshooting NAT— which is critical for any modern network. The tool helps network admins look at NAT policies and sessions quicker and faster. Most of these tools are unique to a single vendor. They are dependent on utilities or features to the firewall or router. They are not standalone software.
But one that stands out is the SolarWinds NAT Lookup Tool. It is standalone software. One of the few allows users to connect to multiple firewalls simultaneously— plus it is 100% free.
NAT Lookup Tools & Software FAQs
How does NAT Lookup work?
In NAT Lookup, a device on a private network makes a request to access a public resource, such as a website or an email server. The NAT device, such as a router, intercepts the request and maps the private IP address of the device to a public IP address, which it then uses to access the public resource. The NAT device also maintains a table of the translations it has made, so that it can forward incoming traffic from the public network back to the appropriate device on the private network.
What are the benefits of NAT Lookup?
The benefits of NAT Lookup include improved security, conservation of public IP addresses, and easier network management. NAT Lookup enables private networks to access the internet or other public networks, while keeping their private IP addresses hidden from the public, which helps to improve security. Additionally, NAT Lookup helps conserve public IP addresses, as a single public IP address can be used to represent multiple private IP addresses.
What are the limitations of NAT Lookup?
The limitations of NAT Lookup include difficulty with certain applications and protocols, such as peer-to-peer networks and VoIP, which require direct communication between devices on the public and private networks. NAT Lookup can also add latency to network traffic and make it more difficult to troubleshoot network issues.
How can I configure NAT Lookup on my network?
The configuration of NAT Lookup depends on the type of NAT device being used and the network environment. In general, NAT Lookup can be configured through the web interface or command-line interface of the NAT device, such as a router or firewall. You can manage multiple devices at once using tools like SolarWinds NAT Lookup.

