
Our funding comes from our readers, and we may earn a commission if you make a purchase through the links on our website.
Instana Review Including Alternatives
UPDATED: April 11, 2022
SREs and DevOps teams usually work hard to ensure applications are running smoothly. They are constantly measuring (or observing) the internal states of a system by analyzing its outputs (or sensor’s data). Observing systems and applications this way helps improve performance but can be quite challenging if applications are distributed cloud-native microservices applications.
This is where Instana comes into place. Instana is an automatic APM and observability tool. It automatically ingests observability, traces every request, and profiles every process. Instana can keep up with the changing environment of such applications and see deep inside them.
In this Instana review 2022, we will go into full detail about the Instana platform. We’ll show you how it works, its unique features, user interface, pros and cons, and its competitors in the market.
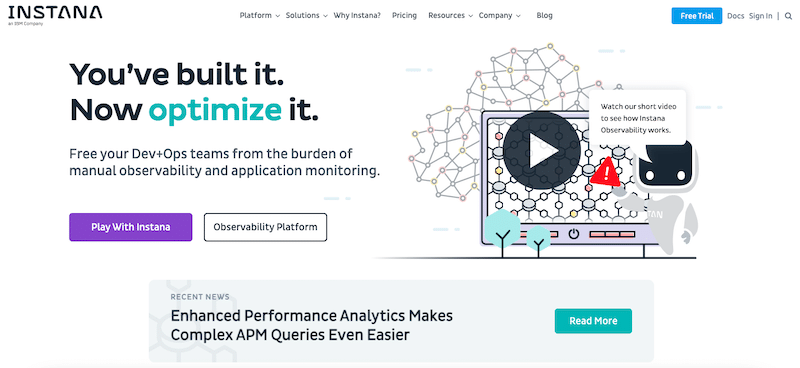
An Overview of Instana
Instana is an IBM company that provides an automated, contextual, and actionable enterprise observability platform powered by Application Performance Management (APM). The Instana platform can also help optimize the user experience with its End-User Monitoring (EUM) capabilities and monitor hybrid and multi-cloud environments with its full-stack cloud and infrastructure monitoring.
Although there are many competitors in the observability and APM market, Instana stands out as one of the preferred ones due to its focus on cloud-native applications and microservices. Such applications rely on complicated technologies such as containers and Kubernetes. The Instana tool can collect the performance statistics (or observability metrics) from the containerized applications and can also perform code profiling and distributed tracing— all automatically.
Product Details
- Deployment Instana uses agents deployed on each host to collect data. Access the Instana platform via a web-based user interface.
- Customer support and knowledgebase Instana provides a comprehensive knowledge base, an up-to-date blog, and IBM-based documentation. If you have inquiries or need support, you can reach the Instana team via email.
- Pricing model The price starts at $75 per host/per month and is billed annually.
- Free Trial Sign up to Instana to get a 14 -day free trial.
- Sandbox Test Instana via a ready sandbox.
- Gartner’s rating 4.5 stars (out of 119 reviews) Source.
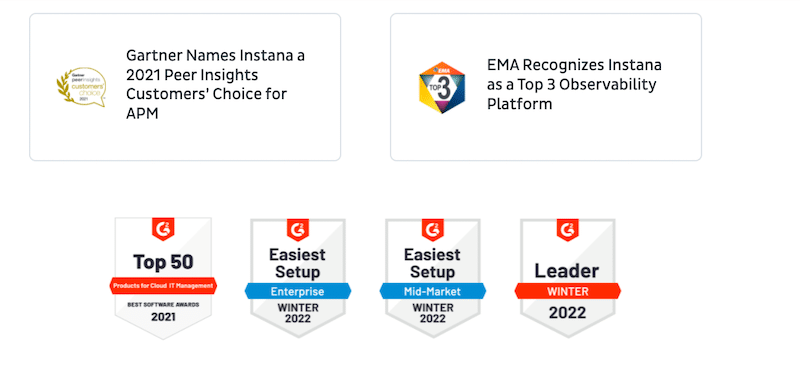
Awards and reviews
Instana holds a handful of awards and reviews. The most significant ones are from Gartner and EMA. Instana has been recognized by Gartner as a 2021 Peer Insights Customer’s Choice for APM. It has also been recognized by EMA as a Top 3 Observability Platform.
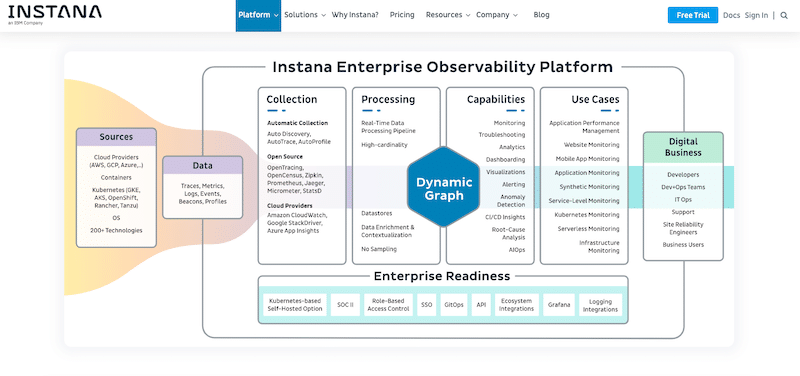
How does Instana work?
Instana uses a single agent deployed on each host (or monitored system). It collects sensor data from the source and aggregates it before sending it to the Instana cloud-based backend.
The Instana cloud-based backend platform ingests observability data, including metrics, traces, logs, and profiles. It automatically discovers (with the help of its agents) and maps all services, infrastructure, and their inter-dependencies. In addition, it also auto-traces each request, auto-profiles each process, and updates its application dependency maps accordingly. The platform can later perform real-time data processing and high cardinality.
Instana’s Key Features Review
- Observability Τhe feature that keeps Instana on top of the application monitoring game. The Instana Enterprise Obsevability platform ingests all kinds of observability data, including metrics, traces, beacons, events, logs, and profiles. It collects this data and performs real-time data processing. One of the main use cases (but not the only one) for Instana’s observability is microservices monitoring. Instana automates microservice discovery, mapping, monitoring, tracking, and troubleshooting.
- Automatic APM Another feature that makes Instana stand out is its 24×7 automated application performance monitoring. Automatic APM means that you do not have to stay in front of the screen and constantly check statistics. The tool performs automatic discovery, services mapping, traces requests, profiles processes, and maps your application's dependencies without any human interference. The automatic APM also provides rich and immediate context to help you understand relational dependencies. In addition, Instana also provides an in-depth root-cause analysis to solve problems easier and faster.
- End-User Monitoring EUM The Instana End-User Monitoring (EUM) feature helps you to provide an optimal user experience across all your applications and websites. Instana EUM tool tracks the browsers’ performance and every application and correlates it to the back-end application’s performance. Instana’s EUM automatically captures every browser request and creates a map of the paths in chronological order. It analyses the data collected and provides a context of end-user experience for each request.
- Integrations Although there are many APM options in the market, most have compatibility and support limitations. Some APMs will work adequately on one infrastructure or product but not others. Instana addresses these incompatibility issues with its wide supportability. The platform is compatible with all popular cloud infrastructure such as Amazon Web Services (AWS), Azure, IBM Cloud, and Google cloud Program (GCP). It is also compatible with notification tools (Webex team, Google Chat, etc.), tracing tools (Scala, GraphQL, etc.), CI tools (Mina, Jenkins, etc.), and many more.
- Robust Analytics Another feature where Instana has a leg up on its competitors is its detailed analytics. Instana comes with advanced analytics features that help identify a problem’s root cause or optimize the services. The features include data grouping, tag-based filtration, visualization, and extensive tags. One of the fantastic features of Instana’s analytics is that it collects and combines unsampled data to give you a new point of view and improve your organizational decision-making process. Instana analytics is powered by Instana’s Unbounded Analytics so that you can perform correlation analytics (deep analysis with context) to understand how every application component and service interrelates with others.
Reviewing Instana’s User Interface
Instana’s Web UI is highly intuitive, responsive, simple, and easy to use. The main dashboard (as per the Instana sandbox) shows an overview of all applications, web apps, sites, infrastructure, platforms, analytics, and events.
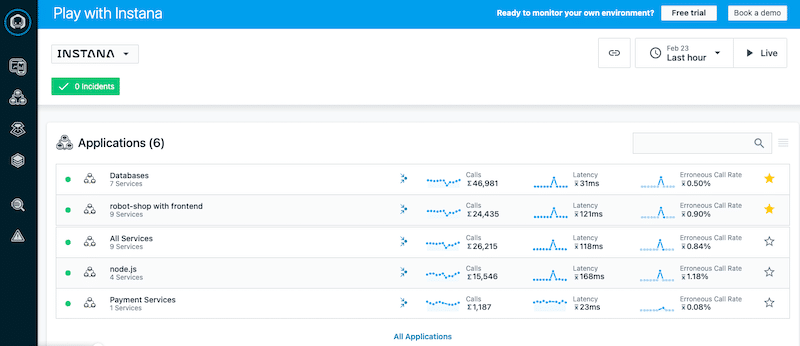
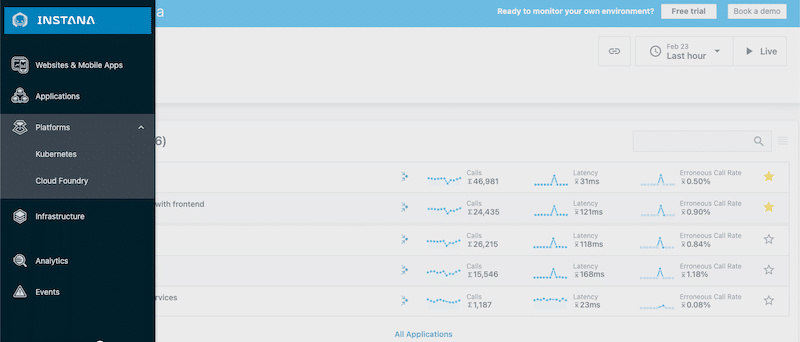
To get more details on each component, you can open the left-hand side Instana menu with the following sub-menus: Websites & Mobile Apps, Applications, Platforms (Kubernetes and Cloud Foundry), Infrastructure, Analytics, and Events.
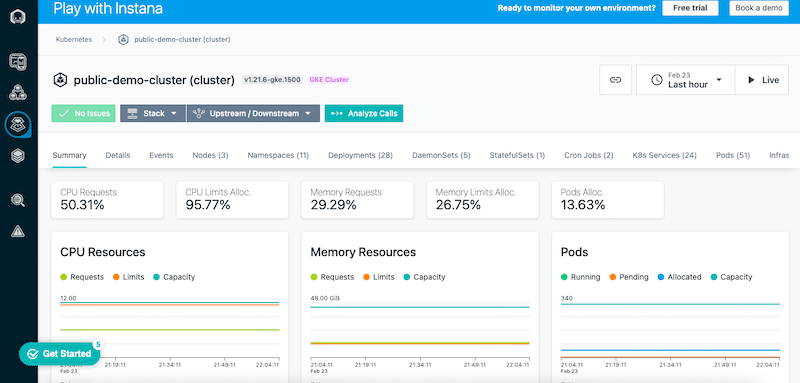
For instance, to check Kubernetes, go to the Platforms > Kubernetes > pick your cluster. Instana shows you issues, stack, upstream/downstream services, and run analytics to application calls. You can also monitor vital metrics of your cluster, including CPU requests, memory requests, pods, top nodes, top namespaces, and more.
As you might notice from the screenshots above and below, the web interface is quite organized and visually pleasing.
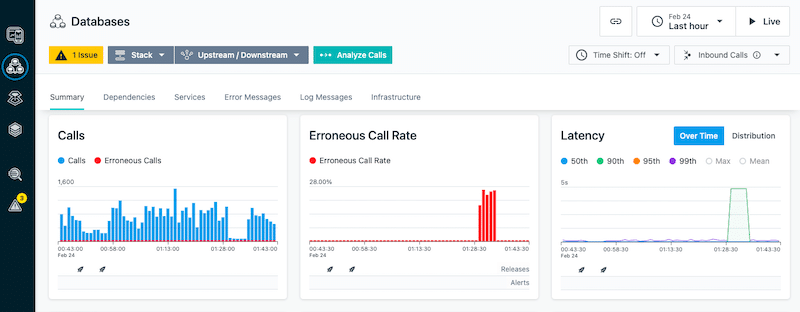
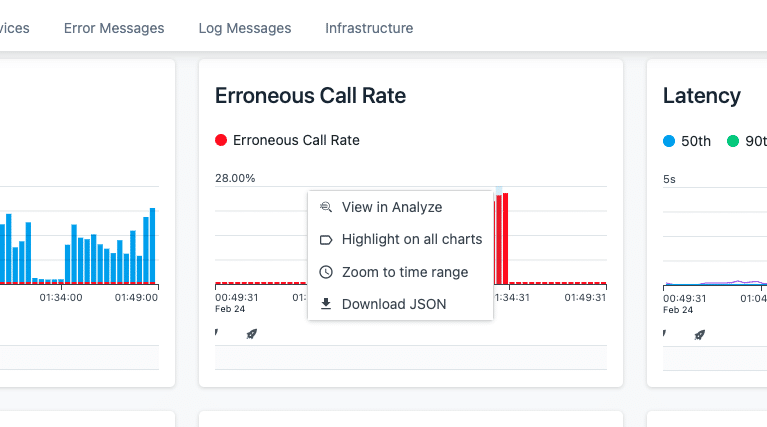
In addition, the web UI is highly interactive. You can zoom in to specific metrics and timeframes or points in time and get a fine-grain control. For instance, you can view a point in time of a metric in Analyze, highlight it in all charts, zoom in, or download it in JSON format.
Instana Pros and Cons
Instana is a single tool that gives you a birds-eye view of all your cloud-native infrastructures and applications. It is preferred by many DevOps and SRE teams, especially for its automatic APM and Kubernetes monitoring.
Pros:
- This tool is compatible with major cloud infrastructure providers, different notification tools, and many CI/CD tools.
- Instana performs the automatic distributed tracing and analysis to help troubleshoot and optimize performance faster.
- It is one of the preferred tools for container and Kubernetes monitoring (for many good reasons).
- You can customize the Instana dashboard according to your specific needs.
- Instana has a good reputation for its highly responsive customer support team. They are available round the clock and ready to attend to the queries of their customers.
- Last but not least, the pricing plan is quite flexible. You can purchase the one-time product and install it on-premises, or you can go for the SaaS option.
Cons:
- Instana needs to improve its learning curve. Many users complain that it can be time-consuming, to begin with, Instana. It takes time to learn to set it up and use it initially.
- Instana should also improve the availability of some training material, such as webcasts and videos. Solid training material can help those observability beginners to get their feet wet, without depending on customer support.
- Although the Instana price is quite straightforward, we would love to see more flexibility in their plans.
So we have learned everything about Instana and how handy this tool can be for troubleshooting and optimizing your application infrastructure. Now, let's take a look at the top alternatives to Instana available in the market.
Alternatives to Instana
- SolarWinds Server & Application Monitor – FREE TRIAL A renowned name in the market for real-time server monitoring and end-user experience optimization. SolarWinds & Application Monitor (SAM) provides enterprise-class monitoring for your infrastructure, server, systems, databases, networks, and more. SolarWinds SAM provides a 30-day free trial option.
- Datadog A leading APM and observability tool for cloud-based application monitoring. The features that make Datadog unique from its alternatives are its easy installation, troubleshooting, integration, alerts, attractive dashboard, and comprehensive representation of the collected data. Sign up to try a 14-days free trial of Datadog.
- NewRelic One of the top full-stack observability and APM tools on the market designed to monitor, debug, and improve your entire stack. This tool shows all performance data of your full stack in graphs, charts, and alerts so you can respond promptly. Sign up to try the forever-free plan.
- AppDynamics By Cisco is another strong leader in the APM and full-stack observability platform market. With AppDynamics you can keep track of the entire stack, including business, users, applications, infrastructure, network, and even security. Sign up to AppDynamics to get a 15-day trial.
- Site24x7 APM Application performance monitoring tool is a close competitor to Datadog. Site24x7 unifies the monitoring of KPIs, traces, and logs from multiple cloud architecture and infrastructure layers into a single console. It monitors Internet-related services, websites, online apps, user experience, and servers for uptime and performance. Sign up for a free 30 days trial.
- Dynatrace Leading in automatic and intelligent observability. Its platform integrates key elements such as observability, AIOps, intelligent monitoring, automation, and business analytics into a single platform. The Dynatrace platform is preferred for its full-stack auto-discovery, code maintenance, RUM, auto-determine cause, and its reporting and customizable dashboards. Dynatrace to get a 15-days free trial.
- Splunk A data analytics platform used for monitoring, searching, and visualizing machine-generated data. Splunk provides their Observability suite over the cloud, with tools like Splunk Infrastructure Monitoring, Splunk APM, Splunk RUM, Splunk Log Observer, and Splunk On-Call. This cloud provides you with complete full-stack insights. Splunk offers a free trial for 14 days.
Final Verdict
Instana is a fantastic tool for those ITOps, DevOps, and SREs looking to monitor complex and distributed environments like microservices and Kubernetes. It provides observability capabilities powered by automatic Application Performance Monitoring. In addition to End-User-Monitoring and hybrid, multi-cloud infrastructure monitoring.
If you are looking for alternatives such as AI, ML-powered analytics, and automation or security monitoring, you might have to look at the Instana alternatives. In addition, other APM tools provide more flexibility when it comes to pricing. For instance, you can get more pricing flexibility and more integrations with tools like SolarWinds Server & Application Monitor, Datadog and New Relic.

