
Our funding comes from our readers, and we may earn a commission if you make a purchase through the links on our website.
The Best Hardware Monitoring Software & Tools for Server, Desktop & Network Devices!
UPDATED: January 9, 2024
Without a doubt, it is challenging to run an infrastructure, services, and different applications that need a guaranteed uptime. Although we can’t have the perfect monitoring method to keep all our components intact, we can still have a system that is capable of displaying and alerting us when a threshold is reached so that we can take the necessary actions.
Unlike the best system monitoring software, hardware monitoring software and tools are specifically designed for this purpose, and they play a significant role in maintaining uptime.
Here is our list of the best hardware monitoring software:
- SolarWinds Network Performance Monitor (NPM) – EDITOR'S CHOICE This package of network monitoring services includes an autodiscovery function, asset inventory creation, and an automatically drawn network topology map. The system uses SNMP procedures to gather status reports and alerts from network devices. Runs on Windows Server. Start a 30-day free trial.
- SuperOps RMM – FREE TRIAL This SaaS package provides remote monitoring of hardware and software in its IT Asset Management module. Get a 21-day free trial.
- Paessler PRTG Hardware Monitoring – FREE TRIAL A package of monitors that watch network, servers, and applications and warn of developing issues. Installs on Windows Server. Download a 30-day free trial.
- ManageEngine Applications Manager – FREE TRIAL This package monitors software. However, in order to do that, it also tracks the performance of the physical resources of supporting servers. Runs on Windows Server, Linux, AWS, and Azure. Access a 30-day free trial.
- Atera – FREE TRIAL This SaaS package is aimed at managed service providers and provides automated monitoring for networks, servers, and applications. Access a 30-day free trial.
- SolarWinds Server & Application Monitor (SAM) – FREE TRIAL A monitoring system that extends from server resources, through middleware and infrastructure =, to watch the performance of applications on the network and out on the Internet. Runs on Windows server. Download a 30-day free trial.
- Site24x7 – FREE TRIAL Offers real-time alerts and comprehensive reporting, making it ideal for proactive hardware monitoring for any size environment. The platform provides detailed analytics to aid in performance optimization for a wide range of hardware and software vendors. Start a 30-day free trial.
- HWMonitor A monitoring system for endpoints that accesses motherboard status reports and is available in free and paid versions. Runs on Windows.
- HWiNFO A free system diagnostic tool for Windows PC that covers issues temperature, fan activity, and power supply.
- AIDA64 Extreme A low-price monitor for PCs running Windows that watches over CPU, memory, disk activity, temperature, and power supply.
- Intel Extreme Tuning Utility (XTU) A free diagnostic and system optimization tool for Intel processors.
- AMD Ryzen Master A free control dashboards that enables you to adjust the settings of a Windows PC.
What is Hardware Monitoring?
Hardware and health monitoring are essential practices to prevent a PC from overheating and overloading.
Hardware monitoring tools can display real-time statistics of CPU, RAM, GPU, Hard Drives, Motherboard, Network Adapter, and other PC components. Some tools can even show you the information and specifications of the hardware.
Even though most computers are capable of handling some errors and self-healing, sometimes the rise in the temperature due to hardware malfunctioning or some unexpected code error can degrade the system’s performance.
So, it is necessary to implement a Hardware Monitoring solution that can minimize those failures.
A Hardware Monitoring tool analyzes the periodic information collected from the core components and then displays it in real-time graphs.
The software notifies you when an unexpected event occurs so you can start working on the problem immediately before that system crashes due to hardware maflunctions.
Following are the system components and metrics that a hardware monitoring system should be able to collect and display:
- CPU Usage The CPU usage can be reduced or increased by a process. The code errors in the process can increase the CPU consumption, which may lead to a potential rise in the temperature.
- Memory Utilization Excessive memory utilization can also impact the OS performance. For instance, if an app is using too much cache memory, it will decrease the system performance.
- Physical Disk Space Average response times could be another factor that notifies us about a faulty disk. The typical response can be to swap to the available partitions and free the space on the volume.
- Network Monitoring The bandwidth of the network or even its entire traffic can be affected by a faulty adapter, defective hardware, protocol failures, and even potential cabling issues.
- Event Logs These are the records for network safety. The logs are registered in the background and can be used when there is suspicious activity, or an error takes place. When there is a failed drive or high temperature, the event logs related to these issues can be sent over email or any alerting practice.
- Core Temperature and Fan Speeds Keeping track of fan speed in computers is critical. The optimal temperature for a running CPU should remain as cold as possible. A CPU without cooling and running hot, can make the entire system crash and possibly damage the processor permanently.
- Voltages Another important component for hardware monitoring. A difference in electrical power such as over-voltage or under-voltage could also impact and degrade a server or PC.
What should you look for in hardware monitoring tools?
We reviewed the market for hardware monitoring software and analyzed the options based on the following criteria:
- Solutions to monitor servers, desktops, routers, and switches
- System configuration checks to optimize hardware performance
- Alerts on critical component statuses
- A discovery service that automatically compiles a hardware inventory
- Automated checks on hardware
- A cost-free assessment opportunity offered by a free trial or a demo system
- A free tool that offers constant checks or a paid monitoring system that gives value for money
With these selection criteria in mind, we have picked a wide range of hardware monitoring services – some of which are lightweight, free tools, while others are extensive, paid monitoring packages. We have included options for all the major operating systems.
The Best Hardware Monitoring Software & Tools
Below we have listed some of the best hardware monitoring software and tools that can keep track of some or all of the components mentioned above.
Each software contains a quick description, features, pricing, and download links.
1. SolarWinds Network Performance Monitor (NPM) – FREE TRIAL
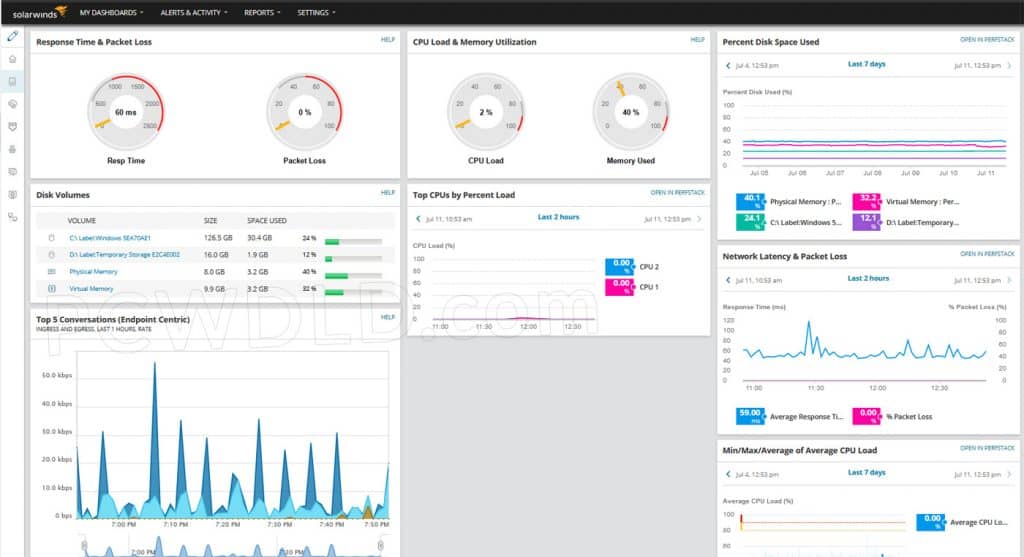
SolarWinds NPM is one of the best network monitoring tools available on the market. It is straightforward to use and compatible with many vendors like IBM, Cisco, Microsoft, Linux, etc.
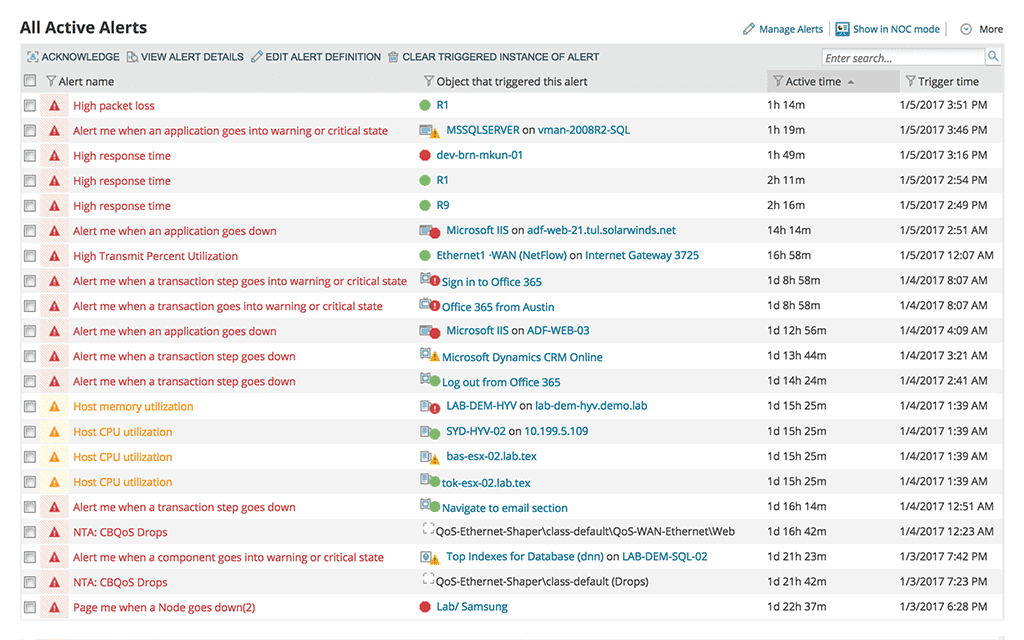
With NPM, you can monitor network availability, performance, and faults, and quickly find out the root cause of any issue with the help of its smart topology-aware network alerting system.
Key Features
- Multi-vendor network monitoring
- Advanced alerting system
- Intelligent, dependency, and topology-aware network alerts
- Generates intelligent maps automatically
- Wireless network monitoring and management
Why do we recommend it?
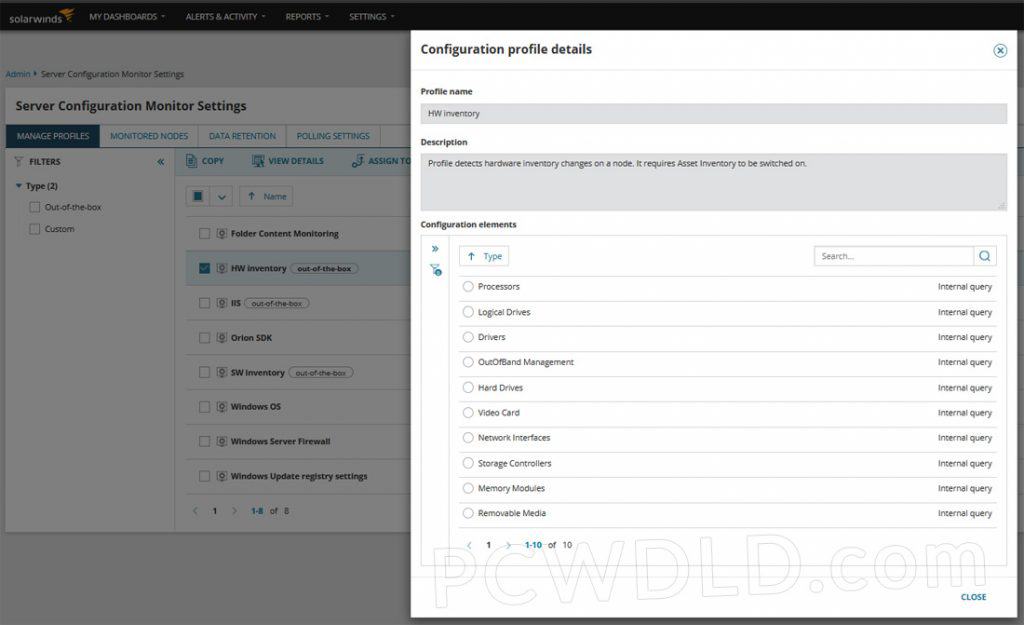
It makes the process of discovering equipment, mapping them, and creating an inventory list easier. SolarWinds NPM solution works well with different vendors and helps monitor their networks and performance.
NPM speeds up troubleshooting time, increases service levels, and reduces downtime. It also improves operational efficiency with out-of-the-box dashboards, reports, and alerts.
With the help of the Hardware Health Monitoring system, you can also keep track of essential device components such as temperature, fan speed, and power supply.
Who is it recommended for?
IT Operation teams and sysadmins can make the best use of the tool to monitor their hardware and prevent performance issues. Non-technical users, on the other hand, might find some of its features too complicated.
Pros:
- Supports auto-discovery that builds network topology maps and inventory lists in real-time based on devices that enter the network
- Has some of the best alerting features that balance effectiveness with ease of use
- Supports both SNMP monitoring as well as packet analysis, giving you more control over monitoring than similar tools
- Uses drag and drop widgets to customize the look and feel of the dashboard
- Tons of preconfigured templates, reports, and dashboard views
Cons:
- This is a feature-rich enterprise tool designed for sysadmin, non-technical users may some features overwhelming
EDITOR'S CHOICE
SolarWinds Network Performance Monitor is our top pick for hardware monitoring software because it is able to discover all of the equipment connected to a given network and then map them, creating an asset inventory as it goes. This tool helps you to keep track of all of your equipment from its frequent update sweeps of the network that adjusts the inventory where necessary. It also polls network devices for status reports, enabling the IT Operations team to keep ahead of any sudden hardware failures or strains.
Download: Start 30-day Free Trial
Official Site: solarwinds.com/network-performance-monitor/registration
OS: Windows Server
2. SuperOps RMM – FREE TRIAL
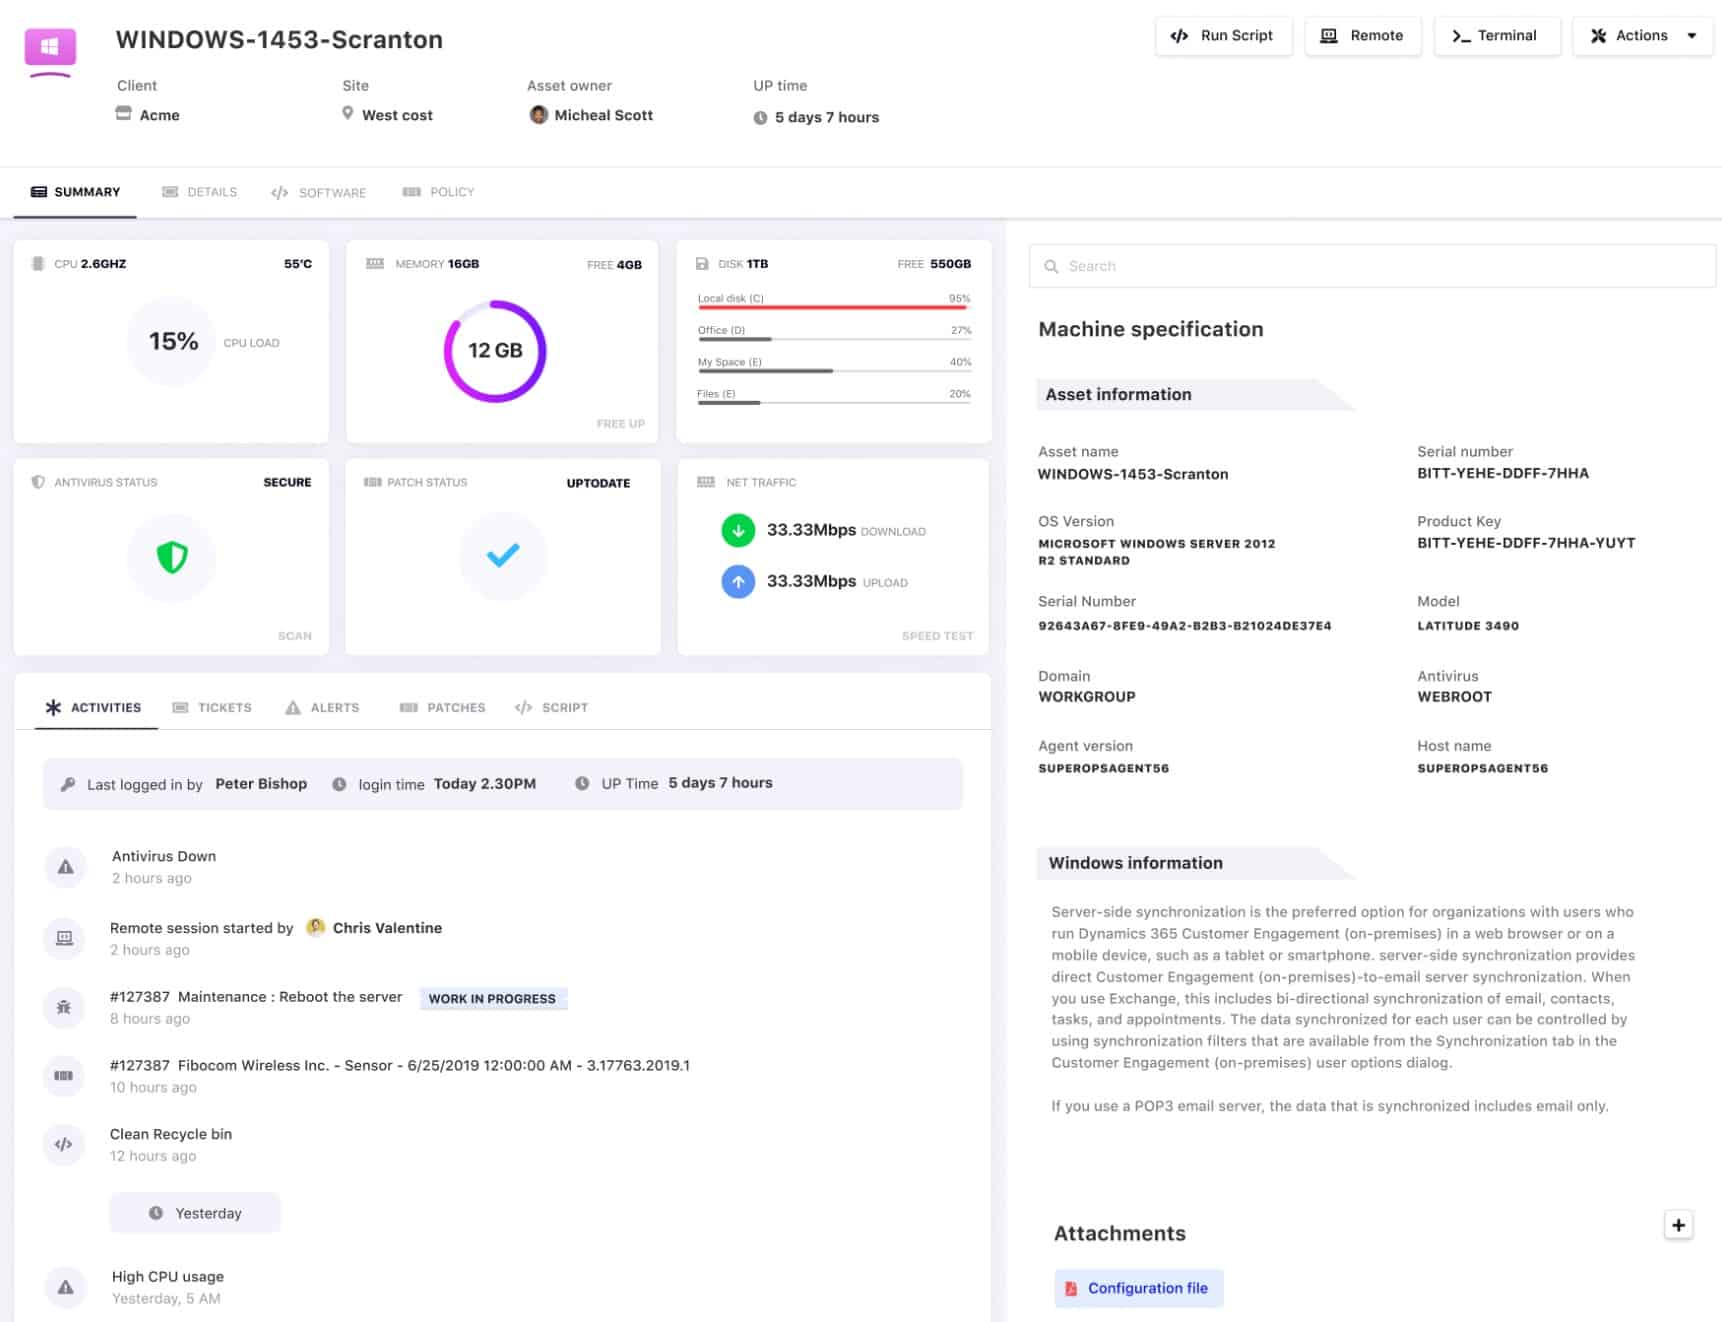
SuperOps RMM provides a remote monitoring and management service for IT assets. This package is suitable for use by managed service providers and IT departments to monitor a fleet of devices, including network hardware and endpoints.
The system will scour your network and create an inventory from the information it discovers on each device it encounters. Each record contains details of the device’s hardware capacities, such as the processor type and disk capacity.
Key Features
- Device discovery
- Hardware inventory
- Hardware statuses
- System documentation
Why do we recommend it?
SuperOps RMM is an easy-to-manage tool that offers clear visibility into IT assets and helps track the root cause of hardware malfunction or failure. Further, it offers AI-powered intelligent alerts that help cut through the noise and provide accurate information.
The inventory includes the option to add custom fields to the record for each device, such as supplier details. It is also possible to store important hardware-related documentation in the RMM, which includes leasing agreements or maintenance contracts.
The system performs constant status monitoring on each device, watching over the utilization of each component, such as CPU and memory. If demand reaches close to full capacity, the RMM will generate an alert.
Who is it recommended for?
IT departments and managed service providers may find this tool highly beneficial for tracking endpoints and network hardware performance. It comes in various editions making it easier for professionals to choose a package as per their requirements and budget.
Pros:
- Multi-tenant architecture for managed service providers
- Customizable tracking, such as depreciation
- Automated status monitoring for all hardware
- Task automation through scripting
Cons:
- Doesn’t produce a network map
Price: SuperOps offers four plans which offer Professional Services Automation (PSA) tools and remote monitoring and management (RMM) systems. These are priced per technician per month at:
- Standard (PSA Only) – $59
- Standard (RMM Only) – $79
- Pro (Unified Basic) – $99
- Super (Unified Advanced) – $129
Download: SuperOps is a cloud-based system and you can sign up for a 21-day free trial.
3. Paessler PRTG Hardware Monitoring – FREE TRIAL
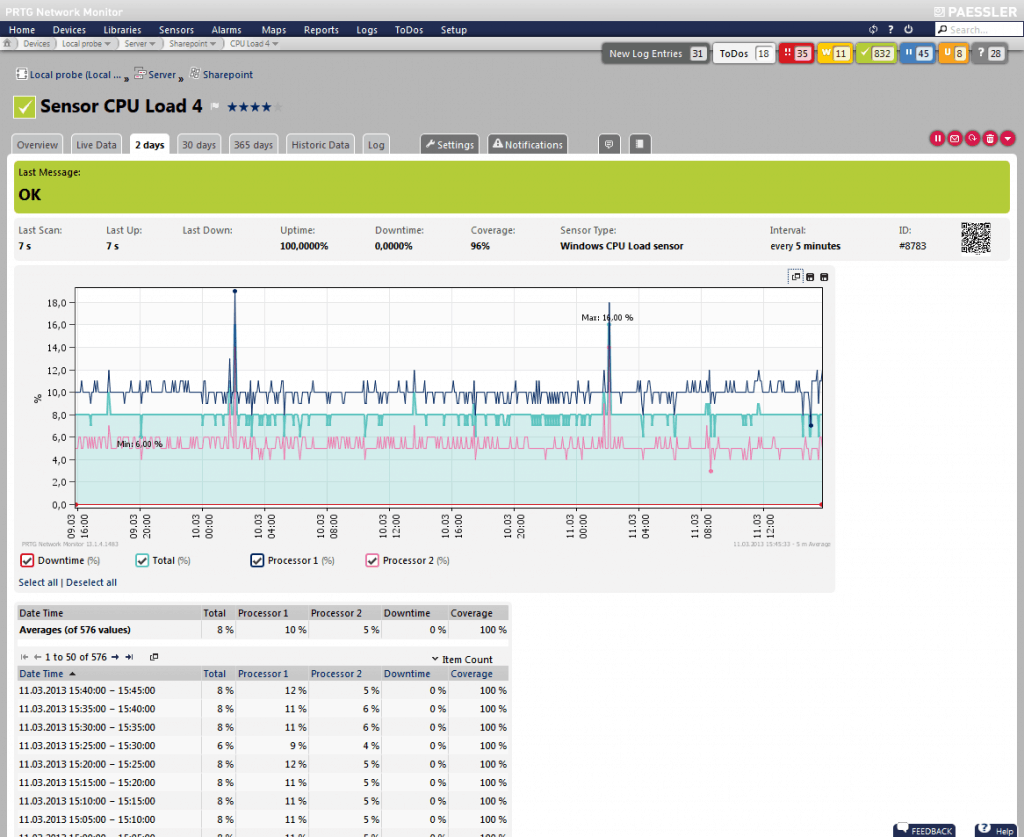
PRTG Network Monitor is another great network monitoring tool used to check network availability, traffic, and other different network components. It runs only on Windows systems and is capable of collecting the data from servers, network devices, or hosts. You can also check the historical data which may help you predict trends, and react to changes.
PRTG comes with over 150 sensor types for different network services, that include FTP, HTTP, CPU Load, Memory, Physical Disk, temperature, and even humidity. When an outage or hardware failure occurs, users can be notified via SMS, email, or pager.
Key Features
- Users can customize their monitoring package as per the budget and requirement
- Automatically discovers new devices and reflects the latest modifications
- Offers access to 150+ sensor types
- PRTG has an easy-to-use interface with drag and drop editor
Why do we recommend it?
Paessler PRTG Hardware Monitoring is a flexible tool that allows users to auto-discover new devices and report on network performance using packet sniffing, SNMP, and WMI technologies. Users can even customize their alert system and use third-party integrations for notifying on critical issues.
PRTG comes with an easy to use web interface with point and click configuration. You can fetch the data from PRTG and share it easily with your non-technical colleagues and customers. Data can also be shared via live graphs and custom reports.
Other Hardware Monitoring Features:
- CPU and RAM monitoring.
- Physical Hard Drives, SAN, NAS monitoring.
- Keep track of printers, their ink level, number of pages printed, etc.
- Real-time dashboards display live performance and status information.
Who is it recommended for?
With the PRTG, businesses of any size can invest in it as they'll have to pay only for the number of sensors.
Pros:
- Uses a combination of packet sniffing, WMI, and SNMP to report network performance as well as discover new devices
- Autodiscovery reflects the latest inventory changes almost instantaneously
- Drag and drop editor makes it easy to build custom views and reports
- Supports a wide range of alert mediums such as SMS, email, and third-party integration
- Supports a freeware version
Cons:
- Is a very comprehensive platform with many features and moving parts that require time to learn
- Custom sensors can sometimes be challenging to manually configure
Price: You can buy PRTG through different packages based on the number of sensors. For example, PRTG 500 comes with 500 sensors and one server installation and costs $1,360.
Download: 30-day free trial of Paessler PRTG.
4. ManageEngine Applications Manager – FREE TRIAL
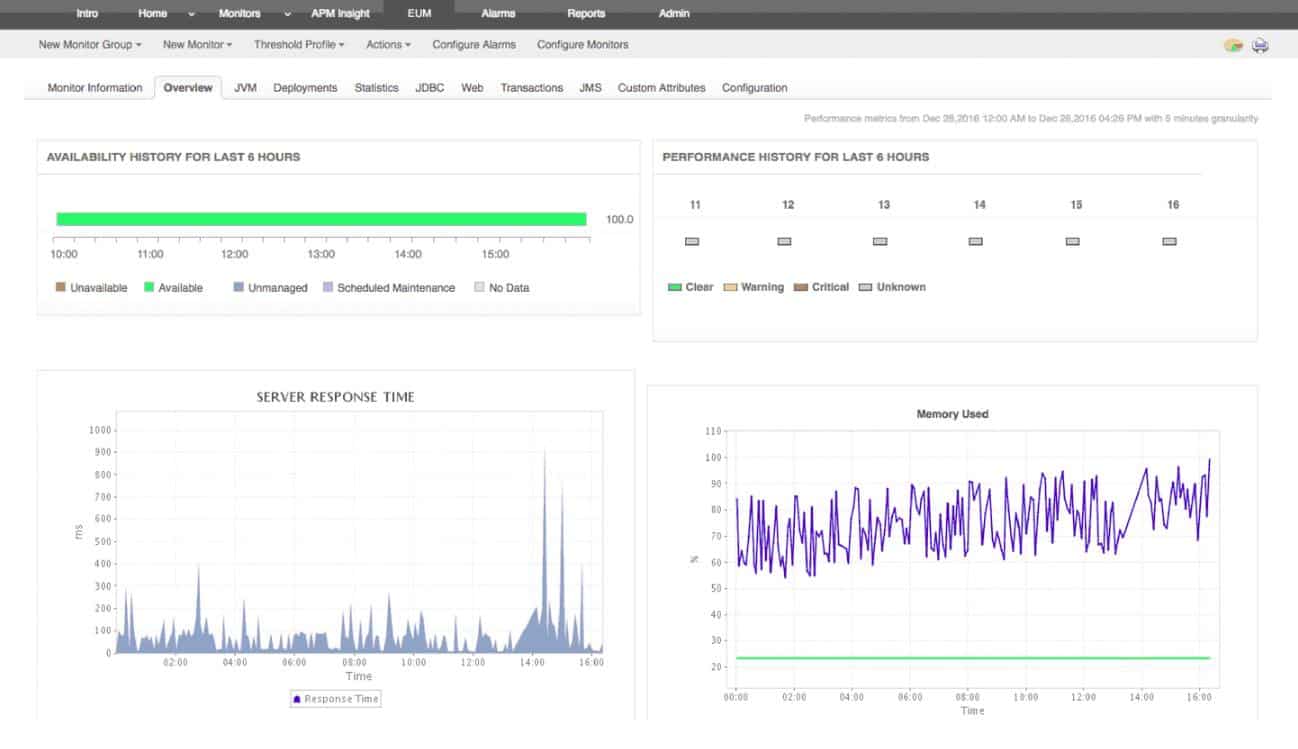
ManageEngine Applications Manager is geared around the performance of software. However, the tool also includes extensive server performance monitoring that includes the tracking of the physical resources on those servers.
The monitor automatically creates an application dependency map for each of the applications that it discovers. This drills down from client-facing interfaces, through supporting services, down to the servers that run them and their resources.
Key Features
- Monitoring templates for all of the major server brands
- Hardware health tracking
- Memory capacity and utilization
- Disk I/O monitoring
- CPU capacity and utilization
- Alerts for approaching server resource shortages
Why do we recommend it?
Gain deep visibility and watch over your physical resources, software and hardware performance, and availability to deliver a better user experience. It automatically creates an application dependency map and runs an in-depth analysis to detect the cause of hardware failure.
By monitoring hardware as well as software, the Applications Manager is able to quickly identify the real cause of performance issues. If a user-facing application is running badly, it is obvious that users are going to complain about that application. However, it isn’t necessarily the fault of mechanisms within that application that cause performance issues. Supporting hardware could be to blame.
ManageEngine Applications Manager installs on Windows Server and Linux. It is also available as a service on the marketplaces of AWS and Azure. There are three editions of the tool: Free, Professional, and Enterprise. All versions include server monitoring systems.
Who is it recommended for?
IT departments and managed service providers can use the cloud service to track the hardware's health, availability, and performance.
Pros:
- Software and hardware performance monitoring
- Application dependency mapping
- Root cause analysis that traces problems down to server resources
- Alerts that can be forwarded by email, SMS, Slack, or service desk ticketing system
- Available as a service on cloud platforms
Cons:
- Not offered as a SaaS package
Price:
- Free – $0
- Professional – starts at $395 per year
- Enterprise – starts at $9,595 per year
Download: Access a fully functioning 30-day free trial.
5. Atera – FREE TRIAL
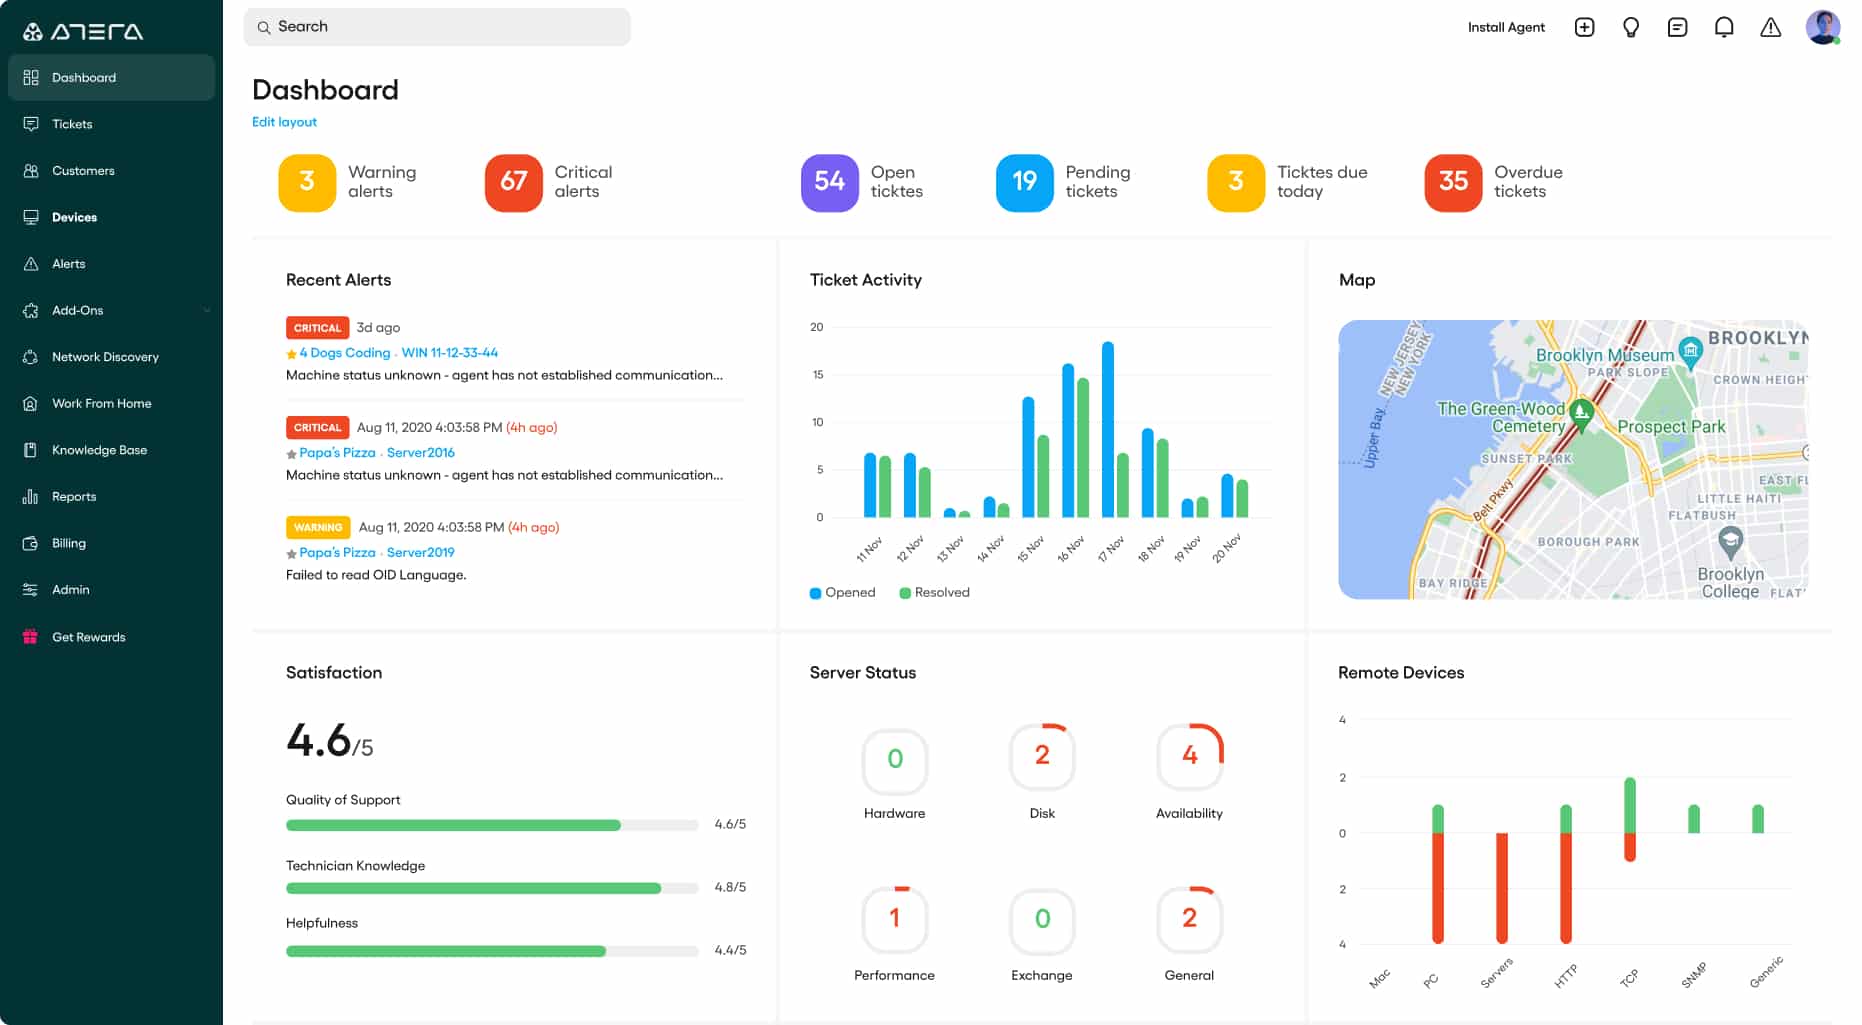
Atera is a SaaS platform that is designed to support managed service providers (MSPs). The package includes both professional services automation (PSA) tools for MSP management and remote monitoring and management (RMM) tools for technicians. The RMM system provides automated monitoring for networks, servers, desktops, and applications.
Key Features
- Cloud-based dashboard accessible through any standard Web browser
- Ticketing and remote access for user support
- Patch manager for Windows, macOS, and software
Why do we recommend it?
Atera is a cloud-based service that provides access to monitor unlimited devices and manage equipment with full control from a single console. The automated monitoring solution is also capable of providing protection to Windows and macOS endpoints and servers.
The network monitoring service is based on the Simple Network Management Protocol (SNMP) and provides constant reports on network device hardware and operating conditions. Endpoints and servers running Windows and macOS are also covered by the automated monitoring systems of Atera.
Who is it recommended for?
IT departments and MSPs can choose from the different versions and use them as per the need.
Pros:
- Per technician subscription pricing
- Monitors Macs as well as PCs
- Alerts for status problems
- Automated monitoring and maintenance tasks
Cons:
- Device discovery is charged for as an extra service
Compatibility: This is a cloud-based service that can be accessed through any standard Web browser.
Price: 30-day free trial available.
Download Link: https://www.atera.com/lp/rvw/remote-it-management-v2/
6. SolarWinds Server & Application Monitor (SAM) – FREE TRIAL
Server & Application Monitor (SAM) from SolarWinds is a simple system management software that can be used to obtain larger visibility into the application and server (both physical and virtual) performance issues.
SAM is one of the most versatile OS monitoring solutions, including 1200+ services, programs, and software OS's that you can monitor.
You don't need to use multiple tools and custom scripts; the multi-vendor applications and servers can be controlled from a single console.
Key Features
- 1200+ application monitoring templates such as Active Directory, XenApp, Java, Office 365, IBM Websphere, etc.
- AppStack dashboard helps you quickly check the infrastructure dependencies and pinpoint the root cause of application issues in the server (physical and virtual)
- Reduce alert fatigue with customizable alerts
- Monitor server storage performance and health
Why do we recommend it?
Users can track some of the important server hardware metrics and record software activity with SolarWinds Server & Application Monitor. Further, the tool comes with 1200+ application monitoring templates.
With SAM you can optimize your IT infrastructure and reduce management overhead.
It helps you identify hardware failures that are causing performance degradation, such as temperature, fan speed, power supply, memory, physical disk space CPU, etc.
You can set defined baseline values for your hardware components, and once a threshold is exceeded SAM can alert you through the dashboard (through critical, warning, or up) or send you alerts.
Who is it recommended for?
It might be a great option for businesses that prefer choosing cloud services over on-premises systems. But, it is perfect for enterprises with their own servers.
Pros:
- Designed with large and enterprise networks in mind
- Supports auto-discovery that builds network topology maps and inventory lists in real-time based on devices that enter the network
- Alerting features balance effectiveness with ease of use
- Supports both SNMP monitoring as well as packet analysis, giving you more control over monitoring than similar tools
- Uses drag and drop widgets to customize the look and feel of the dashboard
- Robust reporting system with pre-configured compliance templates
Cons:
- Designed for IT professionals, not the best option for non-technical users
Price: 30-Day Free Trial Download Below!
Download: a fully functional SAM 30-day free trial.
7. Site24x7 – FREE TRIAL
In the landscape of hardware monitoring software, Site24x7 presents itself as a strong contender, especially for those seeking a comprehensive tool to monitor and manage their hardware resources effectively. Designed to cater to the needs of IT professionals and system administrators, Site24x7 offers an array of features that not only track hardware performance but also provide insights into the overall health and efficiency of the IT infrastructure.
Key Features
- Real-time monitoring of hardware components like CPUs, memory, disks, and network devices
- Customizable alerts for hardware performance thresholds and failures
- Comprehensive reports and dashboards for hardware utilization and trends
- Support for a wide range of hardware devices and manufacturers
- Integration with cloud and application performance monitoring tools for a holistic view
Why do we recommend it?
Site24x7 is recommended for its extensive hardware monitoring capabilities and customizable alerts, which are essential for the proactive management of IT infrastructure. Its ability to integrate with various systems and provide comprehensive reports makes it a top choice for ensuring hardware reliability and performance.
Who is it recommended for?
This software is particularly suitable for IT professionals, system administrators, and medium to large-sized businesses that require detailed monitoring of their hardware resources. It’s also ideal for those who manage complex IT infrastructures and need a unified tool to monitor hardware along with cloud and application performance.
Pros:
- Detailed real-time monitoring of various hardware components
- Customizable alerts and reporting for effective hardware management
- Broad compatibility with diverse hardware devices and manufacturers
Cons:
- The extensive range of features might be more than what is needed for simple hardware monitoring tasks
8. HWMonitor
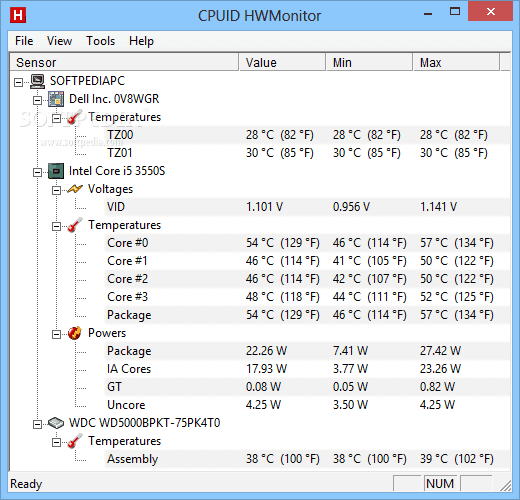
HWMonitor, developed by CPUID, is a fantastic PC monitoring tool that senses the majority of your hardware characteristics, such as temperatures, voltages, and fan speeds. The tool shows all the information on a single window which can be divided into layouts.
HWMonitor uses ITE IT87 and S.M.A.R.T sensors (installed on the motherboards of all modern computers) to provide system information. It can be installed on Windows XP, Vista, 7, 8, and 10.
Key Features
- displays CPU temperatures, voltages, usage, and power consumption
- Monitor GPU voltage, temperature, and usage
- Available for both Windows 32-bit and 64-bit versions
Why do we recommend it?
Tracking the hardware status and remotely accessing all the information is easier with HWMonitor. In fact, it provides detailed insights into CPU usage, power consumption, and other hardware metrics.
Who is it recommended for?
Small businesses can go in for the free edition, whereas the large companies that offer remote operations can invest in the HWMonitor Pro edition.
Pros:
- Freeware, with paid options for remote monitoring
- Open-source transparent project
- A great option for home labs and smaller networks
- Available for both Linux and Windows
Cons:
- No Mac version
Price: HWMonitor is free to download. It’s Pro version (with some extra features) is also available especially for professionals, to get an estimate for HWMonitor Pro, contact them.
Download Link: https://www.cpuid.com/softwares/hwmonitor.html
9. HWiNFO
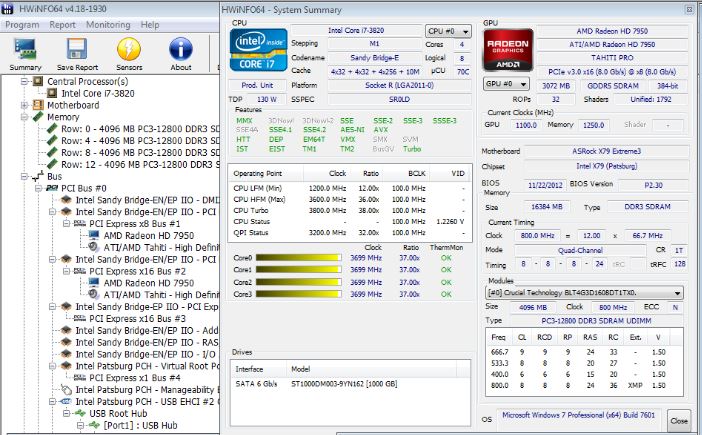
HWiNFO is a diagnostics software that provides a comprehensive hardware analysis and reporting feature. It also monitors Windows system components in real-time for actual status and failure prediction. It runs on all Windows platforms with the support for both 32-bit and 64-bit editions.
HWiNFO is designed to collect and display the maximum information about your PC hardware. This data makes it useful for those who are looking for driver updates, system integrators, and the computer manufacturer. HWiNFO presents the retrieved information in an easily understandable format which you can export into various types of reports such as Text and HTML format.
Key Features
- Monitor system health (Thermal, Voltage, Fan, Power)
- Text, HTML, MHTML, CSV, XML report formats
- Table, Graph, Logfile, Tray, Gadget, LG LCD reporting
- It receives updates frequently
Why do we recommend it?
Get real-time readouts of different hardware conditions and alert if any equipment runs out of memory or starts overheating. You can track the health status and report it to administrators in different formats.
Who is it recommended for?
The hardware monitor's alert system allows you to identify system issues without having to view the screen, which is especially useful for home users and small businesses. The tool is not a good choice for companies with numerous endpoints, though, as it can only be accessed by the user of the device hosting it.
Pros:
- Collects and tracks all the information related to hardware in real-time
- Customizable alert and reporting options are available
- Export reports in different formats, such as CSV, XML, etc.
- Supports Windows 32-bit and 64-bit editions
Cons:
- Does not have a dashboard for central management
Price: Available for free
Download: https://www.hwinfo.com/download/
10. AIDA64 Extreme
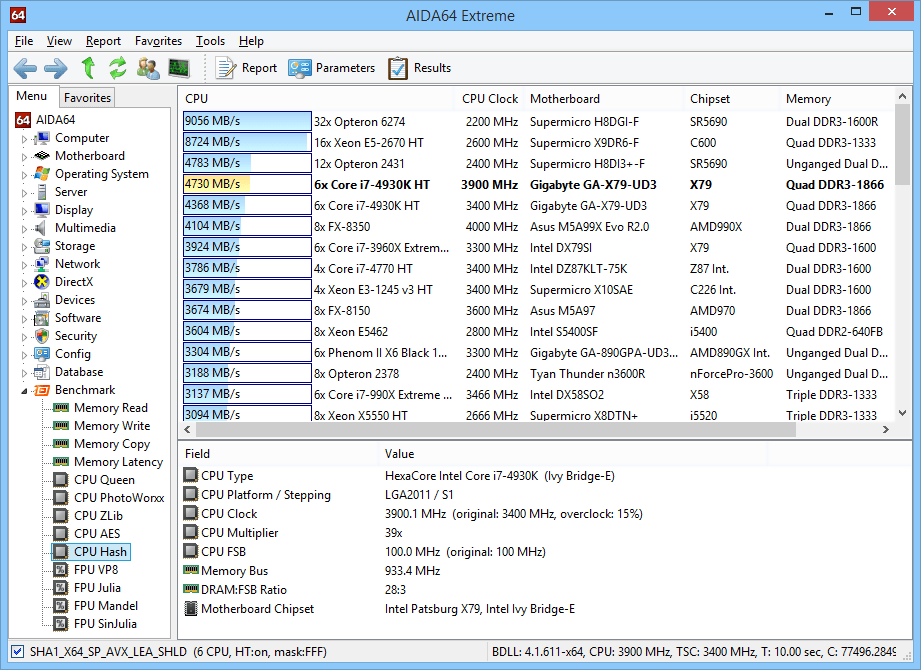
AIDA64 Extreme is an advanced hardware detection engine. The software offers in-depth information about installed software and hardware, and it also provides diagnostics. AIDA64 Extreme acts as a system information tool and gives you detailed information, such as Memory, CPU, FPU, Devices, Vendors, Fan Speed, Temperature, etc. Additionally, it offers benchmarks to help measure the overall performance of the PC.
Key Features
- It provides accurate data for voltage, temperature, and fan speed readings
- It helps detect and prevent hardware issues on your computer
- It provides over 50 pages of detailed information on the hardware configuration
- It supports over 250 sensor devices
- It comes with unique capabilities to assess the performance of the processor, disk drives, and system memory
Why do we recommend it?
Businesses can watch over all network activities, endpoints, and hardware status all from a single console. It allows users to remotely monitor and manage devices and provide detailed insights into hardware metrics.
Who is it recommended for?
Small businesses can make the most out of AIDA64, but large companies can also use it for detecting and monitoring devices.
Pros:
- Designed to detect and monitor devices at scale, good for large companies and enterprises
- Can save collected information in database format
- Simple alert system is easy to use
- Acts as a lightweight RMM with options to restart machines remotely
Cons:
- Less intuitive than leading products
- Interface could use improvements, graphs can be hard to read
Price: The price for AIDA64 Extreme full version starts at $39.95.
Download: a fully functional free 30-day trial of AIDA64 Extreme.
11. Intel Extreme Tuning Utility (XTU)
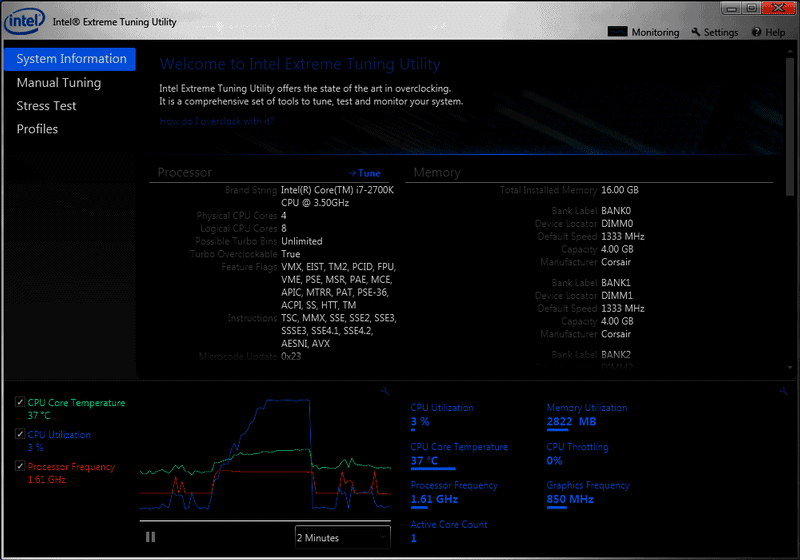
Processor maker, Intel develops the Intel XTU Tuning Tool, which is a performance optimizer software that runs on Windows systems. It helps to monitor, overclock, and stress-test devices.
It comes with a set of robust features along with additional capabilities that are available on new Intel Motherboards and Intel Application Processors.
Key Features
- Monitor temperature, voltage, and frequencies of multiple hardware. You can track the monitors, which enables you to graph the variation in values
- Stress tests availability for CPU, GPU, and memory
- It provides information about the motherboard, processor, and BIOS
- Allows you to change configuration parameters without restarting the system
- Saves a profile on the system for different performance configurations and provides a one-click overclocking experience
Why do we recommend it?
Intel Extreme Tuning Utility helps in monitoring frequencies, temperature, and other metrics of hardware along with stress-test devices. Further, it lets you modify settings without having to restart the computer.
Who is it recommended for?
Small businesses and IT administrators may find it a suitable option rather than businesses that wish to manage hardware at scale.
Pros:
- Designed specifically for Intel processors, providing highly accurate hardware details
- Features overclocking templates and stress tests
- Great for both novices and enthusiasts
Cons:
- Not the best solution for system administrators looking to manage hardware at scale
Price: Available for free
Download Link: https://downloadcenter.intel.com/download/24075/Intel-Extreme-Tuning-Utility-Intel-XTU-?product=66427
12. AMD Ryzen Master
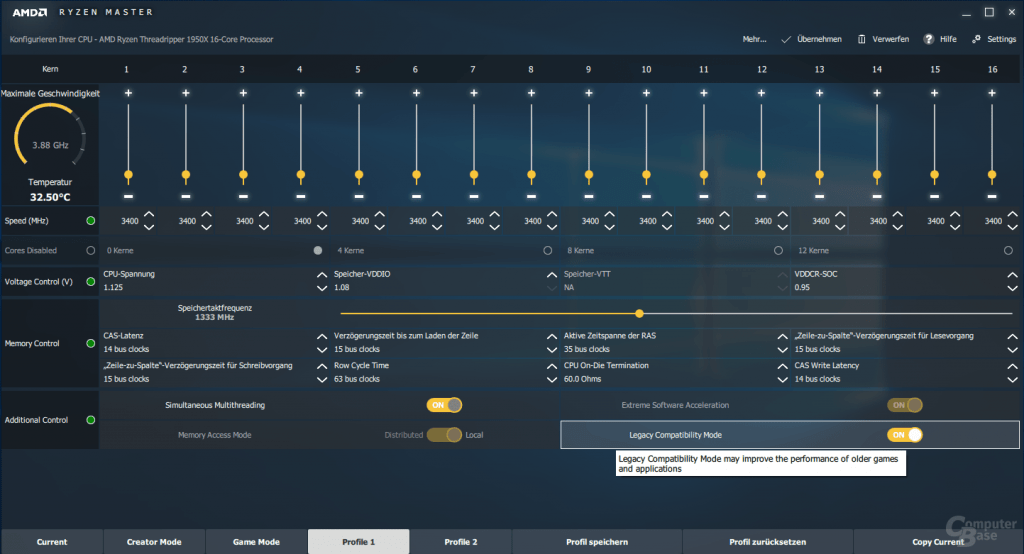
AMD Ryzen Master offers advanced and real-time control of system performance. It enables you to overclock and change factory settings so that the processor can be operated outside of AMD’s published operating specs.
With AMD Ryzen Master you can control multiple processor clock and voltage settings in real time. Moreover, it has various performance tuning knobs and adjustable parameters which are based on the AMD Zen processor core.
Key Features
- Monitor fan speed, temperature of CPU, and show live histogram controls
- It displays the current configuration and performance state of the system on the current View tab
- It displays information related to system and software information, alongside several global parameters
- Reset the processor CPU voltages, speed, core enablement and additional controls to stock settings with the “Reset” command
Why do we recommend it?
With AMD Ryzen Master, users can check vital system parameters like CPU temperature, speed, and voltages as well as automatically overclock their CPU. It even has the ability to store configurations in custom profiles.
Who is it recommended for?
AMD Ryzen Master is more of a deal for PC hardware enthusiasts and overlockers rather than business users.
Pros:
- Designed for overlocking and PC hardware enthusiasts
- Features custom profiles to store configurations
- Builtin graphing for a live look into hardware performance
Cons:
- Not designed for business use
- Does not offer a method to monitor multiple machines at the same time
Price: Available for free
Download Link: https://www.amd.com/en/technologies/ryzen-master
Conclusions
Sometimes the CPU load can increase due to malfunctioning processes or OS services.
The increase in the CPU calculations bring along a rise in temperature, which can, in turn, make the fan speed up to keep the temperature down.
The cycle is endless.
We have discussed some of the best Hardware Monitoring tools, that can help solve temperature issues by pinpointing the root cause of an issue and alerting you before its too late.
These tools are capable of monitoring computer hardware sensors and read temperatures, voltages, fan speed, etc., and alert you when a limit is reached.
Moreover, they provide information about many other important PC hardware components, such as manufacturing and versions.
Inevitably, hardware can fail anytime. But you can always be one step ahead and avoid outages and weak performance by keeping your equipment monitored at all times.
The monitoring tools discussed above can help by giving you detailed information and preventing most failures. Install any of the tools shown above and start monitoring your hardware – Many of them have 100% Free Trials or are Completely free and will help you keep your Desktop of Server Hardware monitoring in check!
Hardware Monitoring FAQs
How do I monitor hardware performance?
There are two ways to monitor hardware performance. The first is to interface directly with the sensors embedded in the equipment. These will have precise reports on factors, such as processing capacity, operating speed, error events, device temperature, and so on. The second is to look for activity metrics that can be measured externally, such as throughput, flow rates, and so on.
What is the best software for monitoring hardware remotely?
Any hardware monitoring package that can operate across a network is capable of remote monitoring. We recommend: SolarWinds Network Performance Monitor SolarWinds Server & Application Monitor ManageEngine OpManager

