
Our funding comes from our readers, and we may earn a commission if you make a purchase through the links on our website.
Firebug Alternatives: The Best JavaScript Debugging Tools
UPDATED: January 25, 2024
If you are looking for Firebug, you are too late: it is no more. However, we have other JavaScript debugging tools for you to try.
Firebug was an open-source debugging tool that also enabled the editing and monitoring of a website’s JavaScript, HTML, DOM, XHR, and CSS elements. It was a great service for those who engaged in the development of websites, those who needed to test new code, and those who had the responsibility for ongoing monitoring and maintenance of sites. It was a useful utility for DevOps environments for websites. What made it even better was that it was completely free to use.
The Firebug system operated as an extension for Mozilla Firefox browsers and was a project of the Mozilla organization. Its testing capabilities extended to security and performance analysis, so it was more than just a code debug system.
Firefox 57, released in late 2017. This version of the browser had some major changes. One of those was the removal of compatibility with XUL add-ons. XUL was another free product that was developed under the aegis of Mozilla. The full name of the system is XML User Interfaced Language, which, unfortunately, was the development code used for Firebug. So, because of this change to Firefox, Firebug, which had no standalone version, ceased to be useable.
Alternatives to Firebug
Firebug offered an impressive range of services. It is a difficult package to beat. The fact that it was free makes the task of finding a replacement for Firebug even harder. However, there are some good solid options out there.
The field of website testing and DevOps tools has expanded strongly in recent years. There are some interesting options available, so it is possible to find a tool that will prove to be alternatives to Firebug. However, it might be necessary to take on several tools in order to match all of the functionality offered by Firebug. In this review, we will concentrate particularly on JavaScript debugging tools.
To get close to Firebug’s operating methods, the best systems to look at are those that are integrated into Web browsers and so are free and operating system-neutral. There are also free JavaScript debuggers that are offered as extensions to Web browsers, which is exactly how Firebug functioned. We also added a couple of paid products to give you a rounded view of the current market for JavaScript debuggers.
Here is our list of the ten best Firebug alternatives that are JavaScript debugging tools:
- The Firefox JavaScript Debugger The successor to Firebug, Firefox Developer tools, was integrated into the Firefox Web browser in a range of utilities. The JavaScript Debugger is part of that suite of tools and is free to use.
- Google Chrome Dev Tools A suite of tools to support Web development and testing that is integrated into the Google Chrome Web browser and is free to use, including a JavaScript debugger.
- Opera Chromium Dev Tools In a similar scenario to Mozilla Firebug, Opera dropped its package of developer tools, called Dragonfly, and integrated its utilities into the browser menu.
- Edge Developer Tools Microsoft’s Web developer tools, including a JavaScript console, are integrated into the Edge browser and are free to use.
- Safari Developer Menu The Safari browser has a suite of free developer tools, including the JavaScript Console, which need to be activated before they are available.
- Flow A static type checker for JavaScript code that is open source and free to use. Installs on Linux.
- Omnibug An analyzer for Web marketing tools that can be used as part of a QA process when assessing the impact of browser-based applications. Available as a free add-on for Chrome, Firefox, Edge, Opera, Safari, Brave, and Vivaldi.
- SplineTech JavaScript Debugger A standalone debugging tool supplied directly by the programmer who wrote it. Runs on Windows.
- Raygun Error Monitoring A paid cloud-based service that integrates into a web page with a snippet.
- JS Bin A free, online Web development tool that includes a JavaScript debugger. Set up a paid account to get extra benefits.
You can read more about each of these options in the following sections.
The top JavaScript debugging tools
Methodology for Selecting the Best Firebug Alternatives as a JavaScript Debugging Tool:
Web developers widely use Javascript; hence, there is a huge demand for JavaScript debugging tools. With our expertise and research, we have listed below the guidelines to consider while choosing the best debugging tools.
- Consider your primary needs and goals for debugging.
- Check browser Compatibility with debugging tools.
- Explore the frequently used built-in developer tools of the browsers.
- Check out browser extensions and additional debugging features.
- Consider using an IDE with robust debugging capabilities.
- Look for Framework-Specific Tools.
- Consider Cross-Browser Testing across multiple browsers.
- Check for Community Support and Updates.
- If possible, go for free trials and testing for a better understanding.
1. The Firefox JavaScript Debugger
Given that Firebug was such a useful collection of development, testing, and monitoring tools, you would think it strange that Mozilla didn’t update the code for those services so that they would continue to work with the new version of the Firefox browser. That upgrade didn’t happen because the browser’s project team had already integrated the best features of Firebug into the browser itself. So, all of those tools are still available, just not as a separate plug-in with a distinct name.
Key Features
- Initial loading and source mapping: Ιt enhances the overall debugging experience by reducing waiting times and ensuring accurate debugging breakpoints.
- Human-friendly variable names: This makes it easier for developers to understand the use of variables and have proper collaboration and code maintenance.
- Console and Debugger: With quick access to the console and debugger, you can avoid repetition of code by identifying and fixing issues in the code.
- Faster load time: It minimizes the waiting period before developers can start working on their code or debugging processes.
Why do we recommend it?
The Firefox JavaScript Debugger offers handy tools within the Firefox browser. These tools enable you to effortlessly inspect, edit, and debug HTML, CSS, and JavaScript. You can assess your site's responsiveness, JavaScript, and layout performance. Additionally, it allows you to preview how your website or app will appear and function across various devices and network conditions.
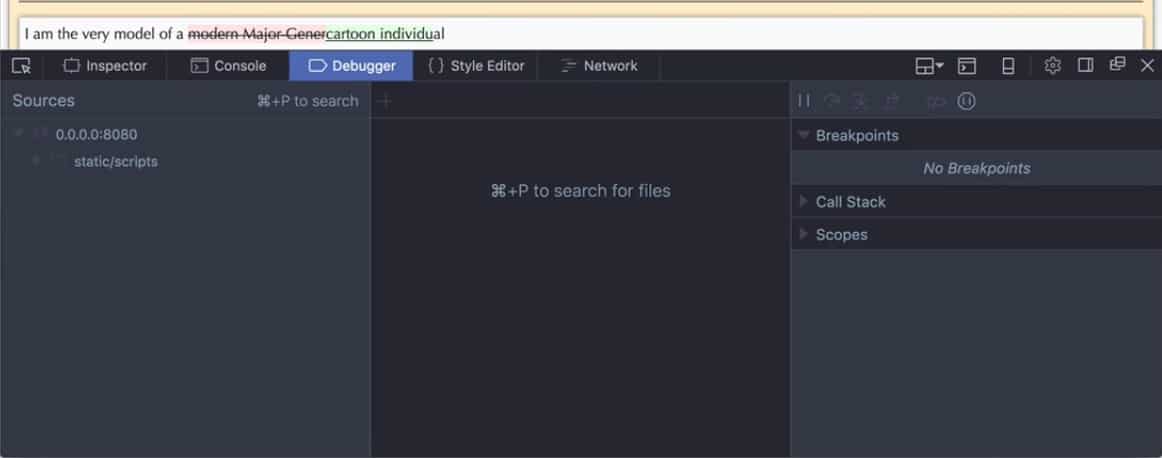
The JavaScript Debugger of Firefox is available from the Tool’s menu in the top menu of the browser. One of the options on that menu is labeled Web Developer and this opens up a sub-menu of utilities, which includes the JavaScript Debugger.
The debugger lets you run through JavaScript code step by step to help you spot errors. The code step view allows you to drill through to the code of functions as they execute or you can choose to stay in the main body of the program to watch the results of the function come back. The tool lets you enter breakpoints, and conditional breakpoints, and write output to log files.
The debugger is also able to examine CSS and HTML code Other utilities in the Web Developer suite of Firefox include the Page Inspector, which acts as a Web page editor, and the Web Console, which gives access to log files. The system also includes a network monitor and a Web page performance analyzer.
Who is it recommended for?
The Firefox JavaScript Debugger has a “Load Temporary Add-on” feature and is recommended for experienced web developers and extension developers. Experts who frequently work on developing and testing browser extensions find this tool valuable. It allows the loading of temporary WebExtensions directly from a local directory without the need for packaging or signing.
Pros:
- Various built-in tools: It is in-built into the Firefox browser, hence you don't need any installation to access it.
- Cross-platform compatibility: It can be used smoothly with various operating systems, allowing developers to use the debugger on Windows, MacOS, and Linux.
- Responsive design mode: It includes tools like Responsive Design Mode, enabling developers to preview and test how websites respond on different devices and screen sizes.
- Load temporary Add-on: The ability to load temporary WebExtensions simplifies the process for developers working on browser extensions.
Cons:
- Bugs and irrelevant information: Ιt crashes frequently while debugging angular JS and JQuery code. Also, you might need to confirm the information compiled by the bytecode compiler.
EDITOR'S CHOICE
The Firefox JavaScript Debugger is our top pick because it lets you easily debug code in Firefox, whether it's on your computer or a remote device like an Android running Firefox. It gives details about the extensions you're using for debugging, showing installed Firefox extensions, open tabs, and active service workers. This user-friendly tool provides comprehensive insights into your web development environment, making it a versatile choice for local and remote debugging tasks.
OS: Windows/Mac/Linus
2. Google Chrome Dev Tools
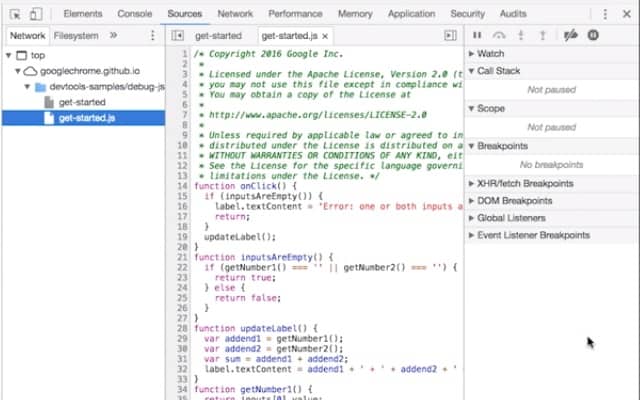
Google Chrome includes a suite of free Developer Tools, just like those in the Firefox browser. These are also free and they are bundled into the standard Chrome browser. In order to debug the code, you just run the page that it contains. You can pause the execution and open a side panel that shows the code in play and the point that execution has reached. You can rewind and click on a specific line to get it to run.
Key Features
- Audits and performance: It helps to identify areas for improvement, optimize code, and enhance the user experience.
- Inspect animations and JS debugging: Analyze the behavior of animations, identify issues, and make adjustments on the fly.
- Analyze website performance: This includes factors such as page load times, resource utilization, and overall responsiveness.
- Network condition simulation: Allows to simulate different network conditions to test how a website or application performs under various scenarios.
Why do we recommend it?
The Google Chrome DevTools is known for its powerful features, such as file viewing and editing, snippet creation, JavaScript debugging, and workspace setup. It offers a comprehensive suite to evaluate site performance, log messages, run JavaScript, and monitor network requests.
The debugger offers a list of events that you can activate a pause on and then click on step by step so you can watch the code execute in slow motion. The step-through shows the JavaScript program and highlights the current line as execution progresses. It also jumps through to function code when it is called.
Who is it recommended for?
Google Chrome DevTools is recommended for web developers, performance engineers, and quality assurance professionals. Experts use it to identify and address memory issues affecting page performance, such as leaks and bloat. It's useful for inspecting, modifying, and debugging web apps, testing cache, and viewing storage—essential tasks for ensuring optimal web application performance and functionality.
Pros:
- Live editing and debugging: It allows analyzing and running javascript to set breakpoints and check how variables and expressions perform using the console and source tab.
- Remote debugging: Chrome DevTools support remote debugging, allowing developers to debug applications running on different devices or environments.
- Timeline and Performance Analysis: DevTools offer a timeline view to analyze events and performance bottlenecks, helping developers optimize their code.
- Audits and Lighthouse Integration: DevTools include an Audits panel and integration with Lighthouse, enabling developers to run audits and improve website performance, accessibility, SEO, and more.
Cons:
- Browser-specific tool: It is limited to Google Chrome, so you might require other tools or extensions to test and debug your web app across different platforms and browsers.
The tabbed interface of the debugger lets you jump to log file viewing in the console or see network actions and application performance analysis without losing your place in the code walk-through.
3. Opera Chromium Dev Tools
The opera development team used to run a separate project for a development tool suite, called Dragonfly. Like Mozilla, Opera decided to integrate these tools into its browser. These are now called Chromium Dev Tools and they are free to use. In fact, these are exactly the same tools that you can access in Google Chrome.
Key Features
- Proxy setting configuration: Allows users to route their internet traffic through an intermediary server, to ensure security, and control over network connections.
- Analyze network requests and APIs: You can inspect and understand network requests and interactions with APIs.
- View and manage synced data: You can view and control synchronized data, such as browser bookmarks, passwords, and settings,
Allow remote debugging: Developers can debug and troubleshoot applications running on remote devices.
Why do we recommend it?
The Opera Chromium DevTools allows users to import browsing history, bookmarks, saved passwords, cookies, and more from other browsers. This ensures a seamless experience, catching Opera up with your activities in other apps and providing a unified browsing environment.
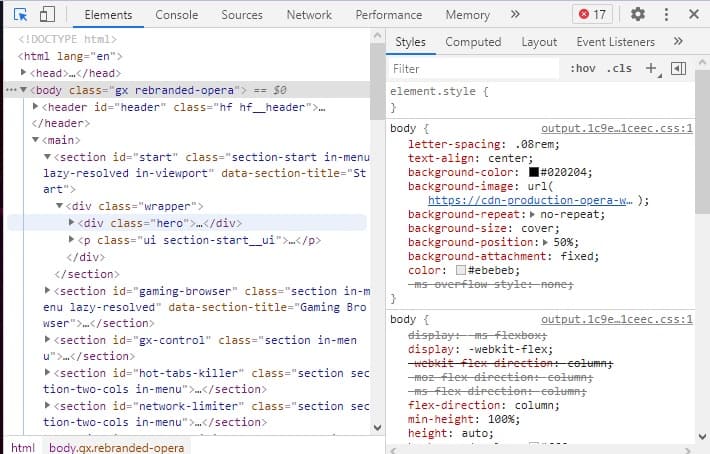
The developer tools in Opera can be accessed by pressing Control-Shift-C. this shows a code view of the current page, so in order to debug JavaScript, you would need to load the page that contains it. To get to the JavaScript debugger, you have to click on the three dots menu at the end of the page inspector’s menu strap and then select More Tools, and click on JavaScript Profiler from the sub-menu.
Who is it recommended for?
This tool is designed for both local and remote web development; web developers and debugging experts use this tool regularly. It has essential features like DOM views, element highlighting, and JavaScript code stepping. With CSS style inspection and network resource analysis, developers can efficiently debug creations and assess the impact on various devices, including mobile phones and televisions.
Pros:
- User-Friendly Interface: DevTools provide an intuitive interface, making it accessible for developers with varying experience levels.
- Security Panel: The Security panel helps identify potential security issues in web applications, ensuring a secure browsing experience.
- Device Emulation: Opera DevTools support device emulation, enabling developers to simulate the behavior of various devices for testing purposes.
- Extensions Support: Opera supports browser extensions, allowing developers to enhance DevTools with additional functionalities.
Cons:
- Occasional Stability Issues: Users have found the occasional stability issues or bugs, as with any software, which can impact the reliability of DevTools.
The JavaScript Profiler records the time taken to execute each step in your code, which can show you where inefficiencies lie. Other tools in the developer’s bundle include a network monitor and an application performance analyzer.
4. Edge Developer Tools
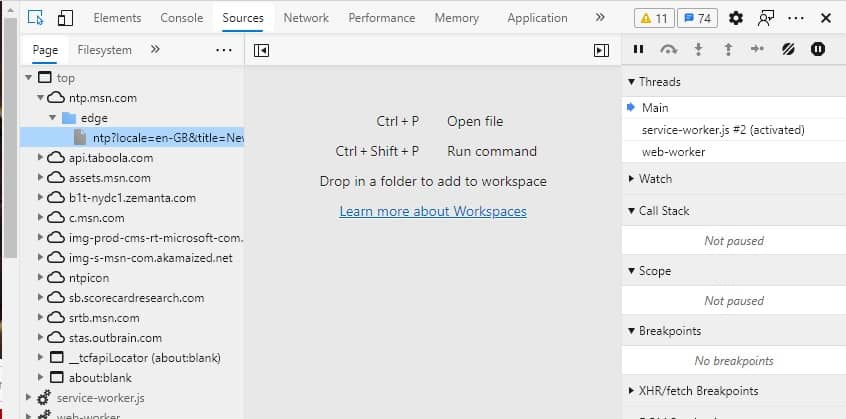
Microsoft Edge includes free developer tools that are also exactly the same as those in Google Chrome. As in Chrome, press Control-Shift-C to open the code debugger side panel. They can also be reached by looking in the three dots menu, selecting More Tools, and then clicking on Developer Tools. As explained in the Opera section above, there is also a JavaScript Profiler available from the three dots menu within the Developer side panel.
Key Features
- Customizing Devtools: It helps developers in adjusting panels, settings, and layouts to suit their specific needs and preferences.
- Command menu and keyboard shortcuts: It gives quick and efficient access to various functions and tools within their development environment.
- Improved web assembly debugging: It involves using Web Assembly, a binary instruction format that enables high-performance execution of code on web browsers.
Why do we recommend it?
The Edge Developer Tools includes excellent features like device emulation, network inspection, breakpoint debugging, and live console capabilities. It helps to simulate diverse environments, debug JavaScript, and identify memory to render issues for the optimal performance of web applications.
Who is it recommended for?
Edge Developer Tools are recommended for web developers and accessibility experts. It supports easy interaction through a mouse or keyboard and keyboard shortcuts. These tools help users who rely on assistive technologies like screen readers, enhancing the accessibility of web development for a broader audience.
Pros:
- Enhanced productivity: With the help of command palettes, you can easily access developer features and go through several menus with shortcuts.
- Remote debugging Android device: It supports remote debugging, which allows you to inspect and debug the code on the Android device using screencast.
- Supports Visual Code Studio: You can use the Visual Studio extension in your browser window to test the accessibility of the webpage, edit CSS, and much more.
Cons:
- Slower and lack of community support: Some users noticed an edge due to some processes. Also, some noticed strange failures like tab pinning and synchronization.
5. Safari Developer Menu
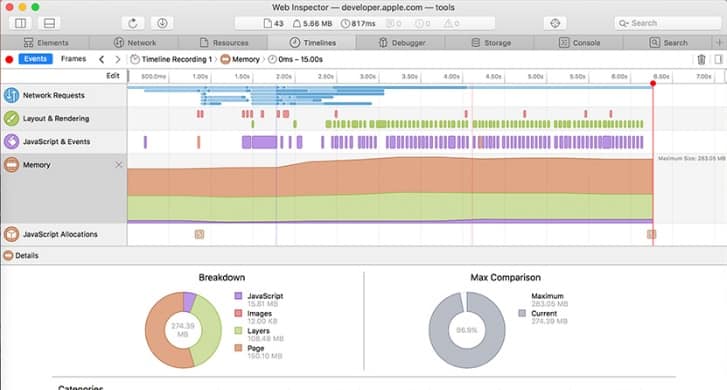
The Safari browser is available for macOS and iOS devices. It includes developer tools, but you have to activate the Developer menu before you can access them. Once you’re set-up, you can access the Web Inspector, which is an impressive performance monitor.
Key Features
- Easy navigation and tools: Offers straightforward navigation and intuitive tools, to interact within a web application or website.
- Supports Apple Pay: Allows users to make secure and convenient online payments using the Apple Pay system.
- Web push notifications: Sends updates, messages, or relevant content even when the website is not actively open.
- Passkey with web authentication: It includes verifying the identity to secure access and transactions on websites and applications.
Why do we recommend it?
The Safari Developer allows effortless modification, debugging, and optimization of websites for peak performance. Its responsive Design Mode allows previewing web pages in different screen sizes and orientations. You can easily access these powerful tools by enabling the Develop menu in Safari's Advanced preferences to check web development capabilities.
Who is it recommended for?
The Safari Developer Menu is recommended for web developers, particularly those working on Apple platforms. Its resource inspection capabilities make development easy across Apple devices. With a well-designed interface, experts can efficiently debug memory using Timelines and customize styles using widgets for over 150 common CSS properties, enhancing workflow efficiency.
Pros:
- Integrated Design: Developer Tools's clean and unified design places core functions in separate tabs, offering a streamlined and organized interface.
- Integration with Source Code Repositories: Safari Developer Tools provides native integrations with GitHub, Bitbucket, and GitLab, facilitating seamless collaboration and version control.
- Resource Inspection: Developers can inspect all resources and activities on a webpage, aiding in efficient development across Apple platforms.
- Comprehensive Performance Analysis: Developers can analyze site performance, including JavaScript and layout performance, to optimize the overall responsiveness of web applications.
Cons:
- Limited Cross-Platform Support: Safari Developer Tools are primarily tailored for macOS and iOS development, and there may be limitations when debugging or inspecting webpages on non-Apple platforms.
The tabbed interface of the Web Inspector includes a section for a debugger. This lets you observe JavaScript as it runs, set breakpoints, and advance execution line by line. Other utilities in the developer interface include a live event tracker that covers network and application performance and an HTML viewer.
6. Flow
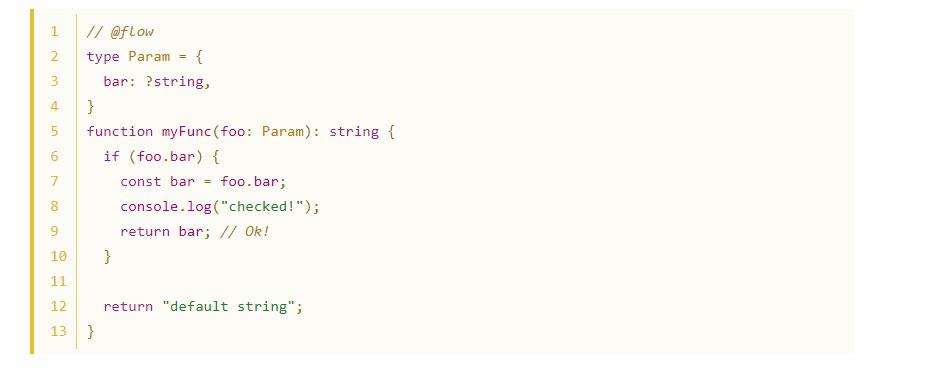
Flow is a development environment for JavaScript. It can spot errors as they are written and suggests improvement to programs. The environment also includes a testing system and a code library manager with version control and file protection services.
Key Features
- Static type annotations: It is a way to declare variable types in advance to improve code readability for faster development.
- Easy integrations: This tool supports straightforward integrations with various external tools.
- Real-time feedback: Provides instant information on code performance, errors, or other issues during the development process.
- Code library manager: It organizes and maintains code libraries, facilitating efficient code reuse, version control, and collaboration.
Why do we recommend it?
We recommend Flow for its real-time problem identification during coding. It eliminates guesswork and checking by leveraging Flow's understanding of your code. Its knowledge-sharing capabilities enable the development of intelligent tools, enhancing efficiency and code quality in the development process.
Who is it recommended for?
Flow is basically a static type checker for JavaScript, which JavaScript developers mainly use. It helps prevent issues during rebases, safeguards libraries from misuse, and enhances code comprehension over time. It is helpful for developers to maintain code integrity, stop errors, and understand code effectively, even after several months.
Pros:
- Static Type Checking: Flow is a static type checker for JavaScript, providing early detection of type-related errors and improving code reliability.
- Prevents Bad Rebases: Flow helps prevent issues during code releases, ensuring a smoother collaborative development process.
- Integration with Existing Codebases: Flow can be integrated into existing codebases, allowing gradual adoption and compatibility with new and legacy code.
Cons:
- JavaScript-Specific: Flow is designed for JavaScript, and developers working with languages other than JavaScript might need to explore alternative tools.
The flow testing system can track data during test runs and expose current values as each step of the JavaScript code works on them. This is a great tool for DevOps environments and it is able to integrate with typical development and operations planning tools. Flow is free to use and it installs on Linux.
7. Omnibug
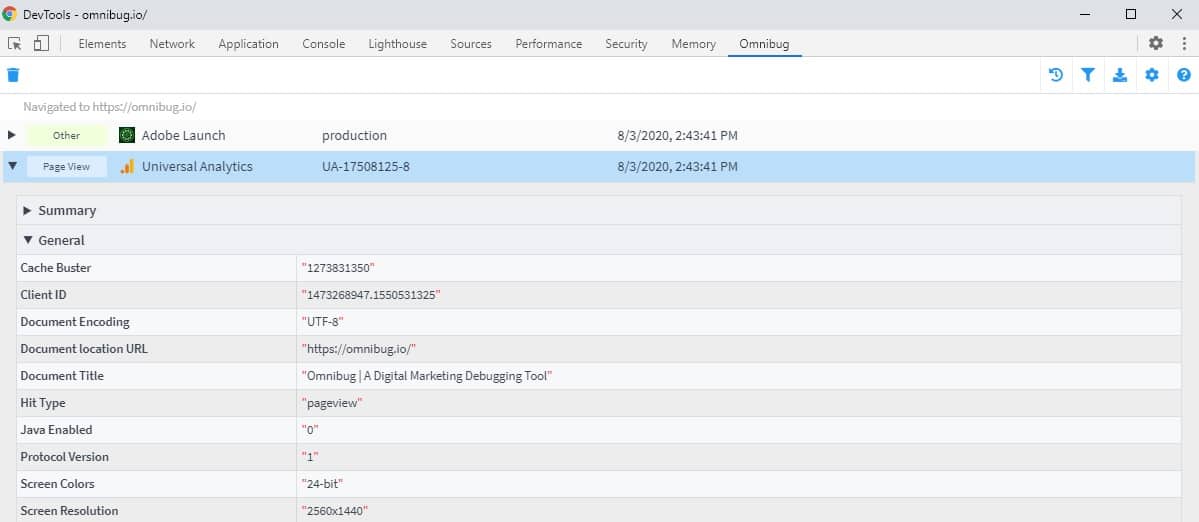
Omnibug is an add-on for browsers and it is available for Chrome, Firefox, Edge, Opera, Safari, Brave, and Vivaldi for free. This system focuses on the performance of marketing tools that operate from within your own Web pages. Although this isn’t exactly a JavaScript debugger, it has a feature that assesses all the code built into a Web page or Web application to assess it for errors. The emphasis with this tool is on error-checking bought-in applications and services.
Key Features
- Webpage debugging: It helps to identify and resolve issues in the code, layout, or functionality of a website.
- Google Analytics integrations: Using analytics tools, you can gather and analyze website data on user behavior.
- Adobe Analytics integrations: Track and analyze user interactions, enabling data-driven decision-making for improved marketing.
- Request exporting and active filters: It allows users to export and analyze specific sets of data.
Why do we recommend it?
We recommend Omnibug because it's a free and open-source tool that helps optimize digital marketing strategies. It supports popular marketing and analytics tools like Google Analytics and Google Tag Manager. Its versatility makes it valuable for professionals dealing with various marketing tools, enhancing their efficiency and insights.
Who is it recommended for?
Omnibug is recommended for digital marketing and analytics professionals seeking efficient tag monitoring. It allows quick filtering of unnecessary tags and searching for requests based on specific criteria. With the ability to add custom notes and download requests to CSV or Tab files, it proves valuable for meticulous tracking and analysis.
Pros:
- Versatility: It is compatible with Google Analytics, Google Tag Manager, Meta Pixel, and many other tools.
- Real-time Monitoring: Omnibug allows users to monitor every deployment in real-time, swiftly identifying errors before they impact users.
- Custom Notes and Downloads: Users can add custom notes to each request found by Omnibug and download all requests to CSV or Tab files, facilitating detailed analysis.
Cons:
- Limited Features for Non-Marketing Tools: Omnibug's primary focus is on marketing and analytics tools, and it may have limited features for users looking to monitor other types of web requests.
8. SplineTech JavaScript Debugger
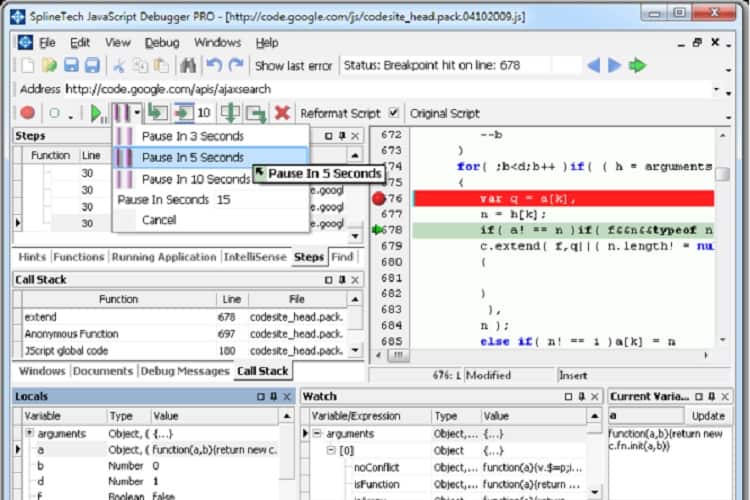
SplineTech JavaScript Debugger is a paid tool that is marketed by the programmer who developed it. Daniel Aroustamoff wrote the first version of this tool in 1999 and he has been updating the system ever since.
Key Features
- Independent JavaScript Debugger:Allows developers to debug JavaScript code separately with efficient debugging capabilities.
- No Java/JVM/JRE required: It is easy to use without the setup and usage of the software to ensure hassle-free experience for users.
- Supports native javascript, Jscript and VB script: You can work with various scripting languages while debugging.
- debug remote JavaScript files: Allows developers to identify and address issues in code hosted on remote servers.
Why do we recommend it?
We recommend SplineTech JavaScript Debugger because it's easy: just type the URL and press Run. It automatically attaches to Internet Explorer, allowing you to step through code at a blazing speed. With advanced features, it will enable debugging without setting breakpoints, making it a unique and efficient tool for developers.
Who is it recommended for?
SplineTech JavaScript Debugger is used by professional developers who want to save time and streamline debugging. It allows skipping boring sections of code, which is particularly useful when dealing with extensive, unfamiliar codebases. It provides a quick overview of the code's structure, making it valuable for professionals debugging large, complex projects.
Pros:
- Facilitates smoother development: You don't need to finetune the code on separate browsers as you can use JQuery overall cross browsers.
- Impressive speed: It is automatically connected to IE; hence, debugging is accessible by simply entering the URL and pressing run.
- Seamless navigation: You can easily navigate back and forth on the multiple code lines while debugging.
Cons:
- Time-consuming for hectic tasks: It might take time or need expert knowledge if the bug is difficult to locate or debug.
This is a software package that installs on Windows. It uses Internet Explorer as its front end and so adapts the standard browser to act as a source code viewer and debugger for JavaScript. The tool allows you to set breakpoints to stop execution at a specific piece of code. You can then step through the code and rewind to look at the behavior of the system as your JavaScript runs.
9. Raygun Error Monitoring
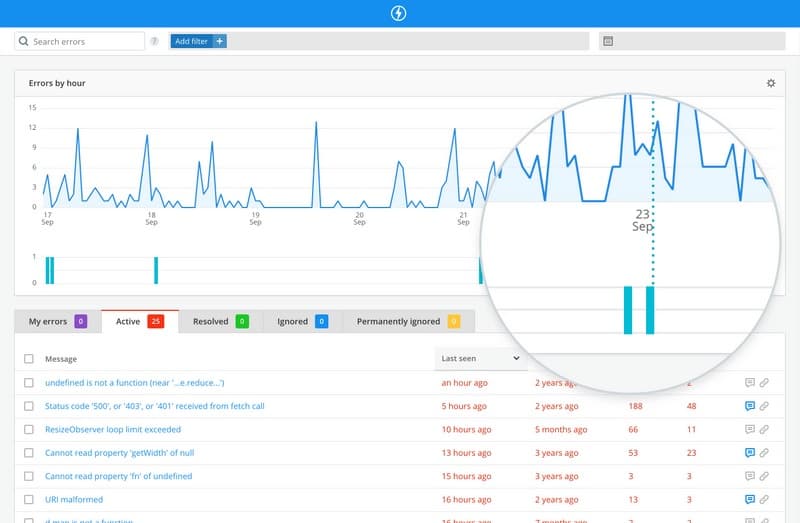
Raygun Error Monitoring and Crash Reporting is a cloud service that monitors the performance of Web pages constantly and spots errors in the code while it is live. The client activates the service by including a snippet from Raygun on the page to be monitored. This code acts as an agent for the Raygun analysis engine. Raygun Error Monitoring is available for a 14-day free trial.
Key Features
- Customizable dashboards: Users can create personalized and customizable dashboards in Raygun, tailoring the display of key metrics and insights.
- Create highly-customizable alerts: Set up highly customizable alerts, ensuring that teams are promptly notified of specific events or issues.
- Crash reporting and real-time monitoring: This tool constantly monitors and reports instantly regarding any issues or unstable performance.
Why do we recommend it?
We recommend Raygun Error Monitoring as it supports wide language and framework support, including .NET, JavaScript, PHP, Ruby, and more. You can easily run it with easy setup using lightweight SDKs and minimal code. Its reasonable pricing allows monitoring for unlimited apps and team members.
Who is it recommended for?
Raygun Error Monitoring is recommended for developers and DevOps professionals seeking real-time deployment monitoring. It allows quick error identification pre-user impact, providing comprehensive details like stack traces, environment, browser, and more. With native integrations for GitHub, Bitbucket, and GitLab, it supports source map decoding, aiding precise issue resolution.
Pros:
- Quick Error Identification: Monitor every deployment in real-time to swiftly identify errors before they impact users, allowing for proactive issue resolution.
- Detailed Error Insights: Raygun provides detailed information about errors, including the full stack trace, environment, browser, version, class name, and host, aiding in precise debugging.
- Performance Monitoring: In addition to error tracking, Raygun offers performance monitoring tools, helping identify and optimize areas affecting overall application performance.
Cons:
- Limited Customization: While Raygun offers comprehensive error tracking, some users may need more customization compared to other dedicated logging or monitoring tools.
The tool keeps running and is active on your pages as long as they can be contacted over the internet. This means you can use the tool while the code is still in development and when it gets to the testing phase before it goes live.
10. JS Bin
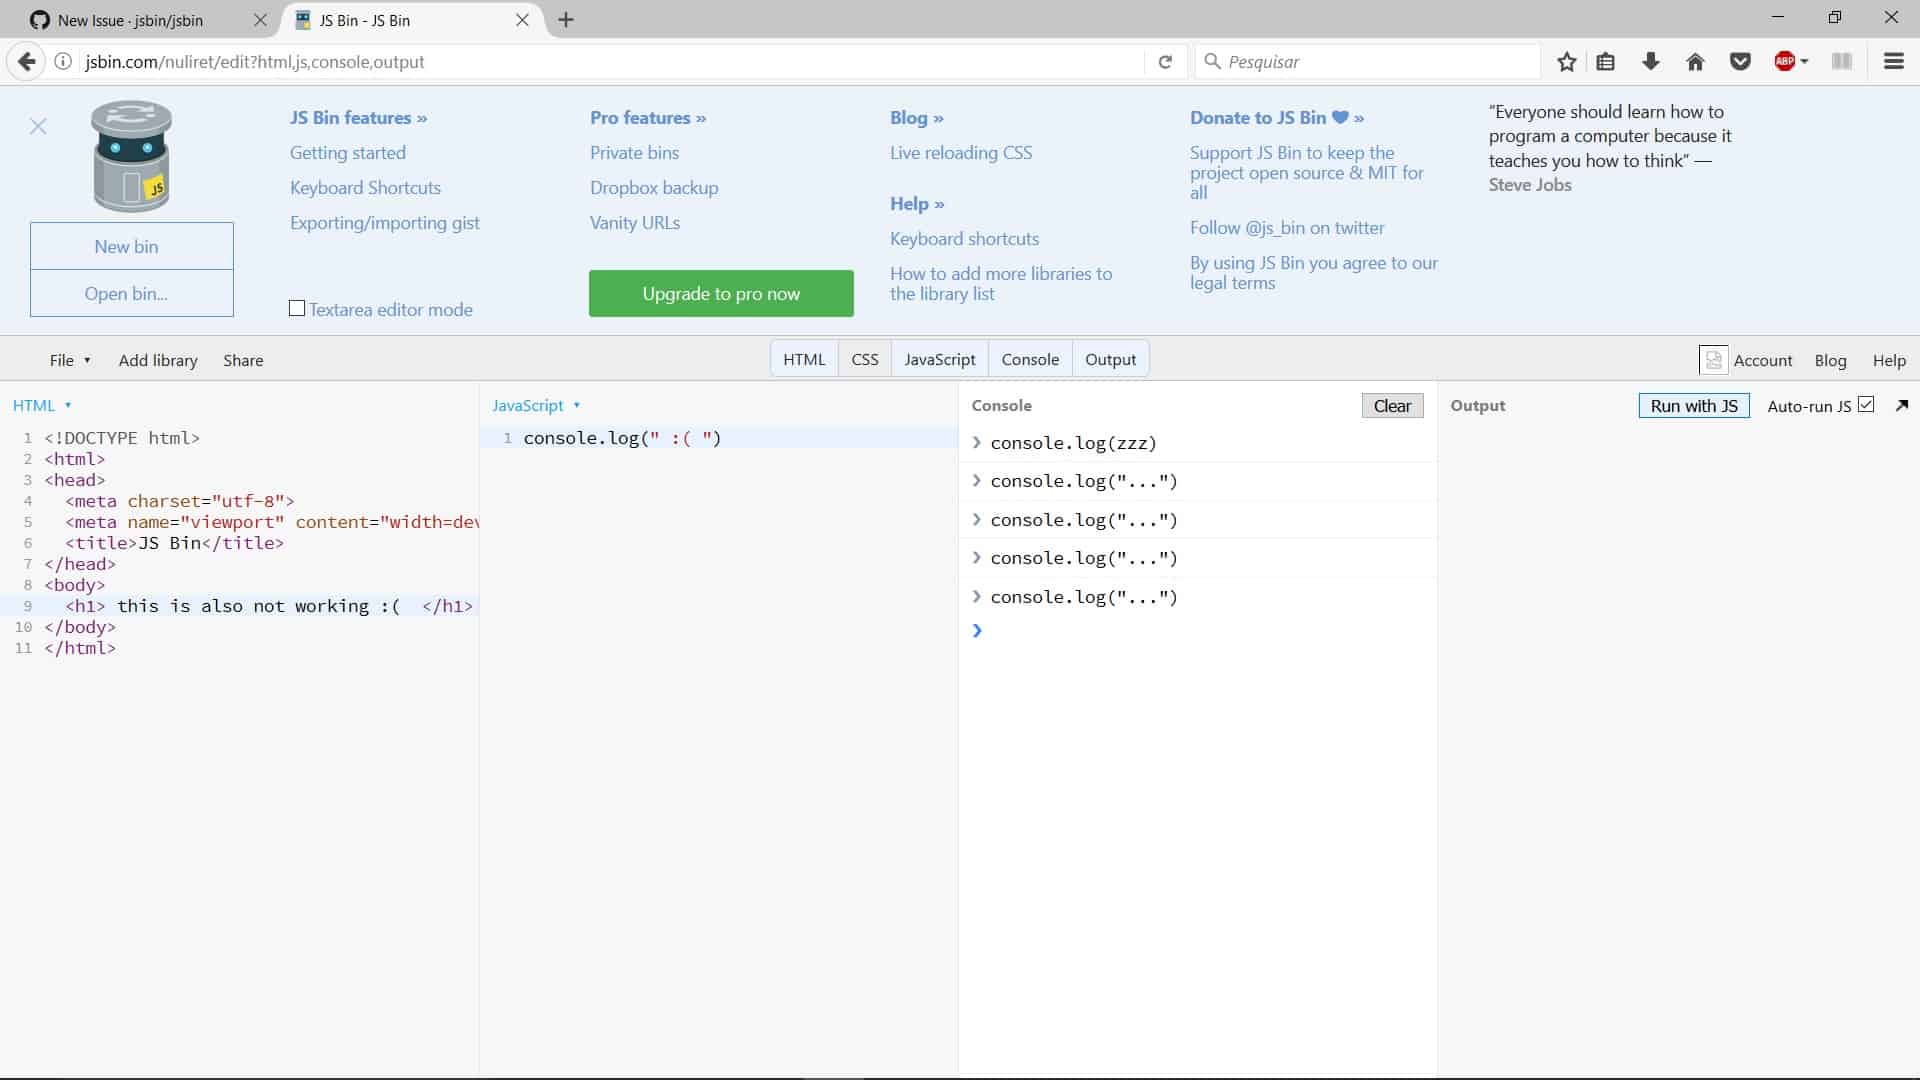
JS Bin is a website that includes a JavaScript editor and tester right on the Home page. There is no privacy in this free tool, which makes it a good tool for collaboration – you just give the URL to colleagues and let them see the code as you write it, so they can make suggestions.
Key Features
- Real-Time Collaboration: It allows multiple developers to work together on the same codebase
- Remote Rendering: Enables developers to view and interact with the output of their code in real-time from different devices.
- Drag and Drop Editing: With the drag and drop feature, it simplifies the process of rearranging and organizing code elements within the editor.
- JavaScript Linting and custom templates: It's easy to highlight potential code issues, and start new projects using custom templates.
Why do we recommend it?
We recommend JS Bin as a top JavaScript collaborative debugging tool. It enables real-time testing and debugging of scripts with instant updates in the output panel. Developers and collaborators can see changes in the code editor reflected instantly, making it a valuable tool for collaborative and efficient debugging.
The interface shows an HTML wrapper, which can also be expanded, so you can test a whole page through its HTML and JavaScript elements.
Who is it recommended for?
JS Bin is recommended for developers seeking efficient and collaborative code debugging. It is accessible on the JS Bin website to ensure real-time collaboration and debugging. Custom template support allows developers to tailor their workspace for personalized, streamlined coding experiences.
Pros:
- Real-time Collaboration: JS Bin supports real-time collaboration, which allows multiple developers to work on the same code simultaneously and see changes instantly.
- Live Preview: Developers can see live previews of their code changes in real-time, making it easy to experiment and visualize the impact of alterations.
- Wide Range of Libraries and Frameworks: JS Bin supports various libraries and frameworks, enabling developers to work with their preferred tools and technologies.
- Customizable Templates: JS Bin allows users to create and save custom templates, streamlining the process of starting new projects.
Cons:
- Limited Features for Large Projects: While suitable for small projects and prototyping, JS Bin may need more features for larger, more complex applications.
To take your code private and get the ability to save work in progress, you need to open up a paid account.
Firebug Alternatives FAQs
What are some popular JavaScript debugging tools?
There are many JavaScript debugging tools available, but some of the most popular ones include:
- Chrome DevTools
- Firefox Developer Tools
- Microsoft Edge DevTools
- Node.js Debugger
- Safari Web Inspector
How do I use a JavaScript debugger in the browser?
The process of using a JavaScript debugger in a browser varies slightly between different browsers, but here are the general steps:
- Open the developer tools in your browser (usually by right-clicking anywhere on the page and selecting "Inspect" or using a keyboard shortcut).
- Navigate to the Sources tab.
- Find the JavaScript file you want to debug and open it.
- Set breakpoints in your code by clicking to the left of the line numbers.
- Refresh the page or run the code that you want to debug.
The code will pause at the first breakpoint, and you can use the debugger to inspect the values of variables and step through the code.
Which is the best alternative to Firebug?
The best alternative to Firebug depends on your personal preferences and the type of projects you are working on. Some popular options include Chrome DevTools and Firefox Developer Tools.
Can I use Firebug in modern browsers?
Firebug is no longer maintained and is not compatible with modern browsers. If you are looking for a JavaScript debugging tool, you should use one of the alternatives mentioned above.
Do I need to install an extension to use a Firebug alternative?
No, you do not need to install an extension to use a Firebug alternative. Most modern browsers have built-in developer tools that you can use to debug your JavaScript code. To access these tools, you can usually right-click anywhere on the page and select "Inspect" or use a keyboard shortcut.

