
Our funding comes from our readers, and we may earn a commission if you make a purchase through the links on our website.
ELB Health Check Guide
UPDATED: March 31, 2023
Amazon’s Elastic Load Balancing (ELB) is one of the world's most popular load balancing utilities that manage some of the largest traffic loads on the internet. Using the load balancing tool, however, requires configuring and setting up ELB health checks in order to work correctly.
In this article, we’ll explore exactly what these health checks are, and how you can configure them quickly and efficiently.
What is Amazon Elastic Load Balancing?
The Amazon ELB system balances traffic automatically across multiple Amazon EC2 instances to route traffic more efficiently and act as a sort of fail-safe when traffic levels rise sharply. The entire solution is composed of three types of load balancing systems.
- Classic Load Balancer (CLB) is the earliest form of load balancing Amazon used to route traffic, and relies on monitoring the requests, connections, and responses of traffic. This form of load balancing is used primarily by applications and services on the Amazon EC2 classic network.
- Application Load Balancer (ALB) operates on the request level and is used heavily to balance HTTP and HTTPS traffic across the Amazon Virtual Private Clouds. This balancing is done on the individual request level for multiple applications and services.
- Network Load Balancer (NLB) works on the connection level and routes TCP and UDP traffic across the Amazon Cloud infrastructure usually through their Virtual Private Cloud (VPC) for hosted services and applications.
- Gateway Load Balancer (GLB) applies these load balancing principles at scale and makes load balancing multiple third-party applications in bulk a simpler task. This can work for dozens of virtual network appliances and allows users better transparency and control over the source and destination traffic.
Together these different load balancing systems work to create granular control and transparency over where application traffic is getting routed to, and how the network reacts to bottlenecks and fluctuations in application demand.
What is an ELB Health Check Do?
ELB health checks measure the network availability of EC2 instances across the Amazon Cloud. The load balancers will query different instances to check if they are still considered healthy. Instances that are working correctly will respond with a code of 200 within the default amount of time which is 30 seconds.
Other instances that fail to respond, or fail to respond in a timely manner will be deemed unhealthy by the ELM health check. The test will label these instances as OutOfService, and the final test will help you visualize how many total instances in your network are up or down.
What Causes ELB Health Checks To Fail?
One of the top reasons an ELB health check will fail is due to misconfiguration. This can either be caused by a setting that was not properly implemented or a security feature that is incorrectly blocking a necessary port.
Below are some examples of the most common reasons why ELB health checks fail.
- Connection timeout Timeouts can occur when the network is under a heavy load, and that particular instance is overloaded. The massive amount of traffic causes the check to take longer than expected to respond, often ending with a connection timeout error or a very long response time.
- Ports on the instance are unopened Health checks require certain ports to be open for communication on the firewall. If some of these ports are closed, or filtered by a particular security service it can stop the ELB health check from starting or finishing.
- Instance not receiving traffic If an instance is not receiving any traffic at all, this is likely due to a misconfiguration. Make sure that instance is actually set up to receive traffic, and check the security group of that instance to see if traffic is getting blocked that is coming from the load balancer.
- Public key authentication failure Load balancers that use encryption protocols such as SSL or HTTPS can experience a public key authentication failure when the public key on the certificate does not match the key on the load balancer. Expired certificates can cause similar errors as well.
- Health check target page error This is a more generic error that could mean a few different things. This error results in a non-200 response code which could indicate that there is no test page configured for the instance, the content-length header is not set, or that the application or service is not configured to receive traffic requests from the load balancer.
ELB Health Metrics to Monitor
There are different types of metrics you can monitor across your instances to ensure that they are healthy and ready to scale with your network.
You’ll want your instances to be responsive, meet fluctuating traffic demand, and provide a quality user experience. If one instance goes down, you’ll want to know if the other instances can keep up with demand during high traffic times.
- RequestCount This is the number of requests that the ELB receives and sends to the EC2 instances during a specified amount of time. This metric measures the total number of traffic that the ELB is handling.
- SurgeQueueLength The number of incoming requests that are waiting to be processed by the ELB. If there are too many requests in too short of a timeframe, the queue can grind to a halt causing high latency, dropped traffic, and timeouts.
- SpilloverCount This is the number of requests that were rejected during a specific time period after the SurgeQueueLength reaches its default limit of 1,024 requests.
- UnHealthHostCount The total number of unhealthy instances that are discovered across the EC2. Ideally, you’ll want the number to be zero, but most networks should aim for no more than 20% unhealthy instances.
- HTTPCode_ELB_4XX The total number of 4XX errors returned during a specific time period. 400 errors indicate failures related to bad requests when the server was unable to process the message due to an issue on the client-side.
- HTTPCode_ELB_5XX This is caused by the load balancer unable to parse the response or indicates a problem with the registered instance. This could cause a bad gateway configuration, an unavailable service, or gateway timeout.
Checking The Health Of Your Instances
Checking on the health of your instances is a simple process, and can be done right from your EC2 console via the instructions below.
- Navigate to your EC2 console.
- In the navigation bar go to Load Balancing and then Load Balancers.
- Choose the load balancer you want to use.
- Under the Description tab click Status to view how many instances are in service.
- Go to the Instances tab and choose Status to see the status of every instance.
If you’re a fan of the AWS command-line interface, you can run the following command to view the same information.
aws elb describe-instance-health --load-balancer-name your-load-balancer
Amazon Cloudwatch Monitoring
The Amazon Cloudwatch platform can be used to monitor ELB health and collect additional performance data on your instances. Cloudwatch is flexible and allows for advanced reporting, threshold-based alarms, and deep performance insights of your EC2 ecosystem.
You can set up monitoring through Cloudwatch by doing the following:
- Under that navigation tab, choose Load Balancing and then Load Balancers.
- Launch your Amazon EC2 console.
- Choose the load balancer you want to use.
- Click the Monitoring tab.
- Choose a graph for the metrics you wish to measure. (Choose the metrics we mentioned earlier in this article or the ones that matter most to you.)
ELB Monitoring Software
If you’re looking to get more detailed information and insights from your ELB health checks, you may want to consider using alternative software. By using a cloud monitor or application monitor platform, you can keep track of all of your networked assets in a single place for management.
Below are a few great Cloudwatch alternatives for monitoring your ELB:
- AppOptics Application Performance Monitoring – FREE TRIAL An application performance manager that can centralize your management, and integrate directly with your Cloudwatch backend.
- Paessler PRTG Network Monitor – FREE TRIAL Flexible application and server monitor that features a custom Cloudwatch ELB sensor.
- Datadog Offers elegant visualizations for real-time reporting and historical data analysis. Works via a simple AWS integration.
- Dynatrace Features ELB monitoring integrations, customizable dashboards, alerts, a mobile app, and AI-powered anomaly detection.
1. AppOptics Application Performance Monitoring – FREE TRIAL
SolarWinds AppOptics is a combination application and server monitoring platform that can integrate with AWS services, including Cloudwatch for ELB health monitoring. With integrations for over 150 brands, AppOptics is one of the most versatile monitoring options on the market, especially if you’re looking to consolidate data from the cloud and on-premises servers.
Key features:
- AWS integration
- Custom tag integration
- Granular control over ELB metrics
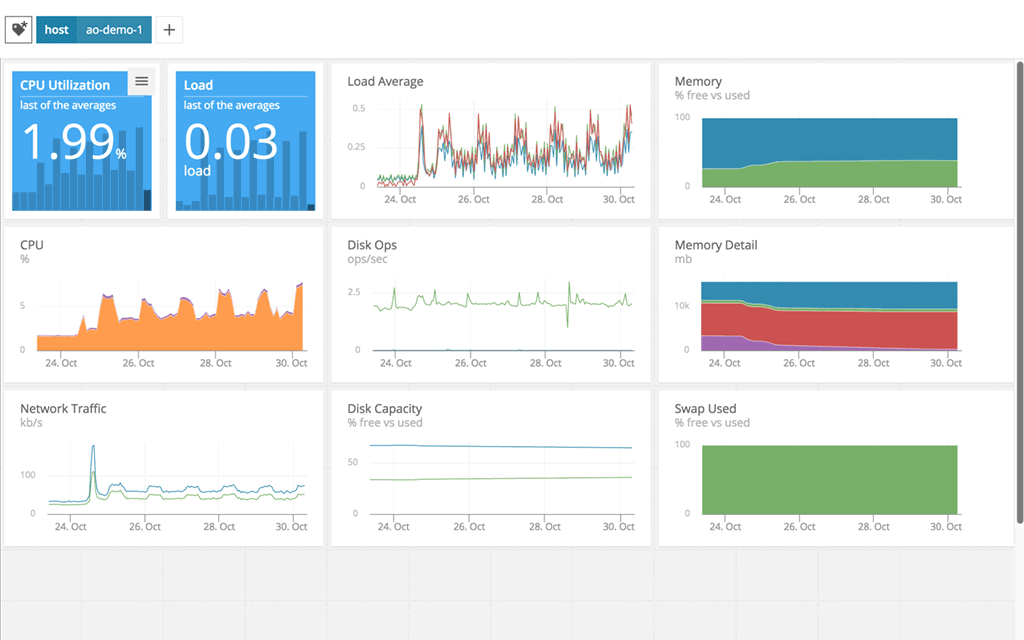
The full-stack monitoring platform deploys through a simple agent that pulls in data from the source and processes it into actionable insights that are displayed through both visualizations and log data.
Specifically, AppOptics can monitor over 40 types of ELB health metrics that are pulled through an AWS CloudWatch integration. This covers the Application Load Balancer, Network Load Balancer, and Classic Load Balancer. The integration is simple and requires the creation of a new AWS IAM role and IAM policy. Once active the dashboard can start populating data within 10 to 15 minutes.
AppOptics can retrieve up to 25 custom tags that are created on your ELB instances as well, allowing you to dynamically manage and organize custom tags if you use them in your environment.
Pros:
- Offers great visualizations reflecting live and historical health metrics and resource consumption
- Is easily scalable cloud service
- Tracks all major resources focusing on over 180 different metrics
- Can monitor Docker, Azure, and Hyper-V platforms, offering more flexibility than competing options
Cons:
- Would like to see a longer trial period
Download
You can test out AppOptics through a free 30-day trial.
https://www.appoptics.com/application-performance-monitoring
2. Paessler PRTG Network Monitor – FREE TRIAL
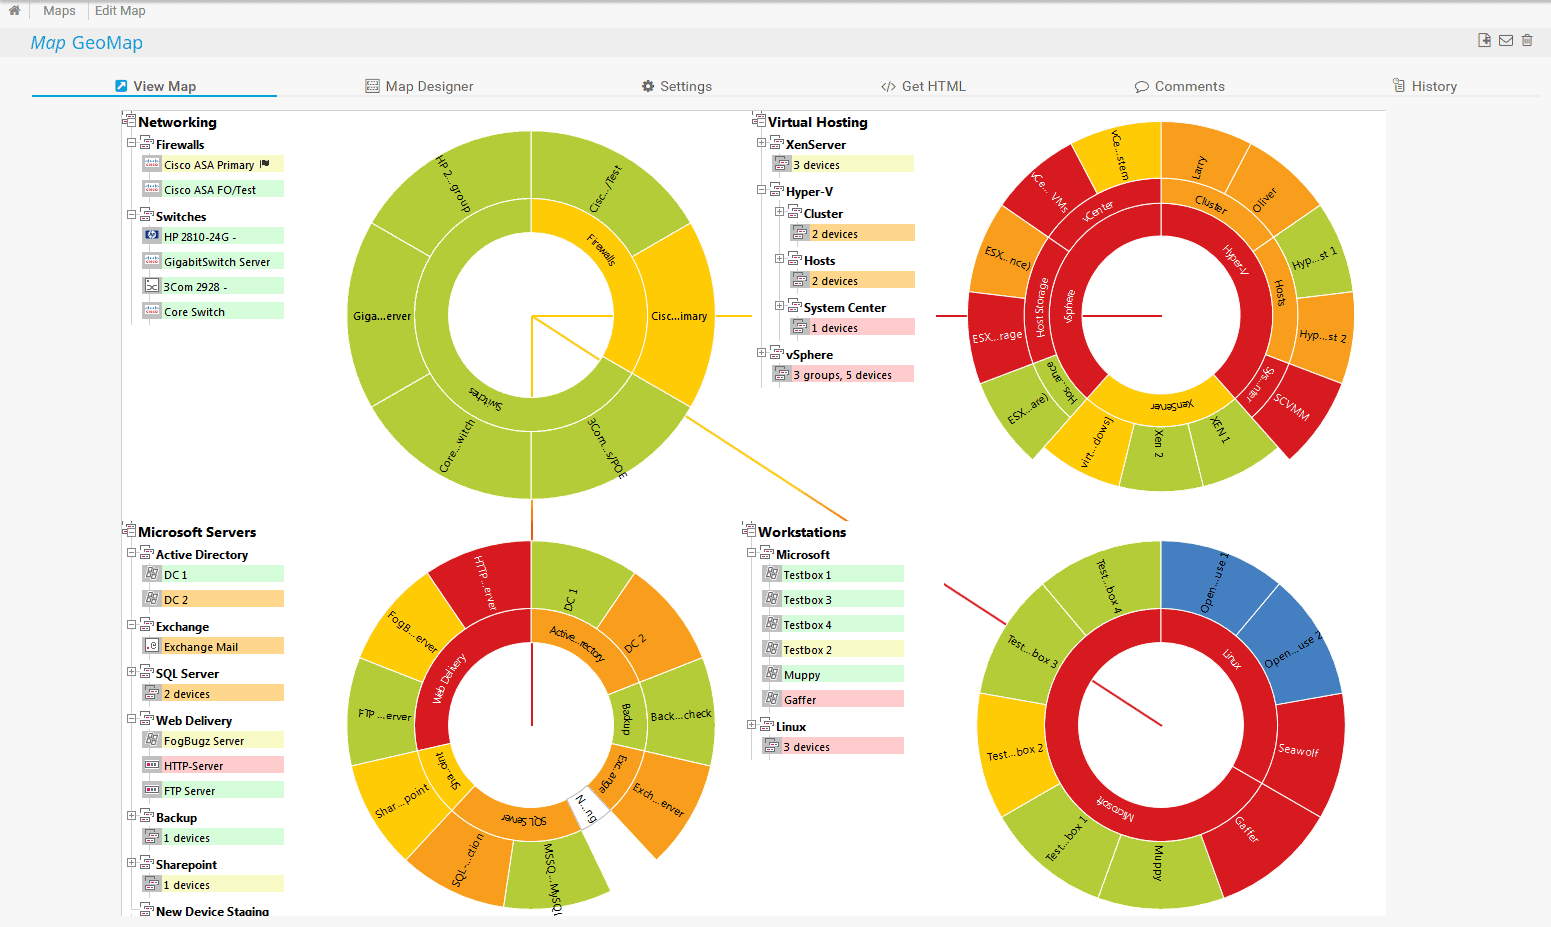
Paessler PRTG Network Monitor is a staple application monitor in the IT community, known for its vast number of integrations and dozens of different customized sensors that can monitor everything from AWS to local Exchange servers. A dedicated Amazon Cloudwatch ELB sensor pulls data from the ELB and displays those metrics both live in real-time, and as a historical record. Metrics such as Backend Connection Errors, Unhealthy Hosts, and HTTP Code Errors are all easily visible and made available on the dashboard. If you’re running an internal help desk, you can configure PRTG to automatically create tickets based on these events, or deploy automated scripts to correct certain issues as they occur.
Key features:
- AWS Cloudwatch integration
- Mobile app
- Powerful reporting engine
Outside of ticketing integrations, the PRTG platform can alert based on thresholds or conditions and features an intelligent alerting system that is designed to detect duplicate alerts, cut down on alert fatigue, and produce fewer duplicate alerts. Alerting can be configured over SMS, email, mobile app, or API integrated into platforms such as Slack.
Templates can easily be made from reports and exported to CSV, PDF, or HTML which makes it easy to draft internal reports for the tech team, as well as high-level reports for C-level executives and board members.
PRTG is a great choice if you’re not only looking for a Cloudwatch alternative for ELB monitoring but also looking at monitoring other services and applications across your network.
Since PRTG is so robust, it’s designed to scale with even the largest enterprise networks, making it a solid choice for larger more established networks. Since PRTG works with customized sensors, you can use PRTG to monitor both cloud resources as well as on-premises servers and applications.
Pros:
- Uses a combination of packet sniffing, WMI, and SNMP to report network performance as well as discover new devices
- Autodiscovery reflects the latest inventory changes almost instantaneously
- Drag and drop editor makes it easy to build custom views and reports
- Supports a wide range of alert mediums such as SMS, email, and third-party integration
- Supports a freeware version
Cons:
- Is a very comprehensive platform with many features and moving parts that require time to learn
The platform allows you to test 100 sensors completely for free. If you want to test monitoring beyond the 100 sensors you can sign up for a free trial.
Download
You can test out Paessler PRTG Network Monitor through a free 30-day trial.
https://www.paessler.com/aws-monitoring
3. Datadog
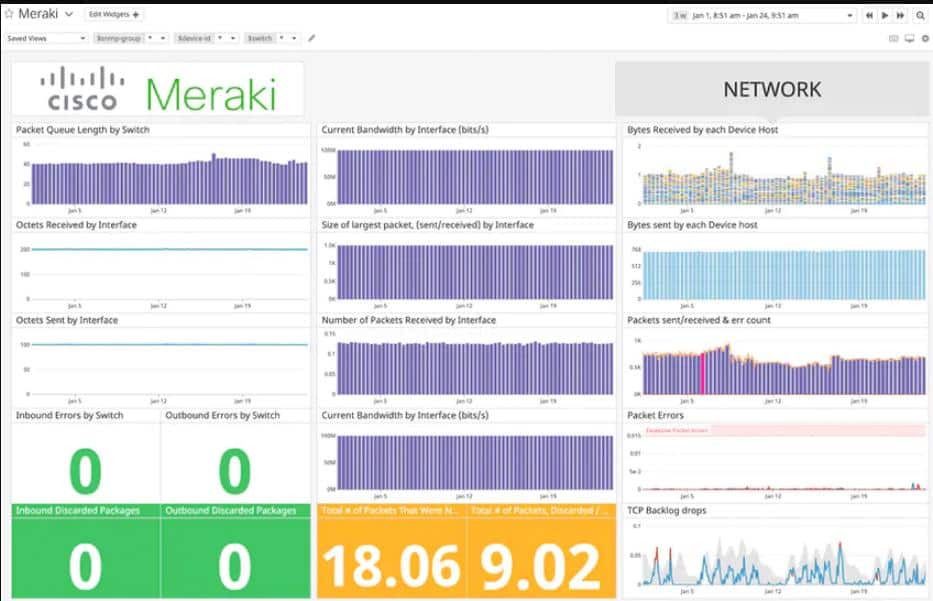
Datadog is a cloud-based application monitoring tool that allows you to easily monitor cloud and hybrid-cloud environments. Through its Amazon Web Service integration, you can collect performance metrics as well as errors from the ELB and monitor the traffic to and from each instance as well.
Key features:
- AWS integration
- Anomaly detection
- Mobile app
The platform has some of the best dashboards available in the application monitoring space and is completely customizable for teams and individual users. You’ll be able to easily visualize your traffic, requests per second, error rate, and average latency.
Datadog has additional features and services that complement organizations that leverage AWS, such as their Real User Monitoring and AWS Web Access Firewall integrations for applications hosted on AWS VPC.
Powerful AI-based anomaly detection can alert you about performance issues and deviations from a dynamic baseline of your historically recorded metrics. Datadog does an excellent job at providing you the tools to create automated alerts based on these fluctuations, or execute automated scripts when certain conditions or thresholds are met.
With the entire platform cloud-based, there are no complicated installations or onboarding procedures, so you can rest assured that maintenance and updates are already being handled as part of your monthly service agreement.
Pros:
- Has an excellent interface, easy to use, and highly customizable
- Cloud-based SaaS product allows monitoring with no server deployments or onboarding costs
- Can monitor both internally and externally giving network admins a holistic view of network performance and accessibility
- Supports auto-discovery that builds network topology maps on the fly
- Changes made to the network are reflected in near real-time
- Allows businesses to scale their monitoring efforts reliably through flexible pricing options
Cons:
- The trial could be longer
Datadog is a great option, especially if your organization is growing and looking for a pricing model that is proportionate to the size of the network. You can test out Datadog free through a 14-day trial.
4. Dynatrace
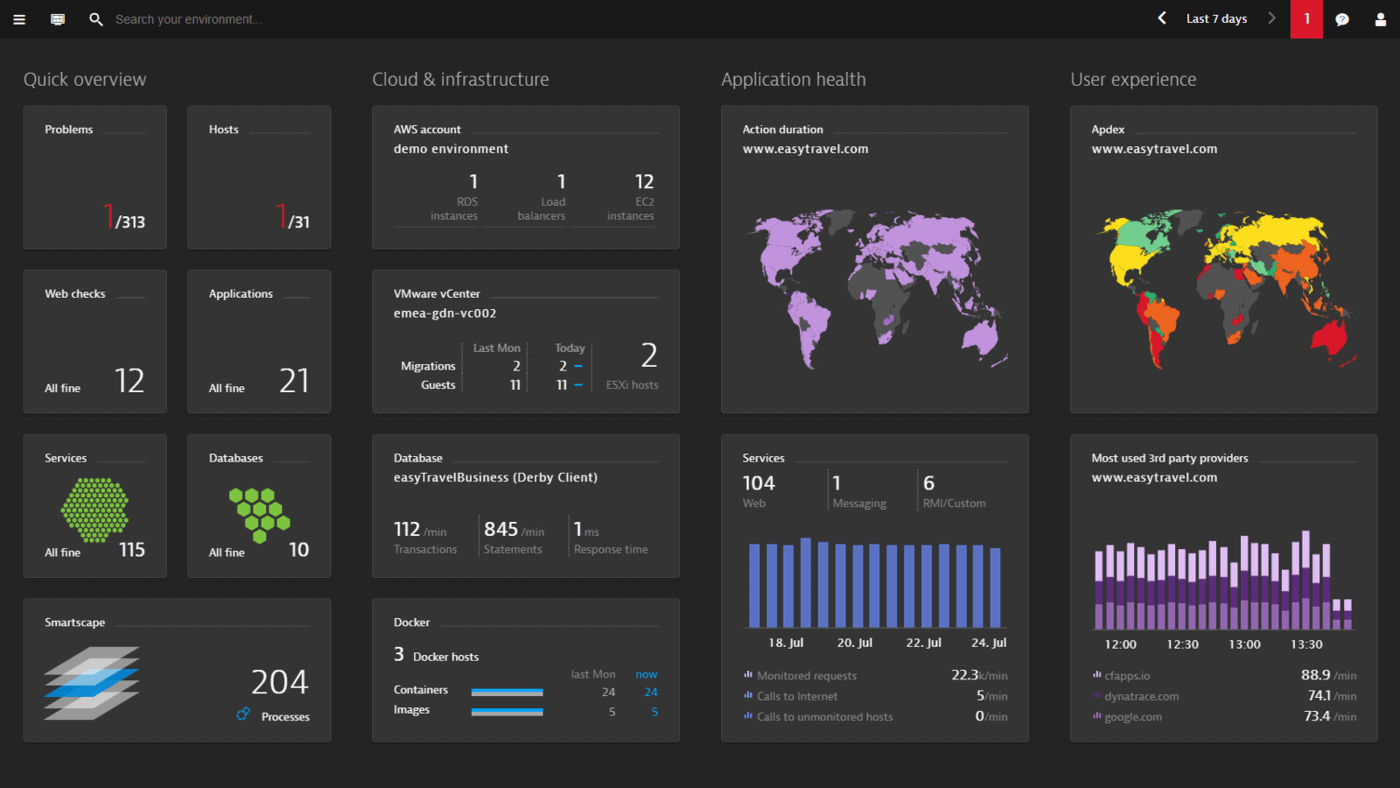 Dynatrace is another powerful application performance monitor that heavily relies on artificial intelligence to detect anomalies and recognize patterns. This combination of data-driven insights helps cut down on time spent troubleshooting and provides administrators with actionable insights to know what’s a priority, and what can be tasked later.
Key features:
- Customizable dashboard
- Easy integration with AWS
- AI-powered anomaly detection
The platform integrates with AWS and Cloudwatch to pull your ELB metrics into the Dynatrace dashboard. Performance metrics such as failure rates, latency, number of requests, connection errors, and HTTP errors are all recorded and visualized for analysis.
Anomaly detection not only highlights suspicious changes for human review but also acts to pinpoint the root cause of issues. This is known as root cause analysis, and it drastically helps cut down on the time it takes to diagnose a problem.
This is great for all businesses but can be even more beneficial to MSPs who manage AWS services for their clients. Root cause analysis can help ensure SLAs are being met and can reduce the time it takes to close open tickets.
The entire Dynatrace platform is incredibly flexible, and currently supports additional integrations with over 500 different technologies. This is good new large networks that rely on a host of different tools and platforms to receive alerts, manage network infrastructure, and coordinate team communications.
While Cloudwatch offers simple ELB metrics and reporting, Dynatrace takes it a step further by acting as a proactive monitoring and automation tool. Dynatrace can be used by any organization but many of its features truly shine in larger more complicated networks.
Pros:
- Can secure and monitor complicated Google Cloud/hybrid cloud environments with ease
- Sleek, customizable interface – great for NOCs
- Real-time LAN and WAN monitoring that supports virtual environments, great for MSPs and large enterprise networks
- Leverages AI to detect trends and monitor baseline performance
Cons:
- Dynatrace is better suited for larger networks and enterprise organizations
- Would like to see a longer trial
You can test out the Dynatrace platform through a free 15-day trial.
Conclusion
ELB health checks are vital to ensuring your cloud services are not only running smoothly but are prepared for unexpected traffic spikes and instance failures. By keeping tabs on your instances you ensure your customers are able to access your services even during peak usage times.
While Cloudwatch may work for smaller businesses, many organizations that have service offerings hosted in AWS will greatly benefit from platforms such as SolarWinds AppOptics or Datadog. By combining these metrics in one place, you’re able to better prioritize maintenance tickets, and get a holistic view of how healthy your overall network environment truly is.
ELB Health Check Guide FAQs
How does an ELB health check work?
An ELB health check works by sending periodic requests to instances in an EC2 instance group and checking the response of those requests. If the response indicates that the instance is unhealthy, the ELB will mark the instance as unhealthy and stop routing traffic to it.
What are the types of ELB health checks?
There are two types of ELB health checks: TCP and HTTP.
How can I customize the settings for an ELB health check?
You can customize the settings for an ELB health check by specifying the timeout, interval, and number of consecutive failures required before marking an instance as unhealthy when you create or modify an ELB.
What is the impact of an unhealthy instance on an ELB health check?
If an instance is marked as unhealthy by an ELB health check, the ELB will stop routing traffic to that instance and route traffic to other healthy instances.
How can I monitor the status of an ELB health check?
You can monitor the status of an ELB health check by using the Amazon EC2 console or the AWS Command Line Interface (CLI).

