
Our funding comes from our readers, and we may earn a commission if you make a purchase through the links on our website.
collectd Beginner’s Guide

UPDATED: October 23, 2023
The data collection program named collectd is used for monitoring. It runs continuously as a background process (daemon) and only wakes up to collect system and application performance metrics. It does a wonderful job collecting metrics— but that’s it.
To get the real value from that collected data, you’ll need to integrate collectd with other tools. But, no worries, collectd has your back. It currently comes with over 130 plugins to extend your monitoring to different systems and apps.
In this collectd beginner’s guide, you’ll learn the basics of the collectd world. You will learn about its plugins, its limitations, and its strengths. You will also learn how to install it (in Linux), how to configure its plugins, and finally, how to see some graphs.
Table of Contents
- What is collectd?
- Plugins for collectd
- Strengths of collectd
- Limitations of collectd
- How does collectd integrate with other tools?
- How to set up collectd?
- Set up collectd monitoring
- How to see the collectd graphs?
- FAQ
1. What is collectd?
The metrics collection Unix-based daemon named collectd is written in C. It gathers performance metrics regularly from different sources, including operating systems, applications, external devices, and log files. collectd also stores the results in various ways and makes them available across the entire network.
System admins can configure collectd for performance and use it in a vast number of use cases. collectd can run in different environments (OS), including Linux, macOS, FreeBSD, OpenBSD, and OpenWRT. In addition, you can also run collectd on Windows via Cygwin or SSC Serv.
What can you do with collectd?
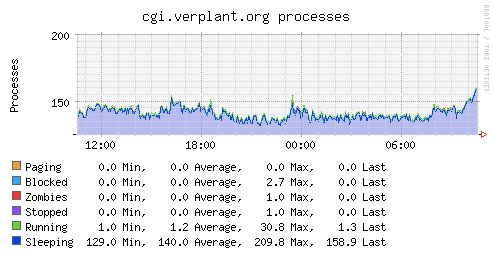
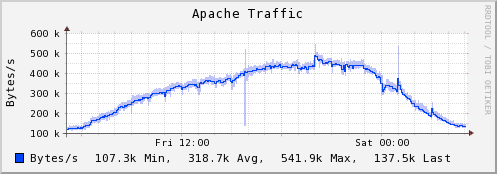
You can use the collectd statistics to keep track of systems and apps, analyze performance, pinpoint bottlenecks, or predict system load. In addition, collectd also provides a series of graphs to enhance your monitoring efforts.
Below is an example of the graphs created with the data collected by collectd.
2. Plugins for collectd
The collectd daemon is based on a modular architecture. Being modular, at its core, doesn't offer much value, but this is where plugins do the magic. collectd supports more than 130 open-source plugins. The collectd plugins are what make this tool highly flexible and extensible.
It consists of the following different types of plugins.
- Read plugins These types of collectd plugins gather different metrics such as system resource utilization and activity. It also collects application, database, and network performance metrics.
- Write plugins These types of collectd plugins write the data collected by the read plugins to tools like RRD files CSV files (for graphing and data structure). These plugins can also send data to other collectd demon instances or applications such as Redis, Graphite, MongoDB, etc.
- Read/Write plugins Some plugins can do both reading and writing. These plugins include the Network, MQTT, AMQP, and UnixSock.
- Binding plugins These plugins help collectd extend to other programming languages (outside C). Binding plugins write plugins in different types of languages, such as Python, Java, Lua, or Perl.
- Logging plugins These collectd plugins collect log messages and write them in specific log formats. Logging plugins can also transfer logs into log servers like Syslog. Examples of these plugins are LogFile, Log Logstash, and Syslog.
- Notification plugins These plugins support monitoring and notification processes to inform the user about something. Examples of notification plugins include Email, Nagios, and Desktop.
- Other Plugins These are different types of plugins outside any classification: the Threshold and the UUID plugin. The threshold plugin is vital for monitoring and notification because it checks whether performance values are within an acceptable range or fall within an unacceptable limit.
It has a comprehensive knowledge base of all its features and plugins. Check collectd’s official list of all the plugins, along with an advanced version on how to install them. All the plugin items on this list are clickable.
3. Strengths of collectd
It is a skilled metrics collector. At its core, collectd runs in the background and collects vital app and system performance metrics. These metrics are especially useful when it comes to monitoring. They can help admins tell when there is a problem about to happen, optimize current resources, or troubleshoot past events.
Below are some of collectd’s core strengths.
- It is free and open-source The software is 100% free. You can implement and scale your collectd environment to as many systems as you see fit. Also, being an open-source software brings more advantages. First, it allows developers more freedom and flexibility to customize the software. Second, open-source software is also more secure and high quality.
- Lightweight collectd is written in C; this makes collectd portable, responsive, and efficient. In addition, this also makes collectd run on systems without cron demon or scripting language. The daemon is very light (including the agent) and has a small footprint on memory and disk utilization.
- Wide compatibility collectd can be installed in various Linux distributions, including Debian/Ubuntu, Fedora, FreeBSD, and Solaris. It can also run on OpenWrt (for home routers) and Windows machines (via SSC Serv).
- Built-in plugins The daemon comes with more than 130 different plugins. These plugins range from simple tasks (uptime, memory, or CPU) to technology-oriented plugins (MySQL, Nagios, etc.). A few other examples of these plugins are memory, JVM, Apache, Postgres, etc.
- Handles many metrics The daemon comes with various features and optimizations to handle a wide range of metrics. By default, collectd enables CPU, interface, and memory plugins, but you can also enable more.
- Powerful in networking Many collectd plugins focus on networking (ranging from SNMP, Syslog, uptime, wireless, etc.). In addition, there is also a dedicated Network plugin that helps you collect performance data from multiple hosts and centralize it on a single server.
- Extensibility One of the strengths of collectd is its extensibility. A collectd server can be turned into a central point for multiple collectd agents by extending the data collection and forwarding capabilities.
- Active community and documentation collectd has an active development and support community. It is also well documented.
4. Limitations of collectd
Although there are quite a good amount of benefits of using collectd, there are some limitations that need to be mentioned in this beginner’s guide.
-
- It lacks graph generation capabilities collectd cannot generate graphs. However, it does come with the RRDtool plugin, which writes to RRD files. RRDtool is an open-source, high-performance data logging and graphing system for time-series data. Note: Even though collectd is designed to “collect” data and not to graph, it can run with simple scripts like kcollectd.
- It is limited in monitoring. collectd’s monitoring capabilities are minimal. Monitoring in collectd comes down to simple threshold checking. But still, there are monitoring plugins, such as Nagios, that use the monitoring values collected from collectd.
- Its management and configuration can be challenging collectd does not offer any way to manage agents actively. For instance, when you distribute collectd agents, you would need to manage them actively. Additionally, collectd lacks an interface to configure and manage its state.
- Support for containers Running a containerized environment with collectd can be challenging. Its maintenance and operational costs will undoubtedly increase as your container environment grows.
5. How does collectd integrate with other tools?
It is a fantastic tool for collecting metrics, but to get the actual value, you need to integrate it with other tools. As you might already know, collectd is flexible thanks to its 130 plugins ranging from read, write, notifications, etc.
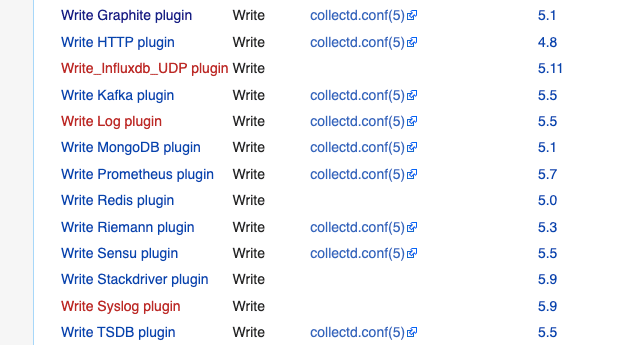
With collectd, you can, for instance, collect the metrics from a host and send them to any other computer or server or write the collected data into another tool. Examples of popular collectd write plugins (integrations) are Graphite, ElasticSearch, Logstash, Carbon, RRDtool, Influxfb, Kafka, MongoDB, Prometheus, Redis, Riemann, Sensu, Stackdriver, and more.
Below is a picture of some of these integrations (via write plugins).
You can also integrate collectd via the Read plugins, where collectd simply gathers different metrics from a specific utility. Popular examples are NetApp, MySQL, Oracle, Apache, Graphite, and more.
As an example, let’s take a look at some details of the Graphite Write Plugin.
- Graphite provides the appropriate monitoring and visualization capabilities. It takes the numeric time-series data collected by collectd and creates graphs.
- To integrate Graphite with collectd, you need to load the Graphite plugin. With the collectd write plugin (write_graphite), you can export metrics to Graphite.
- To integrate Graphite, you’ll need to ensure the Graphite services are running. You will also need to load the plugin and configure the collectd.conf file
In the following section, we will go step by step into the entire collectd integration process. We will integrate collectd to Apache.
6. How to set up collectd?
The following section describes how to set up collectd step-by-step. We will install collectd and configure a few of its global settings.
a. Let’s install collectd
We will use a Debian 11 Linux virtual machine instance to illustrate how to install collectd step-by-step. After installing collectd correctly, we will set it up to monitor an Apache Web server.
- Update the apt database with the following command:
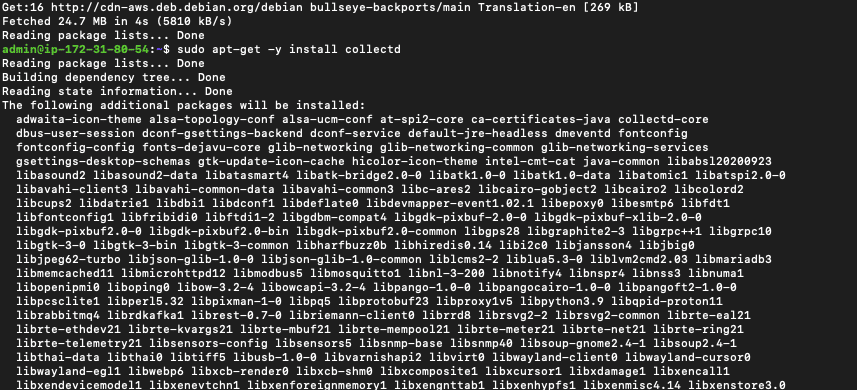
sudo apt update - The installation process is pretty straightforward. Install collectd using the following command:
sudo apt-get -y install collectd
- Once the installation is done, ensure the service is up with the following command:
$ sudo service collectd status
- If the collectd service is not running, use the command:
$ sudo service collectd start
b. Configure global settings
- On your collectd host, open the /etc/collectd directory and locate collectd.conf.
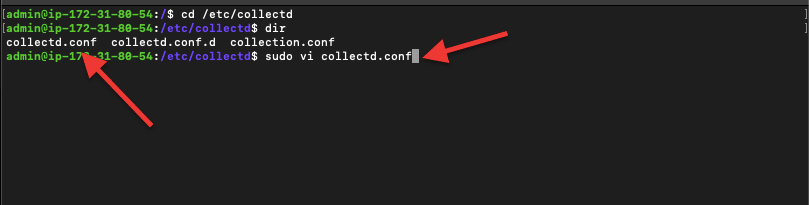
- Use your favorite text editor (i.e., vi or emacs) to open the collectd configuration.
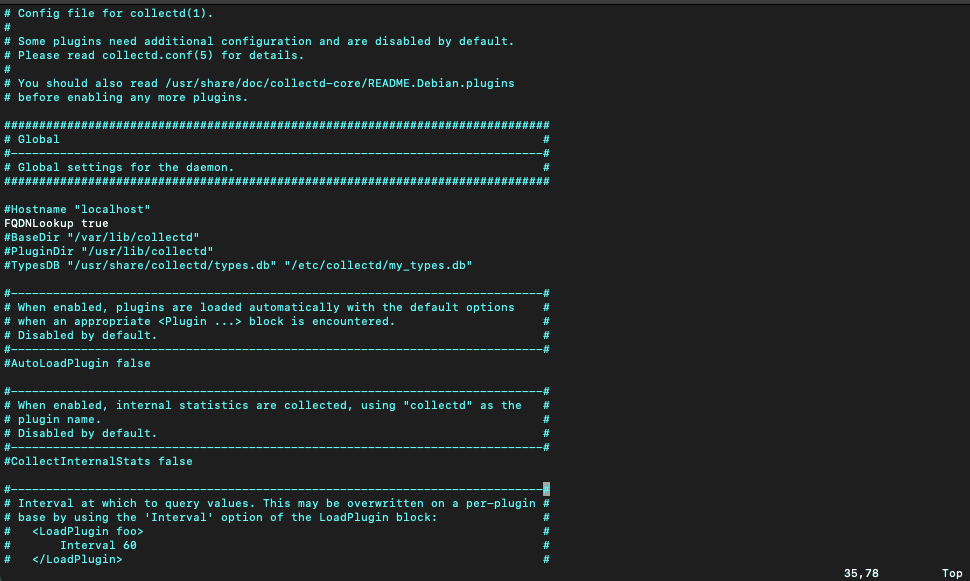
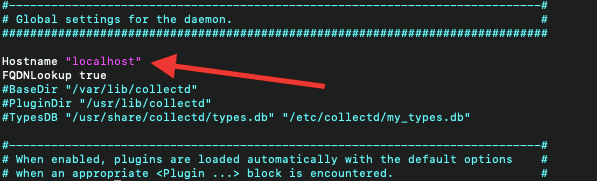
- Before you move into configuring any monitoring plugin, let’s configure some global settings for the daemon. Let’s set up the hostname of the machine where collectd and Apache are hosted.
- Remove the comment and add whatever name you want, for instance, Apache_host, or leave it as localhost.
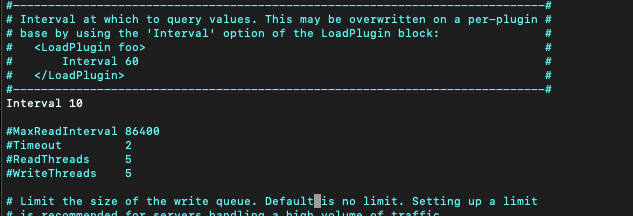
- You can also change the interval that collectd needs to wait before querying data on the host.
- The global interval setting (in seconds) sets the collection metrics time for all plugins. Remove the comment (#) and change the interval to your requirements.
7. Set up monitoring with collectd
In this section, we will go through the steps on how to set up monitoring. We will start by preparing the host and followed by configuring the plugin. We will close the section with troubleshooting.
a. Prepare the host (Configure Apache)
As an example, we are going to set up the Apache plugin. Although we could send metrics to another machine with “write plugins,” we are using collectd on the same Apache machine. We will collect metrics from an Apache server, so we need to ensure Apache is configured correctly and running. We have Apache 2.4.54 (Debian version) running on our VM.
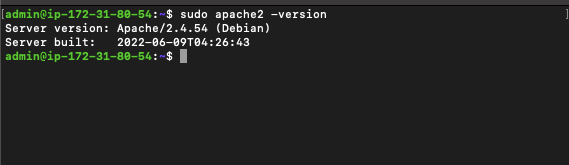
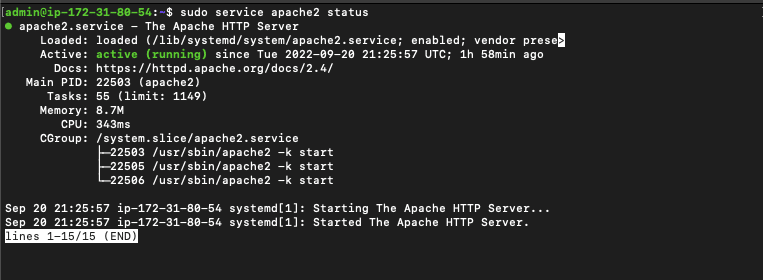
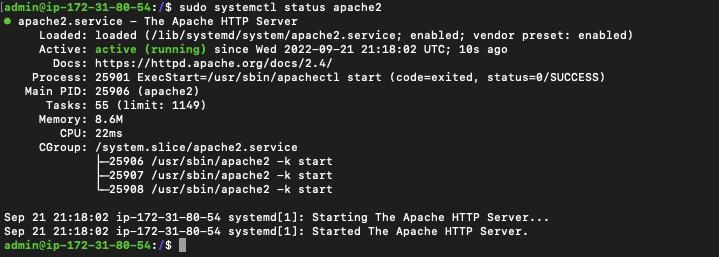
- Check the Apache service with the command and ensure that the service is running:
sudo service apache2 status
Note: Bear in mind that plugin configuration varies from plugin to plugin.
- Now, let’s verify the Apache status configuration To configure collectd’s plugin, you’ll need to load Apache-plugin mod_status and enable the ExtendedStatus directive.
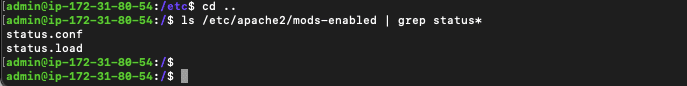
- Ensure ExtendedStatus is on and enable the mod_status The Status module allows a system admin to know the current performance of the server. It presents an HTML page that shows the current Apache server status in an easy-to-read format. By default, Apache comes with the mod_status enabled. But still, you can verify it by going to the mods_enabled directory and looking for the correct files. As shown in the picture below, make sure that status.conf and status.load are present.
- You can use the command:
$ ls /etc/apache2/mods-enabled | grep status*
- If these files are not there, you’ll need to enable the mod_status module with the following command:
sudo /usr/sbin/a2enmod status
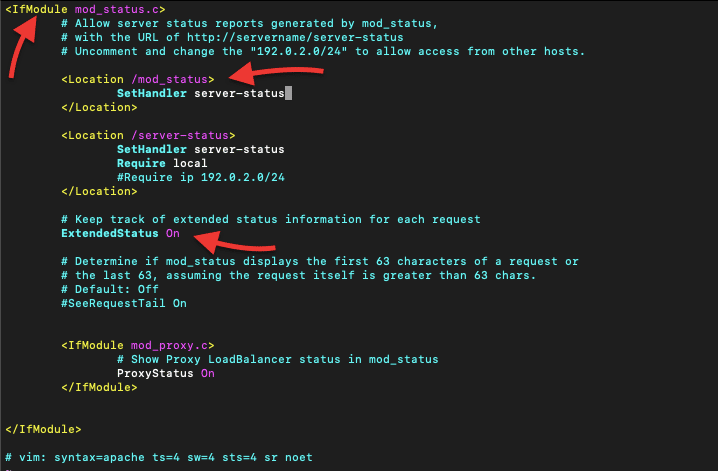
- In this “status.conf file”, add the following lines (or ensure they are as follows):
ExtendedStatus on<IfModule mod_status.c><Location /mod_status>SetHandler server-status</Location></IfModule>
- If the collectd is on another host You can also set the Require IP directive to configure the IP address of the computer you will be accessing the Apache server from.
- Save the changes and restart Apache to ensure that the changes take effect.
$ sudo systemctl restart apache2$ sudo systemctl status apache2
b. Configure the collectd plugin
Note: Bear in mind that some plugins would work out of the box, while others would need some configuration.
- Now, let’s make sure that the Apache plugin is enabled. Let’s open the collectd.conf file again.
- Go to the /etc/collectd directory and locate collectd.conf.
- Then, use any text editor to change the configuration lines.
$ sudo vi collectd.conf
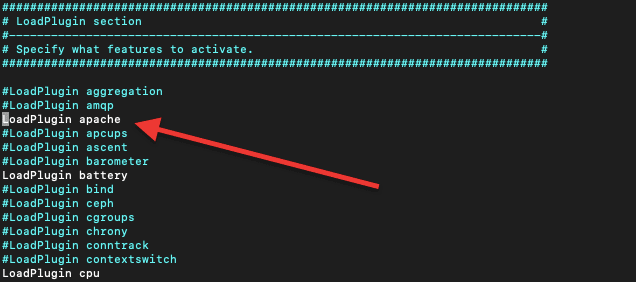
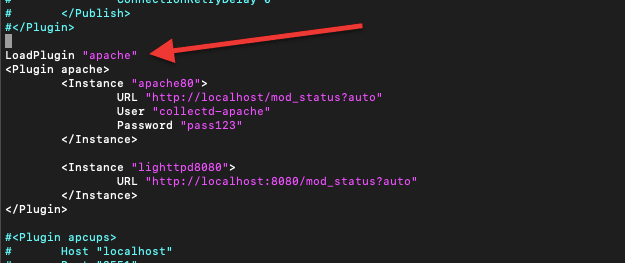
- You’ll notice that by default, collectd has some plugins already enabled, such as the battery, CPU, disk, interface, etc. Find the “LoadPlugin section” and locate “LoadPlugin apache.” Activate it by removing the comment.
- If you scroll down the collectd configuration file, you’ll also find each configuration section for each particular plugin. Find the particular block for Apache <Plugin apache>.
- The Apache section looks as follows:
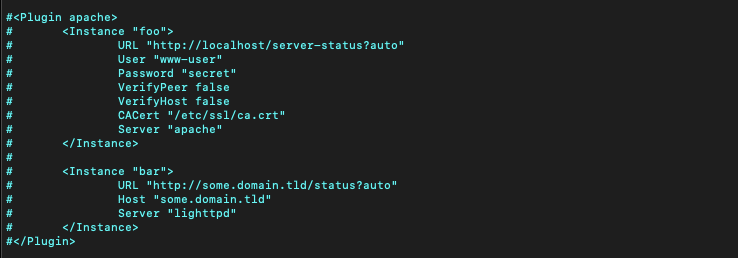
- As you might have noticed, the Apache plugin configuration consists of many <instance/> blocks where each block requires a name (one string argument).
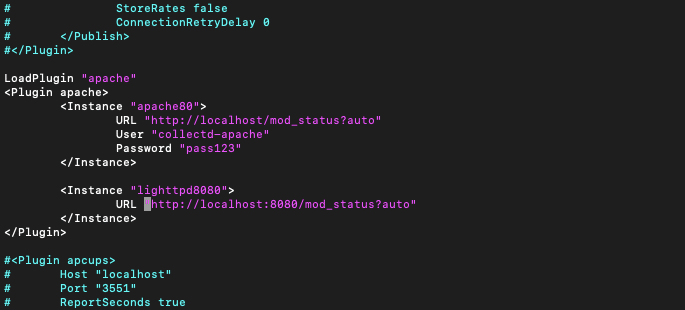
- Remove the comments and change each instance block, as an example:
- LoadPlugin ”apache”
- <Plugin “apache”>
- <Instance “apache80”>
- URL “http://localhost/mod_status?auto”
- User “collectd-apache”
- Password “pass123”
- </Instance>
- <Instance “lighttpd8080”>
- URL “http://localhost:8080/mod_status?auto”
- </Instance>
- </Plugin>
Note: Make sure that URL and IPs are reachable.
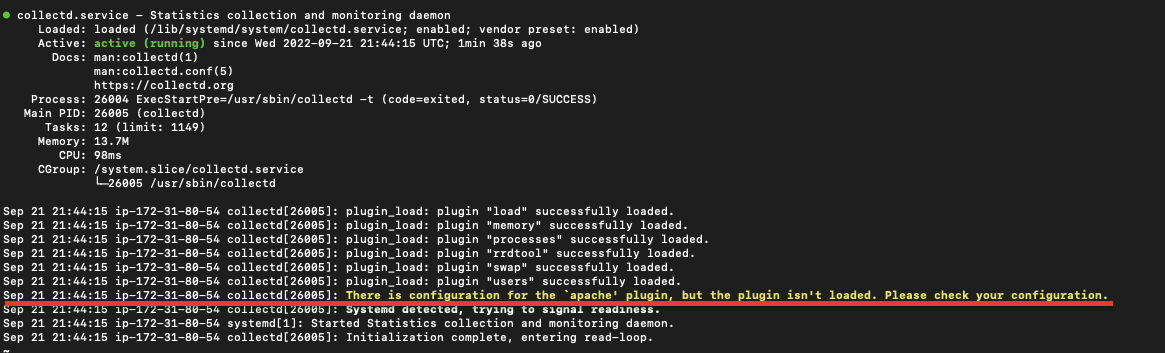
- Once you have edited the collectd file, you’ll need to restart the “collectd” service and check its status:
$ sudo systemctl restart collectd$ sudo systemctl status collectd
c. Troubleshooting
- Check the results. If you got the following message: There is a configuration for the ‘’apache plugin,” but the plugin isn’t loaded. Please check your configuration.
- To load the plugin, go back to the collectd.conf file again.
- Go to the /etc/collectd directory and locate collectd.conf. Use a text editor to change the configuration
- $ sudo vi collectd.conf
- Add the line: LoadPlugin ”apache”
8. How to see the collectd graphs?
a. Set up collectd’s web app to generate graphs with Collection 3
So far, we have installed collectd and set up its monitoring (apache plugin as an example). But as you might already know, collectd focuses on collecting data and delivering it to other front-ends (plugins) so that they can graph and display this valuable collected data. collectd does not graph data by itself!
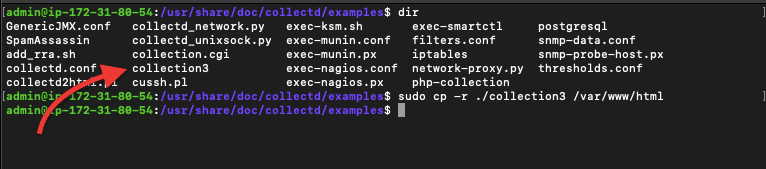
It comes with collection 3 — a web-based front-end to RRD files. Collection 3 is a simple set of Perl-based CGI scripts (created by collectd) that can be used to display graphs.
- Find the collection 3 directory and copy the collection3 file. To do this, go to: /usr/share/doc/collectd/examples/
- Copy the directory to the base directory for your website; for instance, /var/www/html
- Use the following command:
$ sudo cp -r ./collection3 /var/www/html
- Now that you copied this directory to the base directory of your Apache website, you’ll have to install the CGI module. Apache does not know how to run CGI scripts, so it will simply display a text file. You’ll have to install the CGI module aside to help Apache read these scripts.
- To find the configuration file, go to /etc/apache2/mods-enabled
- To enable the CGI module on Apache, use the following command:
sudo ln -s ../mods-available/cgi.load
- Now go to /etc/apache2 and access the apache2.conf file. For other distros, you’ll have to change httpd.conf.

- Access your favorite text editor (vi or emacs) and add the following lines to the apache2.conf file.
- <Directory /var/www/>
- Options +ExecCGI
- AddHandler cgi-script .cgi
- </Directory>
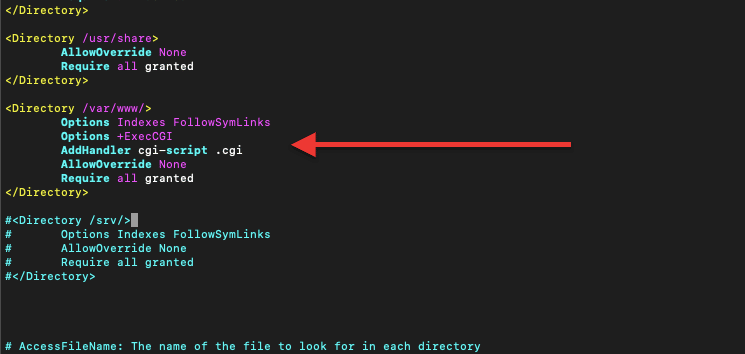
- After editing the conf files, you’ll need to restart the apache2 service. You can use the following command to restart the service.
sudo systemctl restart apache2
- And you can also ensure the service is up with the command:
sudo systemctl status apache2
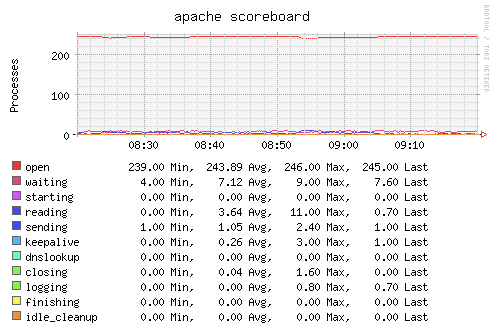
b. See the graphs
Now you have set up and enabled collectd to start generating graphs, go to http://localhost/cgi-bin/collection3/bin/index.cgi on your web server's browser. Here you’ll be able to see some graphs. For instance, below is a picture of the Apache Scoreboard.
collectd Beginner’s Guide FAQs
How to use collectd?
collectd runs in the background (being a daemon) and automatically gathers vital system metrics that can be used for monitoring. To use collectd, you’ll need to configure its plugins (write, read, notify, log, etc.) that collect data and integrate it with a visualization, logging, or interface tool.
Where is the collectd conf file?
On Linux or Unix-based systems, the collectd.conf file is usually in the /etc/collectd directory.
Where does collectd store data?
collectd stores data in different directories for each particular loaded plugin. For instance, for RDD files, it stores data in /tmp/rrd (so the content will be lost at each reboot). But if you want to save data persistently, you can change this directory. When you enable and load the RRDtool plugin (in the collectd.conf file), you’ll also be able to set the storage directory (under the DataDir directive).
How to install collectd on an Ubuntu 22.04 LTS (Linux)?
Ubuntu 22 no longer has the collectd-core package, so the command “sudo apt-get -y install collectd” won’t help you. But there is a workaround. You can install the collectd-core latest version from Debian Packages (dpkg).
How to install collectd on CentOS?
By default, the collectd package is not available in the CentOS repository (CentOS 7). For others, there are collectd RPM packages (Dag Wieers repository) for CentOS (as well as for Fedora and Red Hat). To install collectd on CentOS, use the following command: $ sudo yum install collectd.
StatsD vs. collectd: What are the differences?
StatsD is a daemon released by Etsy, which can be used to collect, send, summarize, and aggregate custom application metrics. StatsD is mainly used for monitoring applications, whereas collectd can be used for systems, application, or infrastructure monitoring. collectd is used where there is no special requirement for logic data collection.
How to integrate collectd with Prometheus?
Prometheus is a full open-source monitoring system and time-series database. It is used to collect metrics from any target (at a given interval), evaluate expressions, display results, and trigger alerts. collectd is the collection daemon that sends metrics to the Prometheus server. To integrate collectd to Prometheus load and configure the Write Prometheus plugin.
How to install the collectd Java plugin?
The collectd Java plugin is a binding plugin. It embeds JVM into collectd and exposes the API to Java programs. To use the Java plugin, you’ll need to load the LoadPlugin Java Class and configure the JVMArg Argument.

