
Our funding comes from our readers, and we may earn a commission if you make a purchase through the links on our website.
The Best Cassandra Monitoring Tools

UPDATED: October 27, 2023
Cassandra is an open-source distributed NoSQL database management system widely known for its exceptional scalability, fault tolerance, high availability, and high performance. As with any database, monitoring is essential for ensuring its smooth operation. Fortunately, there are many tools for monitoring Cassandra, available for free and paid, that will provide you with valuable insights into the performance and health of the database.
Without a proper guide, it can be a daunting task to find the right one for your needs. So, we have compiled a list of the ten best Cassandra monitoring tools to help you select the right tool for your specific monitoring needs.
Here is our list of the top Cassandra Monitoring tools:
- AxonOps 3-in-1 Cassandra Operations – FREE VERSION is a cloud-native solution designed to monitor, maintain, and backup Apache Cassandra clusters and nodes. AxonOps offers a 100% free version for up to 5 nodes. Access the free demo sandbox.
- SolarWinds Server & Application Monitor – FREE TRIAL is a robust server and application monitoring solution that supports over 1200 server and application types, including Apache Cassandra. Start a 30-day free trial.
- ManageEngine Applications Manager – FREE TRIAL An APM solution with Cassandra's monitoring and management capabilities. It can collect CPU and memory consumption monitoring, disk space monitoring, and JVM data collection. Start a 30-day free trial.
- Datadog is a SaaS-based full-stack monitoring tool. It provides an agent for seamless integration to Cassandra and can gather all the relevant metrics and infrastructure components' data.
- Site24x7 is a cloud-based monitoring platform with a Monitor plugin for Apache Cassandra performance monitoring.
- Sematext is a cloud-based full-stack monitoring and log management platform that provides a comprehensive Apache Cassandra monitoring solution.
- Dynatrace is an entirely automated full-stack monitoring solution. It provides an out-of-the-box extension for Apache Cassandra monitoring.
- AppDynamics by Cisco is a full-stack APM and IT operation analytics observability platform. It can monitor databases, including Cassandra.
- Instana's AI-powered APM solution automatically detects Cassandra technology and maps out the entire infrastructure while collecting relevant metrics.
- Instaclustr is a SaaS-based platform for deploying, managing, and monitoring open-source technologies such as Apache Cassandra.
How to Monitor Cassandra?
Monitoring the performance of Apache Cassandra is essential to identify any issues that could slow down or limit its resources. Fortunately, Cassandra provides different metrics on performance and resource utilization that can be helpful for monitoring. Cassandra exposes these metrics through JMX (Java Management Extensions) — a Java technology that monitors and manages Java applications.
When monitoring Cassandra, it is vital to keep track of the following metrics:
- Throughput: A metric that refers to the number of reads and writes requests processed by Apache Cassandra over some time.
- Latency: This metric refers to the time it takes for Cassandra to respond to a request, usually measured in milliseconds.
- Disk usage: A metric that refers to the amount of disk space Cassandra uses on each node.
- Garbage collection: A metric that refers to the process of reclaiming memory that Cassandra is no longer using.
- Errors and overruns: The number of errors or failed requests encountered by Cassandra.
There are mainly three tools to view and monitor these Cassandra metrics. However, it is essential to note that such tools provide different monitoring levels, simple-to-advance analysis, and different visualizations of these Cassandra metrics.
- The first option is Nodetool, the command-line interface that comes with Cassandra.
- A second option is the most popular: JConsole — a graphical user interface that comes with the Java Development Kit (JDK); and integrations with external graphing and monitoring tools that support JMX/Metrics protocols.
- The Metrics library: This is a popular open-source library for measuring and reporting performance metrics in Java applications.
So, you can get good Cassandra monitoring capabilities by using the above-mentioned tools. But to get the most out of these Cassandra metrics, including advanced collection, aggregation, intelligence, visualization, and alerting, you’ll need an advanced and robust Cassandra monitoring tool.
Advanced Cassandra Monitoring Tools
As mentioned in the previous section, one of Cassandra's most popular monitoring tools is Apache Cassandra's own monitoring tool, which provides metrics such as CPU usage, memory usage, and read and write latency. But in addition to Apache Cassandra's tool, many other monitoring tools are available, both free and paid. These tools provide a range of features, such as tracking the usage of critical resources, monitoring the health of the cluster and individual nodes, and providing detailed statistics on application performance.
For those using cloud-based services like AWS or Microsoft Azure, there are also Cassandra monitoring tools available specifically designed for these platforms. These tools provide insights into the performance of the database within the cloud environment and can help identify any issues that may arise.
The Best Cassandra Monitoring Tools
What factors to consider when choosing a Cassandra Monitoring tool?
When selecting a monitoring tool, it is essential to consider factors such as pricing, features, ease of use, and support services. Many tools offer free trials, which can be an excellent way to get a feel for the tool before committing to it.
Ultimately, the proper monitoring tool for your Cassandra database will depend on your specific needs and requirements. Whether you require a simple tool that provides an overview of the system, or a more complex tool that includes features such as tracing and cache management, there is a tool out there that meets your needs.
1. AxonOps 3-in-1 Cassandra Operations – FREE VERSION
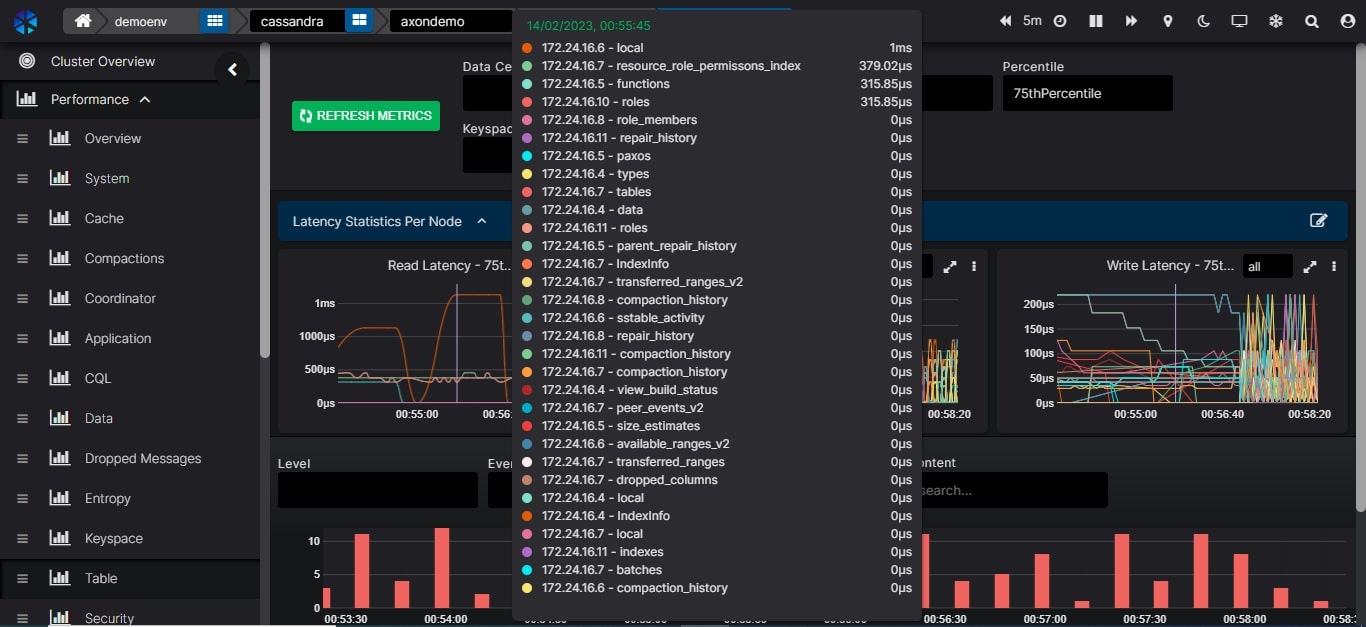
AxonOps 3-in-1 Cassandra Operations is a cloud-native solution explicitly designed to monitor, maintain, and back up Apache Cassandra clusters. It was created by experienced Cassandra professionals who wanted more than what the former available Cassandra tools offered, so they created their own management solution.
Key Features
- Dynamic and customizable metric dashboards.
- Collects and centralizes log and event data from all nodes
- Pre-built and customizable service checks
- Integrates with various alerting systems
- Automates the Cassandra repair process
- Customizable backup and restore processes
AxonOps is one of the best Cassandra monitoring tools for many reasons. With AxonOps, you can monitor your Cassandra cluster through dynamic and customizable dashboards. The tool collects logs and metrics and performs regular service checks. AxonOps also offers an advanced and intelligent Cassandra repair process that ensures your cluster meets your specified consistency level requirements. Last but not least, AxonOps also provides highly configurable backup and restore procedures, with fine-grained retention management and a flexible scheduler.
AxonOps offers three plans: Free ($0 forever for up to 5 nodes), Premium, and Premium Plus. Free version: Sign up for the free version for up to 5 nodes or try their demo sandbox.
2. SolarWinds Server & Application Monitor – FREE TRIAL
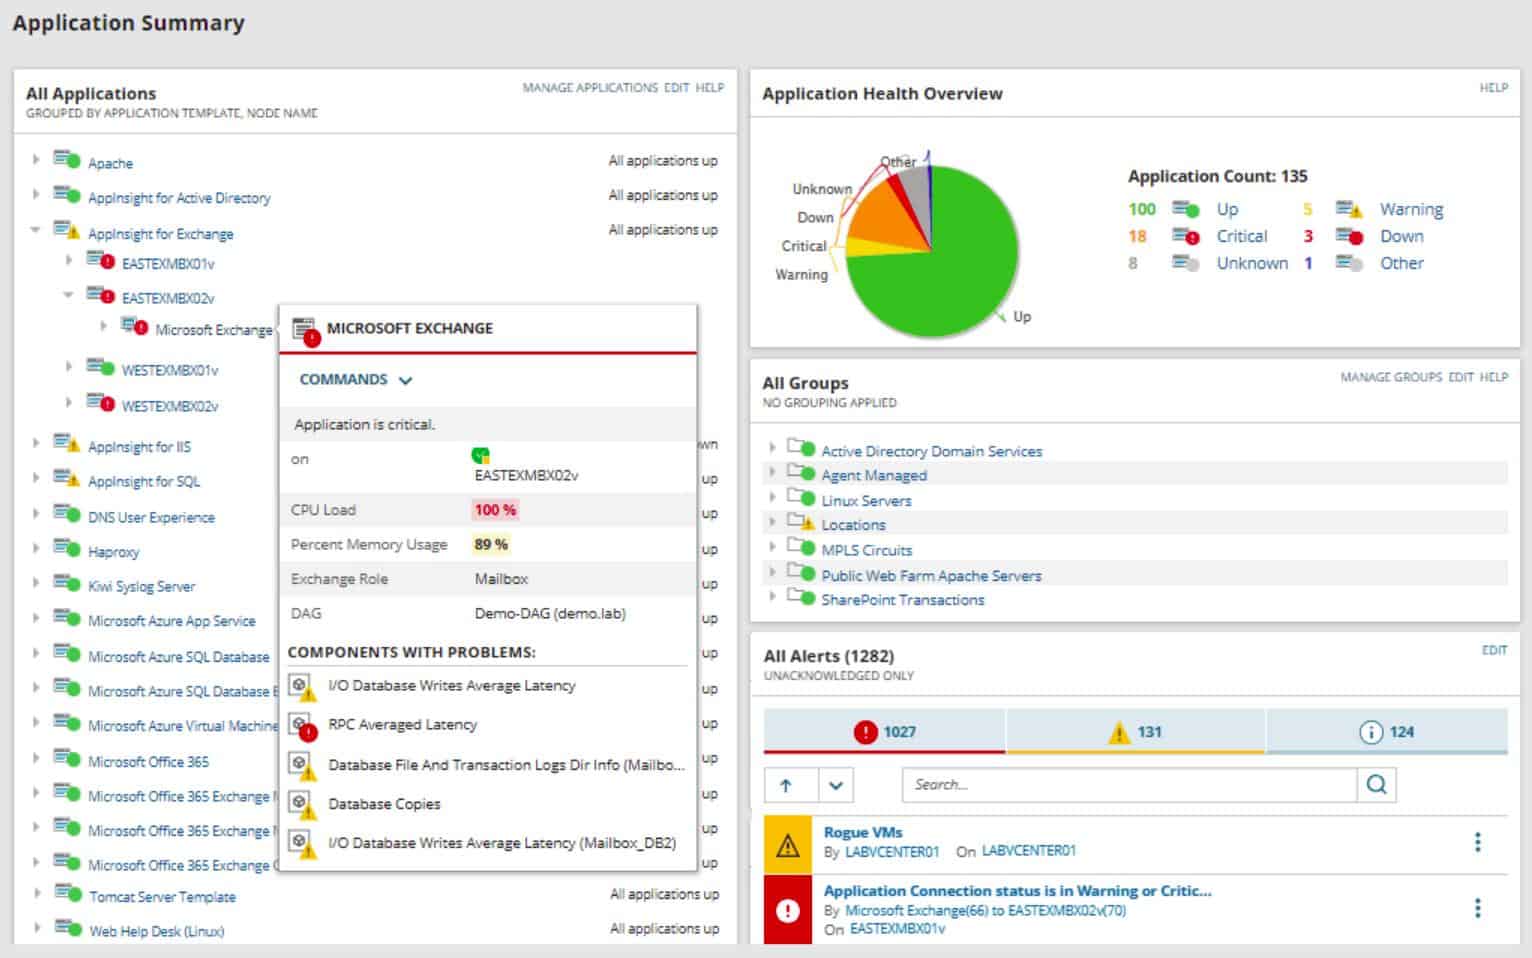
SolarWinds Server & Application Monitor (SAM) is a server and application monitoring solution built on the SolarWinds Platform. It supports many server and application types (+1200), including physical servers, virtual servers, cloud-based servers, and SaaS applications. SAM provides real-time monitoring, alerting, reporting, and performance analysis tools to help IT teams proactively identify and troubleshoot performance issues on such resources.
Key Features
- Full monitoring of Cassandra server’s metrics.
- Continuous monitoring of Cassandra metrics
- Aggregation of Cassandra JMX metrics.
- Node resource capacity forecast.
- Customizable reporting and alerting.
- Unifying Cassandra monitoring dashboards.
SAM provides a comprehensive Apache Cassandra monitoring solution to help admins proactively keep track of Cassandra. It can provide a deep dive into individual Cassandra nodes and clusters. It can also help proactively identify and resolve the underlying causes of performance issues and ensure optimal performance and availability of your Cassandra clusters.
The pricing for SAM starts at $1,813.00. Download a 30-day, fully functional free trial.
3. ManageEngine Applications Manager – FREE TRIAL
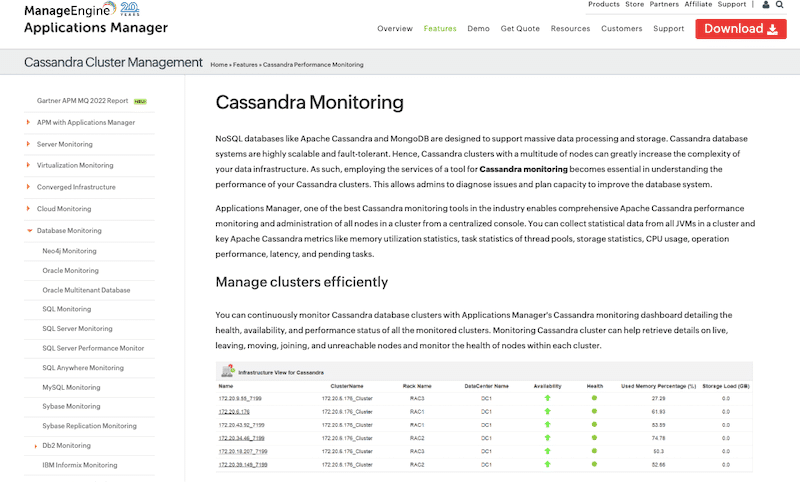
ManageEngine Applications Manager is an Application Performance Monitoring (APM) solution designed to track the health and performance of applications, infrastructure components, databases, and services in physical, virtual, or cloud-based environments. The monitoring solution also includes Cassandra Cluster Management and Monitoring under database monitoring.
Key Features
- Cluster management and monitoring.
- CPU and memory consumption monitoring.
- Monitoring and predicting disk space.
- Statistical data collection from all JVMs in a cluster
- Cassandra monitoring dashboard with full details.
- Track operations stats and latency.
ManageEngine Applications Manager’s Cassandra monitoring and management tool is designed to monitor the performance of Apache Cassandra clusters. With it, admins can diagnose issues of all nodes in a cluster and plan for capacity to improve the database system. Plus, the Applications Manager can also collect, centralize and analyze key Apache Cassandra metrics —all of this from a centralized console.
ManageEngine Applications Manager is available through three different plans: Free ($0 forever), Professional (starts at US$395 for ten monitors for one user), and Enterprise (starts at US$9,595 for 250 monitors for one user). All editions are based on an annual subscription. Download the forever free edition or the free 30-day trial.
4. Datadog
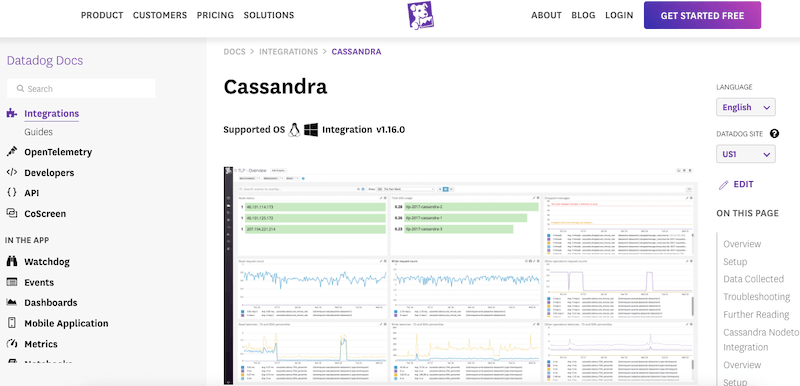
Datadog is a powerful SaaS-based full-stack monitoring tool that provides comprehensive monitoring for applications, infrastructure components, containers, networks, logs, and Apache Cassandra. With Datadog, you can get a complete view (with graphs and correlations) of your Apache Cassandra clusters, including detailed metrics about the database, JVM, and operating system.
Key Features
- Real-time metric collection.
- Failover and event notifications.
- Cassandra integration
- Monitoring guide.
- Nodetool integration
With Datadog, you can easily adjust its agent to gather the relevant metrics from Apache Cassandra and other infrastructure components. This enables you to graph and correlate the data to gain valuable insights into the performance of your Cassandra clusters and the overall health of your infrastructure.
Datadog's pricing for Database (Cassandra Monitoring) starts at $70/database/host/month. Sign up for a 14-day free trial.
5. Site24x7
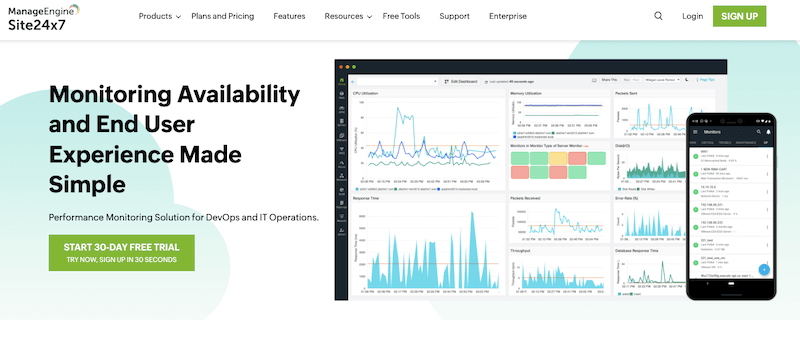
Site24x7 is a robust cloud-based monitoring platform for websites, servers, end-users, networks, cloud, and applications. It allows administrators to monitor their resources' uptime, reliability, availability, health, and performance in real-time.
Key Features
- Automatic data collection.
- Get detailed database operations information.
- Receive alerts based on threshold breaches
- Use infrastructure metrics for capacity planning.
- Automate incident remediation using scripts.
Site24x7 also has an Apache Cassandra Monitor, which allows admins to identify issues like slowdowns and resource limitations. This monitor is a plugin enabling quick integration of Cassandra's data store with Site24x7. The monitor keeps track of critical metrics like total latency for reads and writes, cross-node latency, throughput for reads and writes, disk usage, garbage collections, and more.
Site24x7 pricing plans for the all-in-one edition are Pro ($35/month), Classic ($89/month), Elite ($225/month), and Enterprise ($449/month). Sign up for a 30-day free trial of any Site 24×7 plan.
6. Sematext
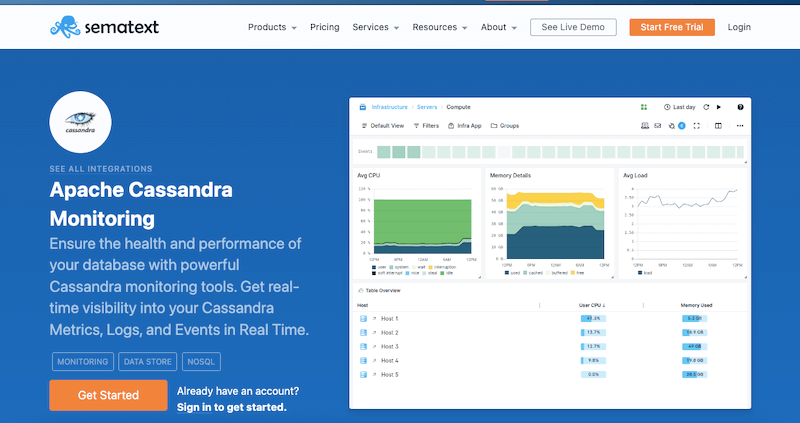
Sematext is a cloud-based full-stack monitoring and log management platform. The platform helps businesses monitor and analyze their applications, infrastructure, servers, containers, databases, user experience, and more. Sematext is one of the few tools to integrate performance monitoring, log management, and user experience monitoring in one place.
Key Features
- Real-time Cassandra metrics tracking
- Faster troubleshooting of performance issues.
- Out-of-the-box monitoring dashboards.
- Customizable alerts.
- Correlation of reports.
- Easy Installation and low overhead.
Sematext provides one of the best Cassandra monitoring tools for many good reasons. Its monitoring solution helps ensure the health and performance of the Cassandra database. It offers real-time visibility into Cassandra metrics, logs, and events, allowing you to keep track of your Cassandra clusters in real-time. The platform also provides real-time monitoring of critical metrics like CPU usage, memory usage, and disk space, as well as advanced alerting and anomaly detection capabilities.
The pricing for Sematext Cloud monitoring starts at $3.60/month. Register for a 14-day, fully functional free trial.
7. Dynatrace
Dynatrace is an entirely automated full-stack monitoring solution. It provides the necessary data, analytics, and insights to keep track of your applications and infrastructure. With this in hand, you can monitor, optimize resources, automate operations, and even improve customer experience.
Key Features
- Keep track of vital Cassandra cluster and node metrics.
- Automated discovery, mapping, and monitoring.
- AI-powered root cause analysis
- Cloud-native architecture with great scalability
- Open APIs and integrations with lots of third-party tools.
Dynatrace comes with an out-of-the-box extension to support Apache Cassandra server monitoring. This extension provides valuable insights into the performance and health of the database system. It provides information on Cassandra's server parameters, such as database exceptions, failed requests, and more. With this information, Dynatrace can send immediate alerts so administrators can identify potential issues or bottlenecks affecting the database performance.
The pricing for Dynatrace ranges from Full-stack monitoring (starting at $74/month/8 GB/host) or infrastructure monitoring (starting at $22/month/8 GB/host). Register for a 15-day free trial.
8. AppDynamics
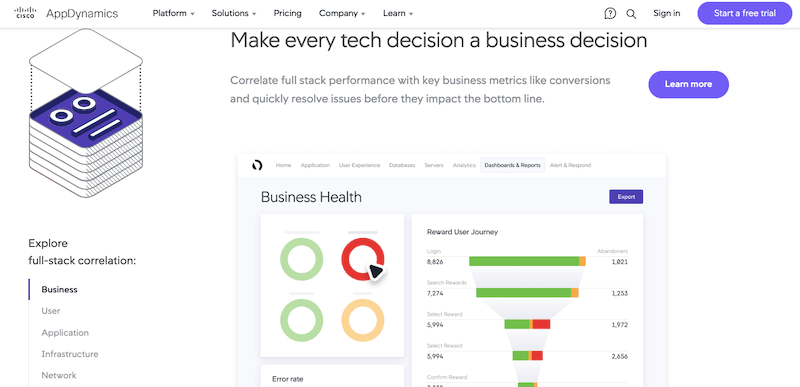
AppDynamics, by Cisco, is an observability platform designed for full-stack monitoring. It can correlate full-stack performance with vital business, user, application, infrastructure, network, and security metrics. Although AppDynamics is mainly designed for Application Performance Monitoring (APM) and IT operation analytics, it can do much more.
Key Features
- Auto-discovery of Cassandra backend applications with AppDynamics Java agents.
- Out-of-the-box configurations for business transaction monitoring related to Cassandra backends.
- Detailed call graph showing information about the Cassandra backend calls and other details.
- Collection and aggregation of Cassandra backend metrics like average response time, calls/minute, and errors/minute.
AppDynamics can also monitor databases, and it is especially well-known for its capabilities to monitor Cassandra. With AppDynamics, administrators can monitor their Cassandra nodes and clusters and get valuable insights into the performance and health of the entire database infrastructure.
Database monitoring is included in the Premium edition (pricing starts at $60/month/CPU Core) and Enterprise edition (pricing starts at $90/month/CPU Core). Register to AppDynamics to start your free 15-day SaaS-based trial now.
9. Instana
Instana provides an application performance management (APM) and real-time observability platform targeted for applications based on microservices architectures. Using Machine Learning (ML) and AI-driven algorithms, Instana can identify potential issues and take preventative actions before they become significant problems.
Key Features
- Collect vital Cassandra metrics like client read/write latencies, key space details, and disk sizes.
- Real-time mapping of Cassandra's infrastructure, including individual write-back cache nodes, data centers, and clusters
- Use Instana's Dynamic Graph to see the Cassandra events and incidents on a timeline.
- Collection of performance metrics at both node and cluster levels
- UI alerts to easily see when there is an issue with Cassandra's health or performance.
When it comes to Cassandra monitoring, Instana offers an AI-powered microservice APM solution that automatically detects Cassandra technology and deploys the appropriate monitoring sensors. Once deployed, the Instana “Cassandra” agent maps out the entire Cassandra infrastructure and collects relevant performance metrics at both the node and cluster levels. It then sends the data back to its Dynamic Graph model for contextualization and storage.
Instana's Cloud and Infrastructure Monitoring is available via SaaS ($75/host/month) and self-hosted ($101/host/month). Register for a 14-day free trial.
10. Instaclustr
Instaclustr (now from Spot by NetApp) provides comprehensive solutions for deploying, managing, and monitoring various data infrastructure components. Their offer comes as a Software-as-a-Service (SaaS)-based platform for open-source technologies such as Apache Cassandra, Apache Kafka, and Apache Spark.
Features:
- Pre-installed Cassandra Monitoring API
- Built-in visualization tool to track metrics over time
- Infographics to quickly identify patterns
- Dedicated and supervised service support.
Instaclustr provides a complete management service for Apache Cassandra, which includes an excellent performance monitoring tool. The platform has a Cassandra Monitoring API that can track vital metrics such as disk space utilization, CPU time usage, delayed tasks, incomplete constraints, and more. Additionally, Instaclustr also provides professional Apache Cassandra monitoring support.
Contact Instaclustr’s sales representatives to get a quote. Sign up for the Instaclustr service to get a time-limited free trial.
Final Words
Ultimately, the proper monitoring tool for your Cassandra database will depend on your specific needs and requirements. The ten best Cassandra monitoring tools mentioned in this post offer a range of features, from basic metrics collection to advanced monitoring capabilities, providing insights into the performance of the database and helping identify any issues that may arise.
You can begin with Cassandra's monitoring tool, which is free to use, or use more advanced tools (available for free or paid) with alerting, better visualizations, intelligence, reporting, support, and more. Fortunately, you can begin today; great tools like Datadog, AxonOps, SolarWinds Server & Application Monitor, ManageEngine Applications Manager, and Site24x7 all offer free ways to start using their software without commitments.

