
Our funding comes from our readers, and we may earn a commission if you make a purchase through the links on our website.
7 Best Serverless Monitoring Tools
UPDATED: October 18, 2022
In the 21st century, it’s never been easier to launch an online service. This is thanks mainly to platforms that allow businesses to use their infrastructure to scale and host applications.
This is known as serverless computing, and in this article, we’ll be looking serverless monitoring tools you can use to make sure you never lose control of your data.
Here is our list of the best serverless monitoring tools:
- AppOptics – FREE TRIAL Covers a wide range of serverless environments as well as performance monitoring for servers and self-hosted applications. Get a 30-day free trial.
- ManageEngine Applications Manager – FREE TRIAL Monitoring for a range of applications and the servers that support them with processes for serverless system monitoring. Available for Windows Server, Linux, AWS, and Azure. Access a 30-day free trial.
- Site24x7 – FREE TRIAL Offers flexible reporting, alerts, and monitoring across both container and infrastructure environments. Start 30-day free trial.
- Paessler PTRG – FREE TRIAL Offers detailed CloudWatch integration with custom sensors for multiple AWS services. Start a 30-day free trial.
- Datadog Serverless Monitoring Fast and easy deployment with preconfigured dashboards
- Dynatrace Uses artificial intelligence to provide real-time monitoring, root causes analysis, and anomaly detection.
- Google Cloud Operations Suite Offers serverless monitoring with a wide range of integrations and community-based support.
What is serverless monitoring?
In short, serverless monitoring tools help administrators keep track of the serverless environment that their apps and services are hosted in.
Cloud environments like AWS use backend infrastructure and networks for server clusters to provide a serverless offering. When you hear the word serverless, it doesn’t necessarily mean that no servers are involved, just that you don’t need to provide your own server for hosting.
While AWS offers numerous serverless services, platforms such as Kubernetes manage workloads in a serverless environment using application containers. Kubernetes can be hosted anywhere but is often hosted in the cloud. You can use serverless monitoring tools to monitor a Kubernetes environment, and receive insights on the status of your micro-services and workloads remotely.
Pros & Cons of Serverless Architecture
Pros:
- You only pay for what you use. In serverless environments, you’re only paying for the hardware usage and computing power that your service or application uses. Even when you factor in the total cost of ownership for your own self-hosted hardware, it’s almost impossible to beat the current prices that serverless providers can offer. On top of the net cost, serverless environments often offer discounts for computing power that’s purchased upfront. This incentive allows you to use that pre-purchased access and also guarantees your availability to those resources during times when resources are in high demand.
- You’re positioned to scale. By using third-party serverless architecture you’re limited to the size of your host’s global network, which in almost every case is larger than what a single company can provide on its own. Cloud computing companies have server clusters all over the world that not only provide localized access for faster response times but also work as a form of backup disaster recovery where your services are automatically replicated to other sites.
Cons:
- Your host vendor or host technically is in control. In the fine print of their Terms of Service, you’ll often find that they can terminate your service without warning, limit your access, or put holds on your account. This can be scary to think about if your entire business is operating in a serverless environment.
- Bigger hosts are bigger targets. While most cloud providers take security extremely seriously, attackers know they hold a treasure trove of data which is like putting a big target on their backs. You can use serverless monitoring to help keep data secure, but if a breach happens on the backend or from an employee at your hosting company there’s not much you can do.
Let’s check out some of the best serverless monitoring tools you can use to take more control over your cloud-based services.
The Best Serverless Monitoring Tools
1. SolarWinds AppOptics – FREE TRIAL
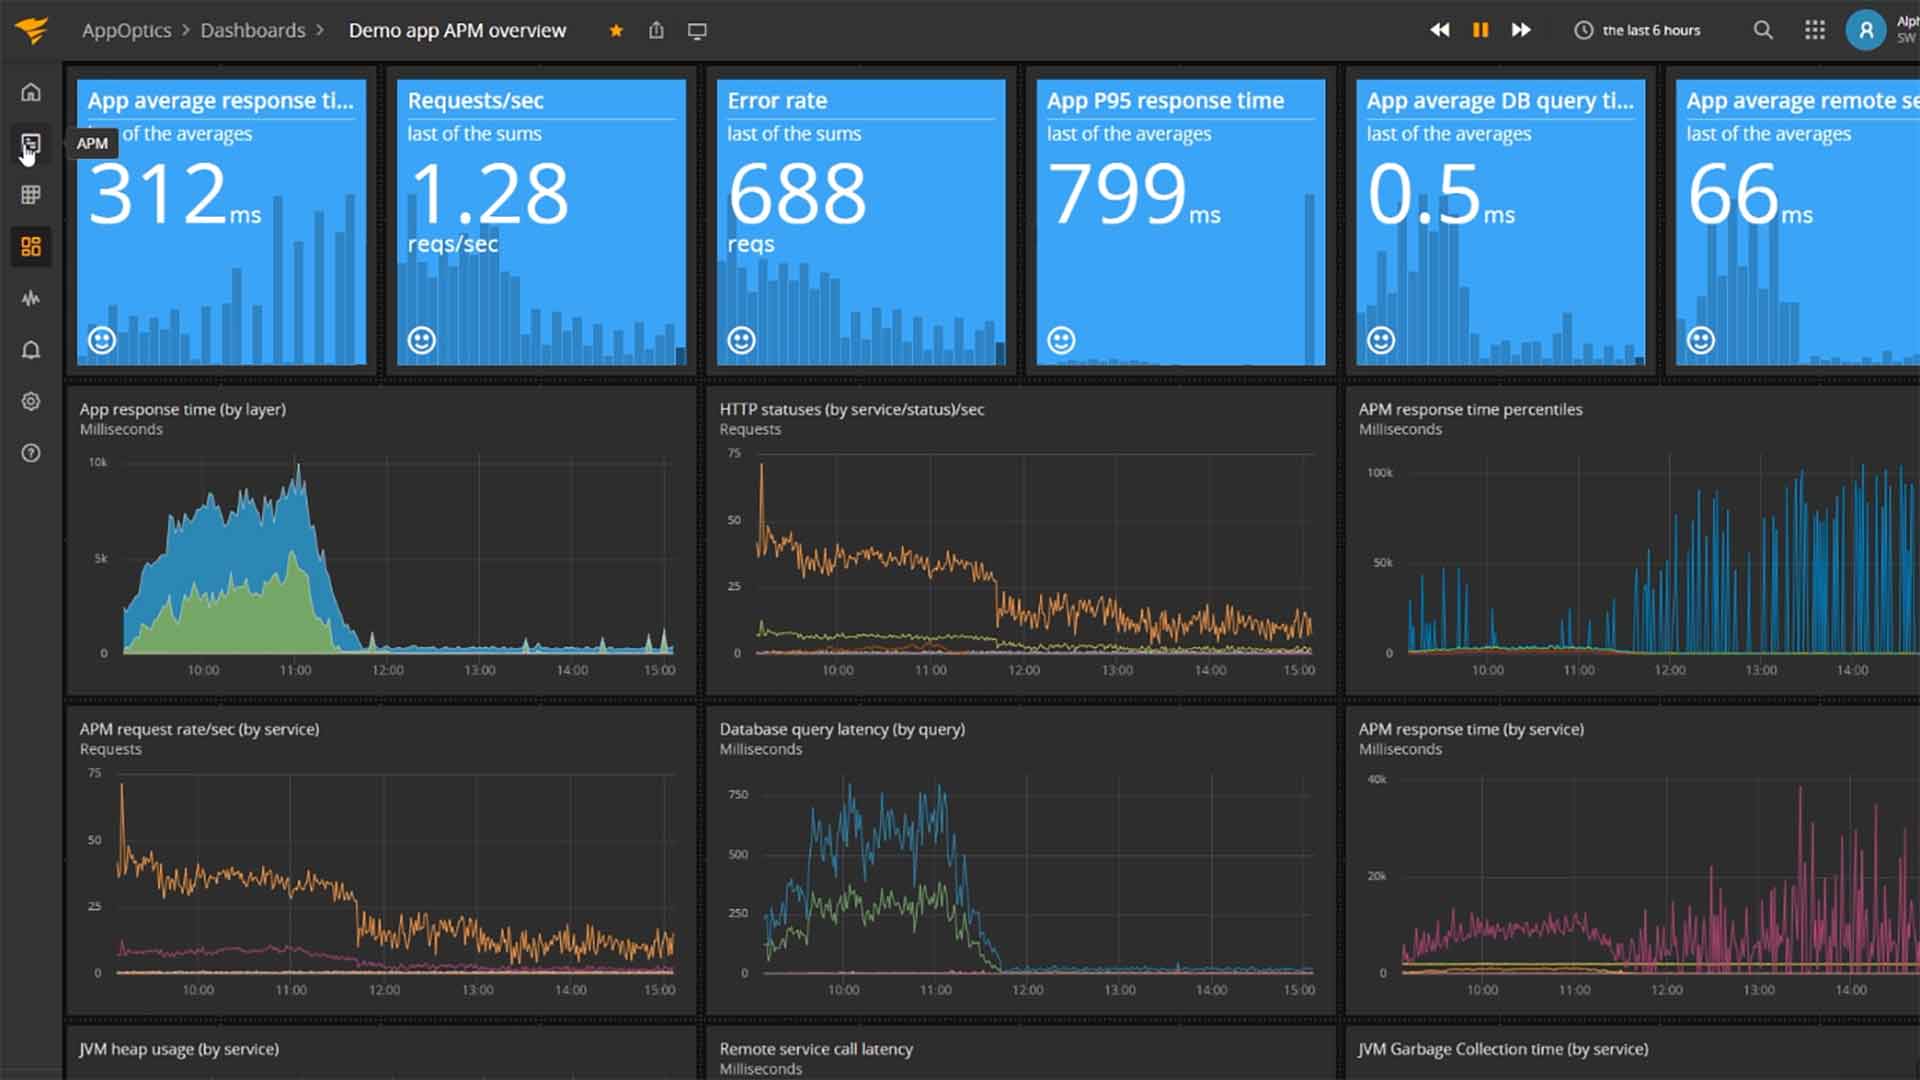
SolarWinds AppOptics is a robust application performance monitoring solution that extends its monitoring capabilities into the world of serverless environments. Specifically, AppOptics can monitor services or applications built in AWS Lambda, and integrate directly with CloudWatch to pull insights and metrics into a single pane of glass.
Key features:
- Flexible dashboards and templates
- Historical data analysis
- 150+ plugins and integrations
Currently, the platform has over 150 different plugins and integrations that allow for sharing and access on the API level. Customizable dashboards are easy to set up and can be customized and saved as either a template for certain tech teams or on an individual level for single sysadmins.
Both service performance and infrastructure can be monitored across Lambda as well as other AWS applications. From the centralized dashboard, you can easily see mission-critical metrics such as average response time, requests per second, error rate, and top functions. For performance analysis, you can use historical data that has been archived by AppOptics to cross-examine how your efficiencies have progressed over time.
Invocation tracking is made easy and made with visual indicators to help you realize if you’re over or under-provisioning. The process is quite plug-and-play, with the dashboard populating with preconfigured metrics as soon as the AWS plugin is activated.
For manual analysis waterfall reports and distributed traces make it simple to compare and dig deep into multiple microservices for advanced troubleshooting. This offers more visibility into your stack than the default views offered in AWS Lambda. By proactively seeing bottlenecks start to form through the proactive alerting function you’ll be able to get issues sorted out before they cause any noticeable impact to your service and your customers.
Pros:
- Offers great visualizations reflecting live and historical health metrics and resource consumption
- Is an easily scalable cloud service
- Tracks all major resources focusing on over 180 different metrics
- Can monitor Docker, Azure, and Hyper-V platforms, offering more flexibility than competing options
Cons:
- Would like to see a longer trial period
AppOptics offers two tiers, Infrastructure Monitoring, and Infrastructure & Application Monitoring starting at $9.99 (£7.26) and $24.99 (£18.15) respectively per month.
SolarWinds AppOptics is available to test out and completely free for a 30-day free trial.
2. ManageEngine Applications Manager – FREE TRIAL
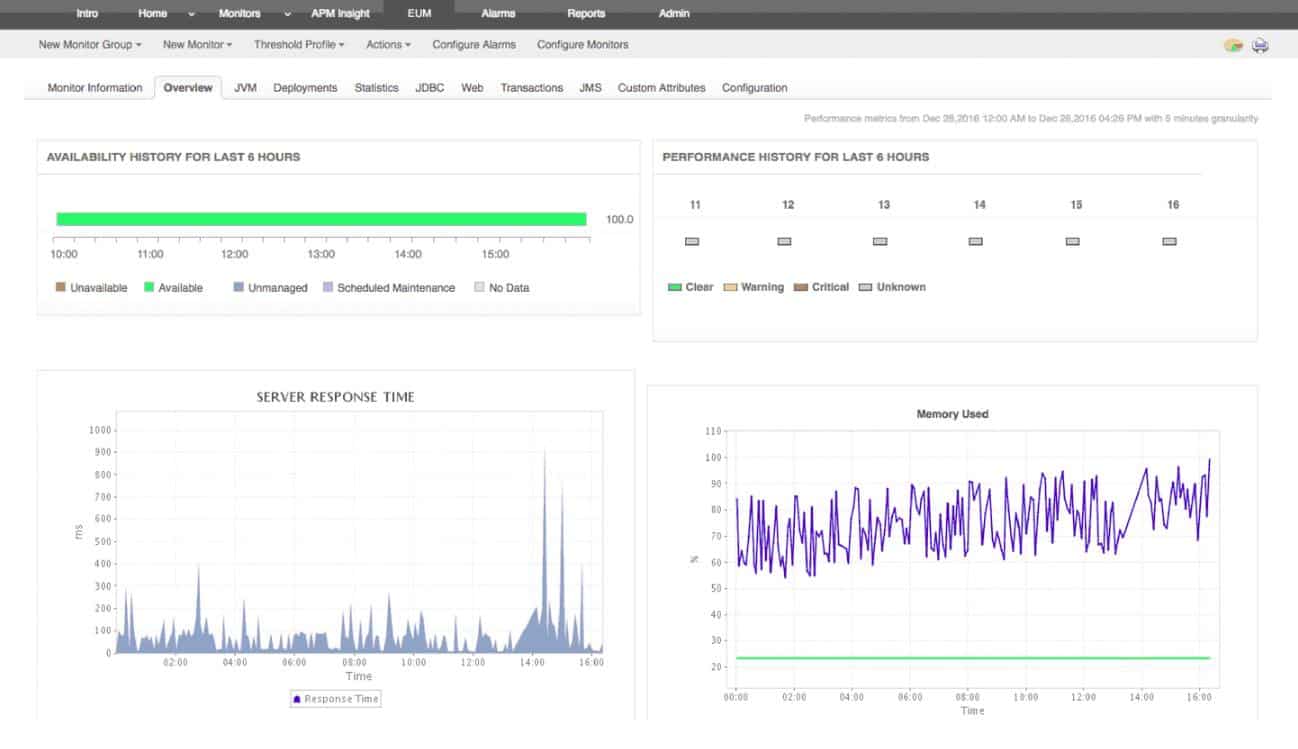
ManageEngine Applications Manager is designed as an applications performance monitor for on-premises systems and also cloud services. The tool will also track the performance of the supporting infrastructure for these systems. That includes physical and virtual servers, such as cloud platforms.
The Serverless Monitor within the Applications Manager focuses on the activities of each of the functions that you have stored on your serverless account. Among the issues that the system helps with is the need to identify which functions are still in memory and how long the cold start time is for each of the functions that have been closed down.
Key Features:
- Monitors templates for all major server brands
- Hardware health tracking, memory capacity and utilization
- Disk I/O monitoring
The Application Manager package includes an application dependency mapping service, so you can see which functions interact with others, which external systems are involved and which internal systems are dependent on those serverless packages.
There are website monitoring and testing services within the Applications Manager package as well, so if your serverless functions serve features in Web pages, you will be able to track the performance issues of those elements all the way through to the resources of the cloud platform on which they depend.
You can set up performance thresholds on any of the metrics that the Applications Manager tracks. When crossed, these thresholds trigger alerts. You can specify forwarding rules to deliver alerts as notifications to key staff via SMS, email, Slack, or service desk ticketing system.
Pros:
- Offers on-premise and cloud deployment options, giving companies more choices for install
- Can highlight interdependencies between applications to map out how performance issues can impact businesses operations
- Offers log monitoring to track metrics like memory usage, disk IO, and cache status, providing a holistic view into your database health
- Can automatically detect databases, server hardware, and devices in real-time
Cons:
- Can take time to fully explore all features and options available
There is a Free edition of Applications Manager that is limited to monitoring five assets. This does include websites and cloud server monitoring. The two paid editions of the package are the Professional edition and the Enterprise edition. The difference between these is that the Enterprise edition adds on multi-site monitoring capabilities. The price for the Professional edition starts at $395 per year and the starting price for the Enterprise edition is $9,595 per year.
The software for Applications Manager installs on Windows Server, Linux, AWS, and Azure. ManageEngine offers a fully working copy of the system for a 30-day free trial.
3. Site24x7 – FREE TRIAL
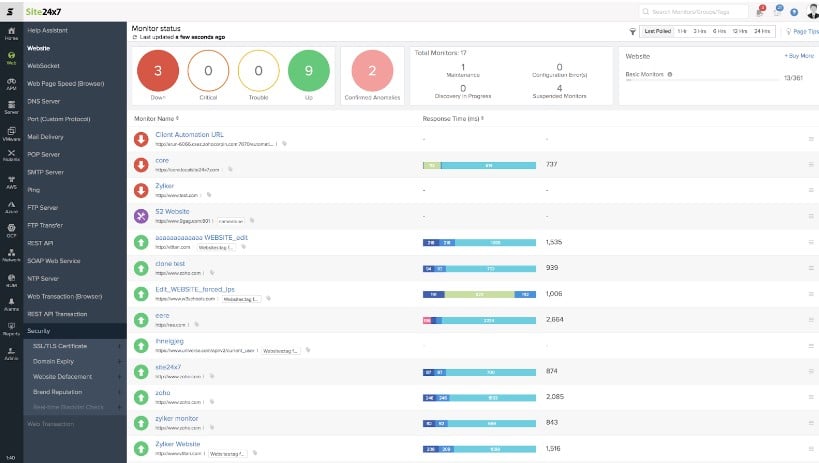
Site24x7 offers numerous alerting and metric collection capabilities for cloud environments as well as serverless environments like AWS Lambda. While we’ll just focus on the serverless monitoring aspects, Site24x7 offers all-in-one monitoring features including application performance monitoring, real user monitoring, and cloud spend monitoring.
Key features:
- Simple alert configuration
- MSP support
- Health reports
Performance metrics such as errors, throttles, and wait times, can all be viewed in a centralized dashboard that provides a live look at the overall health of your serverless environment. These insights not only highlight problems but help give you context into what is causing them.
While it’s not quite root-cause analysis, you’ll be able to easily read between the lines as to which requests are timing out, why functions aren’t working, or which part of the code is responsible for delays. With that said, the visualization aspects that Site24x7 is simple yet informative, and doesn’t take away from the finer details that lie just below the general overviews.
For quick glances, you can use the health status bar to get a combined view of how each of your services is performing on its own. This health view gives a simple color-coded measurement to signal how its overall performance, and takes into account response times, downtime, and the number of errors.
Alerts can be easily configured to trigger when certain thresholds are breached. You can ‘stack’ these tracked statistics for a single attribute, or many depending on what you’re looking for. Alert configuration is all done through a GUI, so there’s no need to learn any specialized query language or scripting.
Pros:
- One of the most holistic monitoring tools available, supporting networks, infrastructure, and real user monitoring in a single platform
- Uses real-time data to discover devices and build charts, network maps, and inventory reports
- Platform is intuitive, little training is needed to get fully functional
- User monitoring can help bridge the gap between technical issues, user behavior, and business metrics
- Supports a freeware version
Cons:
- Is a very detailed platform that will require time to fully learn all of its features and options
Site24x7 pricing is divided into four tiers and has multiple different options for each monitoring service they provide, including a package for MSPs. The serverless monitoring features start at $9.00 (£6.50) per month when billed annually.
You can test out Site24x7 completely free through a 30-day free trial.
4. Paessler PRTG – FREE TRIAL
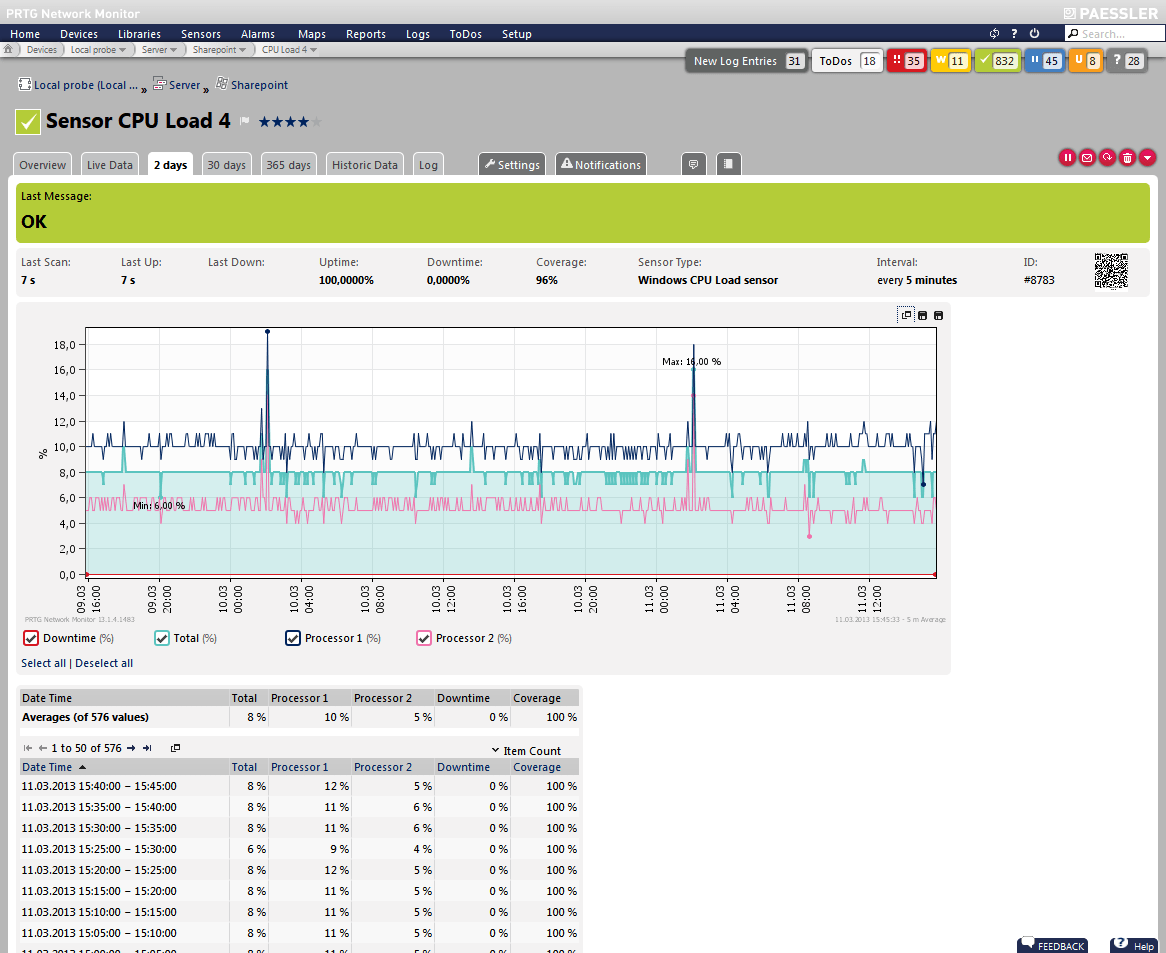
Paessler PRTG has a sensor for pretty much everything, and serverless monitoring is no different. PRTG has designed a number of sensors to expand on the monitoring capabilities available in Amazon Cloudwatch by pulling that data into its dashboard through sensors, as well as offering some additional sensors for other environments such as Amazon EBS, Amazon ELB, Amazon EC2, Amazon SNS, and Amazon SQS.
Key features:
- Easy to deploy sensors
- Preconfigured dashboards
- Robust API access with HTTP and REST API
The AWS CloudWatch sensor is built to allow you to get the most out of CloudWatch data in a single place. Additional visibility will help you narrow down where issues occur, and understand if problems are happening on the cloud, application, or server level.
PRTG uses a minimalist dashboard to display metrics through gauges, tabs, and logs that are fed with data in real-time. You can set a number of custom alarms based on a wide range of metrics you wish to track. This helps you receive an alert well in advance so you can make the necessary resource adjustments to avoid a potential outage or impacted service.
One of the best parts of the platform is its mobile app, for both iOS and Android. Here you can get a full look at your data as well as receive push notifications when an alert threshold is breached. Since each sensor is customized to its environment you can expect full visibility into the serverless platform you’re using.
For instance, the Amazon EBS sensors can monitor block storage to ensure high levels of availability either during certain times of the day in general. While the AWS EC2 monitor keeps tabs on resource usage metrics like memory consumption, CPU cycles, volume size, and uptime.
PRTG is a great option if you’re looking to monitor multiple environments and need robust API access. Currently, PRTG uses HTTP API and REST API sensors that provide simple XML or JSON outputs.
Pros:
- Designed to be an infrastructure monitoring tool that supports multiple sensors types such as NetFlow, sFlow, and J-Flow
- Offers additional monitoring on the same platform, supporting infrastructure, network, and application performance monitoring
- Captures packet headers only, helps speed up analysis and keep storage costs down for long-term collection
- Uses simple yet intuitive graphing for traffic visualization
Cons:
- Very detailed platform, takes time to learn and fully utilize all of the features available
Pricing for PRTG monitoring heavily depends on the number of sensors you have deployed, so your cost will vary depending on how much you want to monitor, and what you want to monitor for. The platform does offer a free version which allows you to use the software as freeware, limiting you to 100 sensors.
You can test out the complete version of PRTG with a 30-day free trial. After the trial expires your account will automatically be downgraded to the free version.
5. Datadog Serverless Monitoring
Datadog is another all-in-one platform that has quickly become known for its server and performance monitoring tools. Datadog has one of the best interfaces in the serverless monitoring space and aims to keep all of the metrics that matter to you in a single place. This is a breath of fresh air, especially to those who hate having to manage multiple windows and dozens of tabs just to keep track of what’s important for the business.
Key features:
- Anomaly detection
- Live service map
- Business analytics
Real-time reports and alerting can provide insights into high latency issues, specific errors, function inefficiencies, as well as hardware measurements like memory allocation. One of my favorite features is the functions tab, which gives a breakdown of the top functions which shows a readout of the average duration, number of invocations, errors, and even the estimated cost associated with that function.
End-to-end visibility is achieved not only through the alerts and visuals but through the interactive topology map. This service map lets you quickly navigate through microservices and trace live as the service operates. Tagging can be used for in-depth searches to narrow down large volumes of requests during troubleshooting. The Datadog platform has always made good use of AI and anomaly detection, and with its serverless monitoring, it’s no different. Anomalous behavior algorithms use machine learning to help highlight changes in efficiency, as well as reduce repetitive alerts that can result in alert fatigue in helpdesk teams.
From a business perspective, insights captured by Datadog can be cross-referenced and used to correlate business metrics, giving C-levels actionable information on the services that are being hosted. This could be anything from average cart value, to complete revenue forecasts based on historical data.
Pros:
- Easy-to-use customizable dashboards
- Cloud-based SaaS product allows monitoring with no server deployments or onboarding costs
- Can monitor both internally and externally giving network admins a holistic view of network performance and accessibility
- Supports auto-discovery that builds network topology maps on the fly
- Changes made to the network are reflected in near real-time
- Allows businesses to scale their monitoring efforts reliably through flexible pricing options
Cons:
- Would like to see a longer trial period for testing
Datadog has set tiers and packages based on features and the amount of data you wish to record and monitor. For serverless monitoring, there is a free tier that offers a 1-day metric repetition and up to five hosts. Pricing starts on the Pro level at $15.00 (£10.90) per month.
You can trial the full version of Datadog Serverless Monitoring through a 14-day free trial.
6. Dynatrace

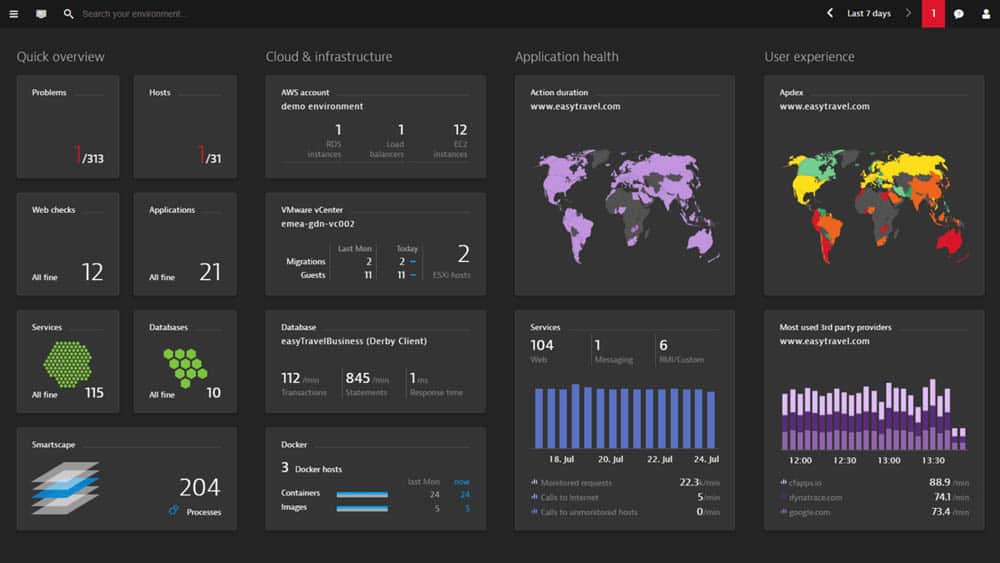
Dynatrace offers serverless monitoring across multiple platforms including AWS Lambda, Google Cloud Functions, and Azure Functions. Currently, their monitoring services cover both container-based services as well as backend infrastructure services.
Key features:
- Anomaly detection
- Root cause analysis
- Robust live tracing tools
Dynatrace uniquely leverages the power of artificial intelligence with advanced insights across their services as well as full-stack environments. This level of insights offers root cause analysis as well as anomaly detection to assist developers in troubleshooting or investigations across their services.
This, combined with elegant waterfall reports and detailed tracing drastically helps cut down on troubleshooting time, and improve the overall reliability of your service as a whole. Along with this automated visibility, management zones can be configured to provide both more contextual-based reporting as well as compartmentalized security for larger enterprise environments. The platform makes it simple to go from a general health overview of your containers to a detailed dive directly into the code level of service.
Pros:
- Highly visual and customizable dashboards, excellent for enterprise NOCs
- Operates in the cloud, allowing it to be platform-independent
- Can monitor application uptime as well as the supporting infrastructure and user experience
Cons:
- Designed specifically for large network, smaller organizations may find the product overwhelming
- Offers synthetic monitoring rather than real-user monitoring
There are monthly billing tiers for each level of monitoring you wish to subscribe to. Currently, full-stack monitoring starts at $69.00 (£50.16) per month, followed by infrastructure monitoring at $21.00 (£15.26) when billed annually.
Dynatrace is available for testing through a 15-day free trial.
7. Google Cloud Operations Suite
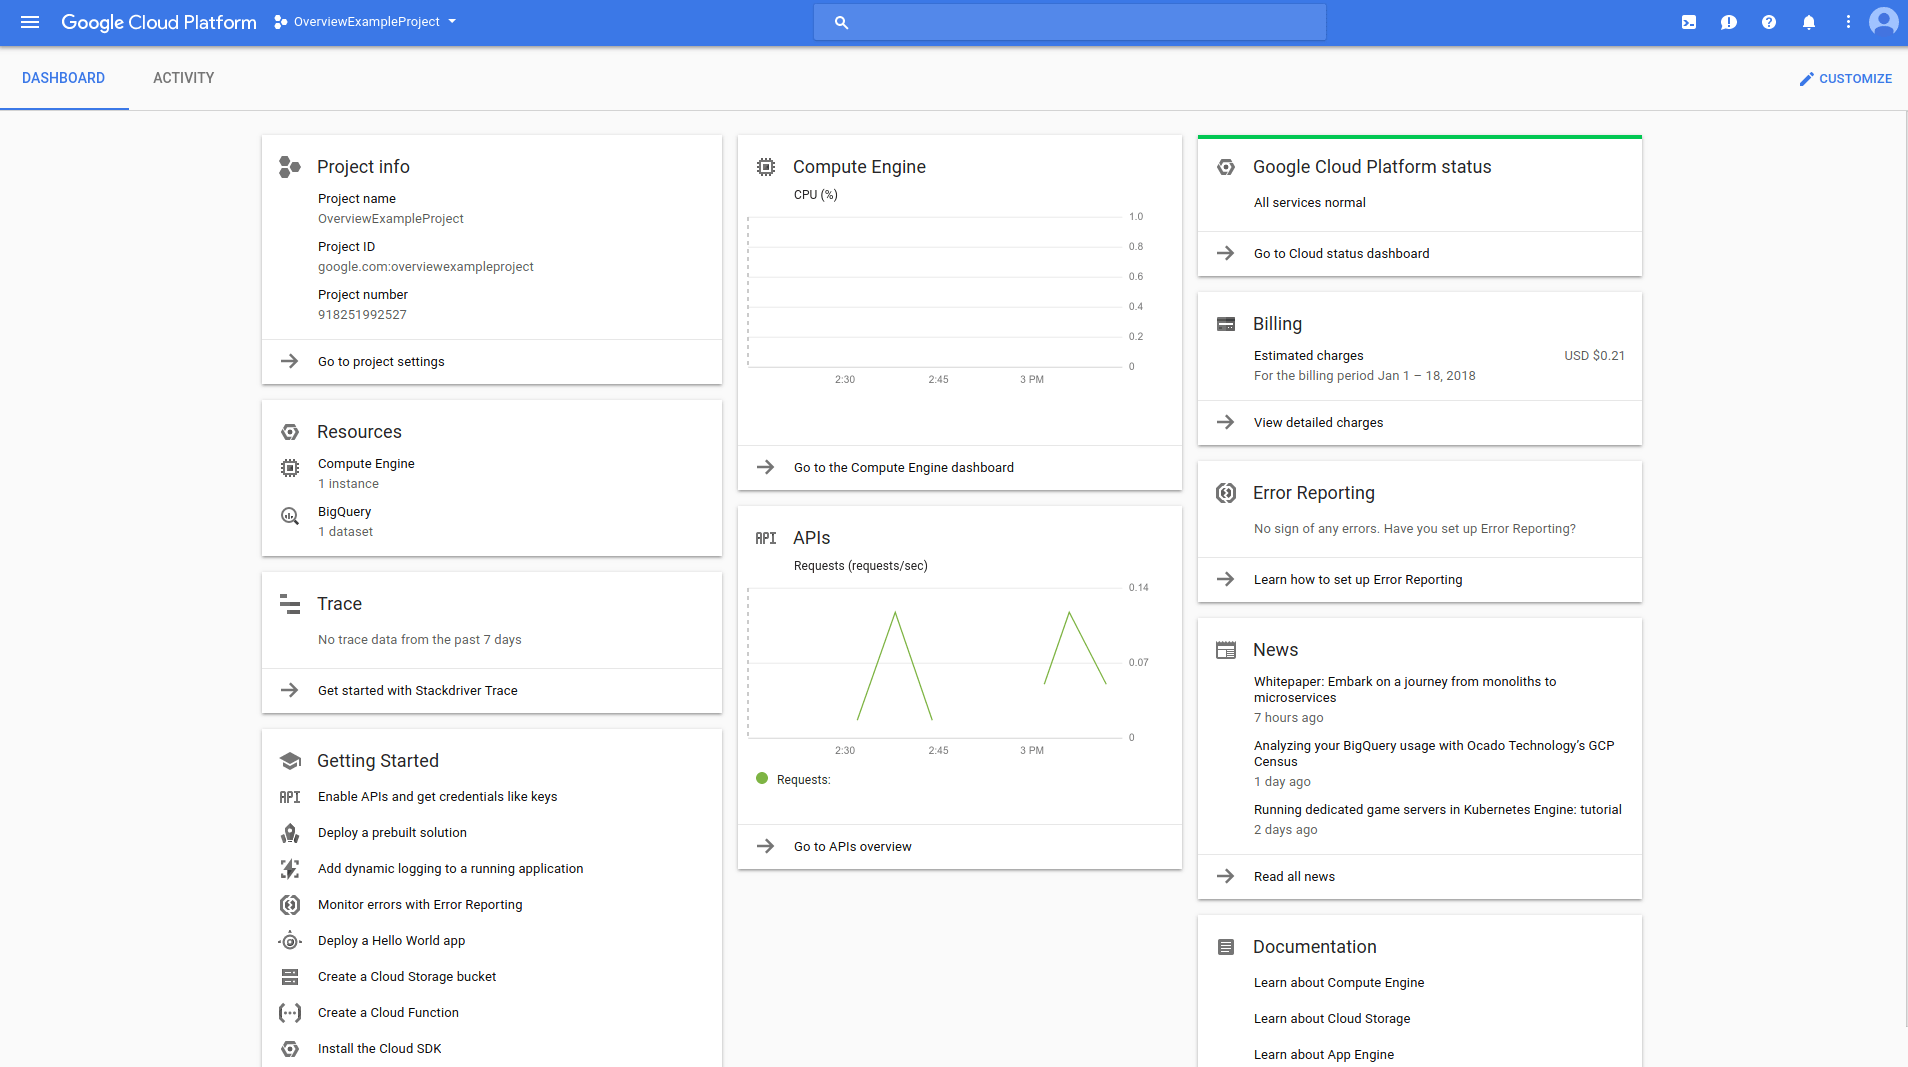
Designed by Google and once known as Stackdriver (Now known as Google Cloud Operations Suite) gives in-depth insights into your serverless environment to capture metrics across your Google Cloud environment. If you already have services in the cloud such as Google Functions, monitoring features and analytics are relatively easy to set up and capture.
Key features:
- Wide variety of integrations
- Built-in the Google ecosystem
- Large community for support
Alerts can be sent over via email, Slack, Pagerduty, or APU integration into a custom application or ticketing system. While the platform has tons of integrations and community support, you may find the technical setup for monitoring outside of the Google ecosystem to be challenging.
Pros:
- Simple to use – ideally for those already familiar with Google Cloud services
- Extensive documentation and API support
- Supports a suite of tools for cloud monitoring, deployment, and management
- Supports over 150 data collection metrics
Cons:
- Replaces live support with extensive self-help documentation
Pricing for Google Cloud Operations Suite can be a bit complex but allows for more granular control when services are deployed at scale. Since pricing is based on API calls, logging data, and the amount of data your monitor, the price you pay will depend on the size of your service and needs.
Choosing the right Serverless Monitoring Tool
Despite the organization size, AppOptics APM is the best option for those who already use SolarWinds tools, as their entire suite is known to integrate and communicate well with each other.
Both ManageEngine Applications Manager and Datadog provide excellent options for serverless monitoring across multiple applications and services.
Lastly, Paessler PRTG is a great option for departments that are looking to deploy serverless monitoring, as well as purchase a form of on-premise monitoring for additional servers and applications due to their wide variety of sensors.
Do you currently monitor your serverless environment? What are some of the most important metrics you track? Let us know in the comments below.

