
Our funding comes from our readers, and we may earn a commission if you make a purchase through the links on our website.
The Best Redis Monitoring Tools
UPDATED: June 16, 2023
Looking to monitor your Redis database a bit more closely? You’re in the right place. In this article, we’ll explore seven of the best Redis monitoring tools.
Here is our list of the seven best Redis monitoring tools:
- SolarWinds Database Performance Analyzer – FREE TRIAL Offers simple yet powerful database monitoring with the option to add and monitor other types of databases. Start a 30-day free trial.
- AppOptics – FREE TRIAL Great option for developers making continuous changes in Redis who are looking to measure performance before and after changes. Get a 30-day free trial.
- ManageEngine Applications Manager – FREE TRIAL Features a host of detailed sensors focusing on the memory usage of Redis and optimizing for uptime and data-loss prevention. Start a 30-day free trial.
- Site24x7 – FREE TRIAL Full APM and infrastructure monitoring capabilities paired with easy integrations for Redis and other third-party applications. Register for a 30-day free trial.
- Paessler PRTG – FREE TRIAL Features customizable sensors that can be configured to monitor specific memory metrics. Begin a 30-day free trial.
- Datadog Provides out-of-the-box reporting, dashboards, and alert templates to make monitoring as simple as possible.
- Dynatrace Leverages AI-powered features to provide insights for both dev and BizOps teams.
Why use a Redis monitoring tool?
Redis is a bit different from other database structures like MySQL and does not rely on tables to store data. Instead, Redis stored data in memory, making it extremely fast when compared to traditional databases that are limited based on the hard disk read and write speeds.
While there are some built-in monitor debug commands you can use, you’ll find that commands like MONITOR are limited in their scope. Commands such as AUTH, EXEC, and HELLO are not logged. Using debug commands like MONITOR also takes a toll on your memory consumption since all the commands MONITOR uses are streamed back on the database.
The tools below will allow you to not only monitor memory and performance metrics across your Redis database, but also centralize your performance monitoring efforts, and take into account variables like the infrastructure as well as the network.
The best Redis Monitoring Tools
Our methodology for selecting Redis monitoring tools
We reviewed various Redis monitoring tools and analyzed the options based on the following criteria:
- An autodiscovery system to log all network devices
- Ease of use
- A facility to analyze performance over time
- Graphical interpretation of data, such as charts and graphs
- A free trial period, a demo, or a money-back guarantee for no-risk assessment
- A good price that reflects value for money when compared to the functions offered
1. SolarWinds Database Performance Analyzer – FREE TRIAL
SolarWinds Database Performance Analyzer (DPA) is a cloud-based SaaS tool that can monitor database health and monitor performance across multiple different types of databases including Redis. The platform leverages simple integrations to visualize performance metrics in your database. This is a nice touch considering many of the free and built-in tools are all command line-based. Monitoring is configured to measure every query down to a microsecond giving you a precise look at exactly how your database is performing, and where bottlenecks start to form.
Key Features
- Built-in correlation tool
- Built for cross-collaboration with DevOps and DBAs
- Cloud-based tool
There are a number of pre-configured metrics that the platform tracks, such as top queries, memory allocation, and most popular services. DPM is enterprise-friendly and can measure and collect up to 10000 metrics per second, ensuring no problem slips through the cracks.
Monitoring occurs in both real-time and can be stored in log form for historical audits, or cross-correlations. DPM makes correlating code and queries over time easily, with a built-in section dedicated to comparing instances of the database over time.
Out of the box, DPM can start monitoring and provide insights right away. Adaptive fault detection helps DBAs as well as DevOps work in tune together to pinpoint performance problems, share data, and get the database back up and running optimally.
Rather than using memory to run the queries, DPM installs directly on the server and only uses less than 1% of the CPU to perform its monitoring functions. As a SaaS tool, you won’t have to deal with lengthy onboarding processes, patching, or upgrades.
Pros:
- Highly intuitive DB management system tailored for medium to large size database implementations
- Monitors in real time, offering a number of alert and notification options that can integrate into popular helpdesk solutions
- Threshold monitoring helps keep teams proactive, and fix issues before they impact performance
- Dashboards are highly customizable, and be tailored to individuals or teams
- Built in query analysis helps DBAs build more efficient queries
- Leverages machines learning to identify performance bottlenecks
Cons:
- Could benefit from a longer 30 day trial period
You can test out SolarWinds Database Performance Analyzer through a 30-day free trial.
2. AppOptics – FREE TRIAL
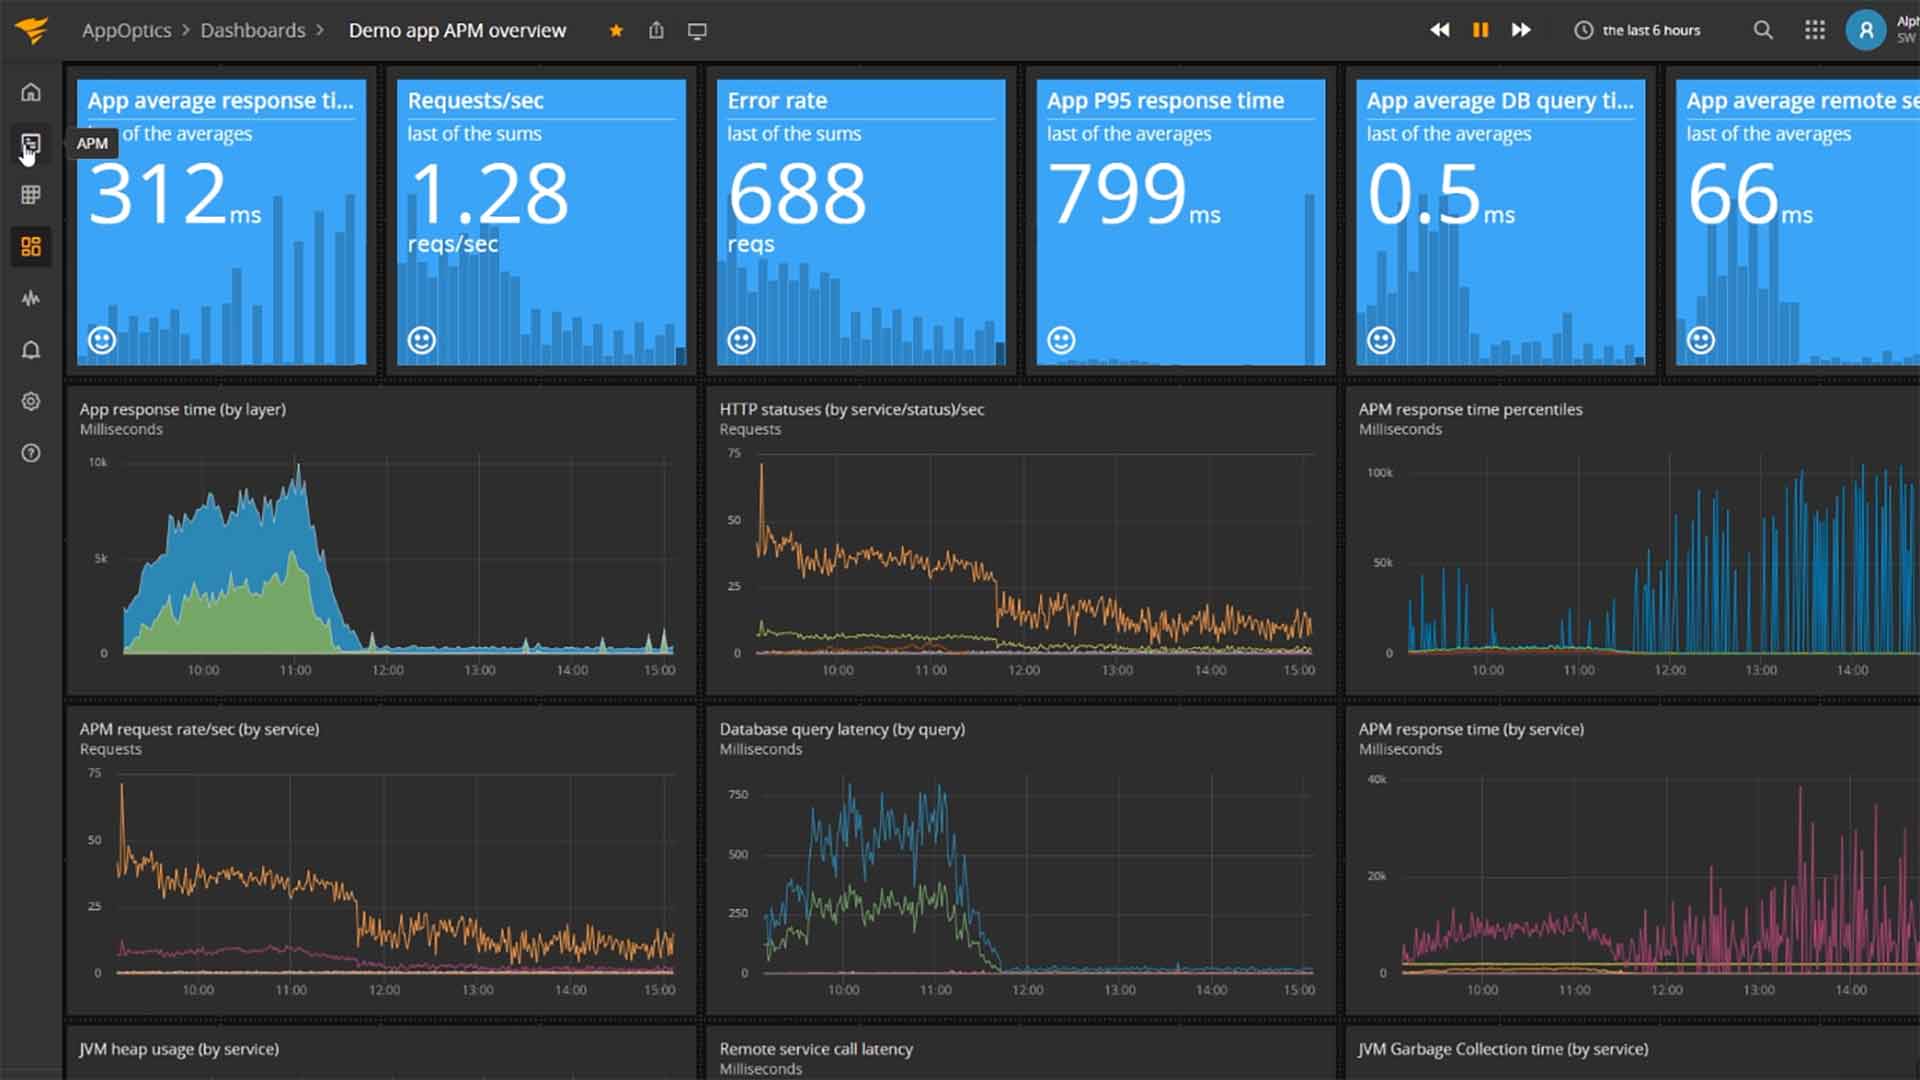
AppOptics is a monitoring platform that allows sysadmins to monitor Redis along with their IT infrastructure and is paired with tools that give developers everything they need to get databases back up and running when things aren't performing as they should be.
Key Features
- APM and infrastructure monitoring
- 150+ integrations
- Distributed tracing
A centralized dashboard monitors uptime and other Redis metrics automatically and pulls that data into insights that can be analyzed further. The platform helps take the traditional Redis Info commands and visualize them in a way you or your team can take action on.
Metrics like client connections, CPU usage, memory utilization, and input details are all available both live and as a historical data log. Every metric can be tagged through AppOptic’s intuitive tagging system, which allows you to customize your tags as you see fit. Out of the box AppOptics assigns tags for your server, ports, database, and hostname.
Pros:
- Offers great visualizations reflecting live and historical health metrics and resource consumption
- Is easily scalable cloud service
- Tracks all major resources focusing on over 180 different metrics
- Can monitor Docker, Azure, and Hyper-V platforms, offering more flexibility than competing options
Cons:
- Would like to see a longer trial period
The platform features over 150 different integrations and allows for multiple ways of sending alert notifications over different channels, or API integrations. Pricing for AppOptics is separated into two categories, Infrastructure, and APM. The APM offers automatic service maps, root causes analysis, and distributed tracing.
The Infrastructure package helps give you a high-level overview of the health of the supporting infrastructure by offering visibility into host and container metrics. You can opt for both packages to get the most amount of coverage for $24.99 per month.
You can test out AppOptics through a 30-day free trial.
3. ManageEngine Applications Manager – FREE TRIAL
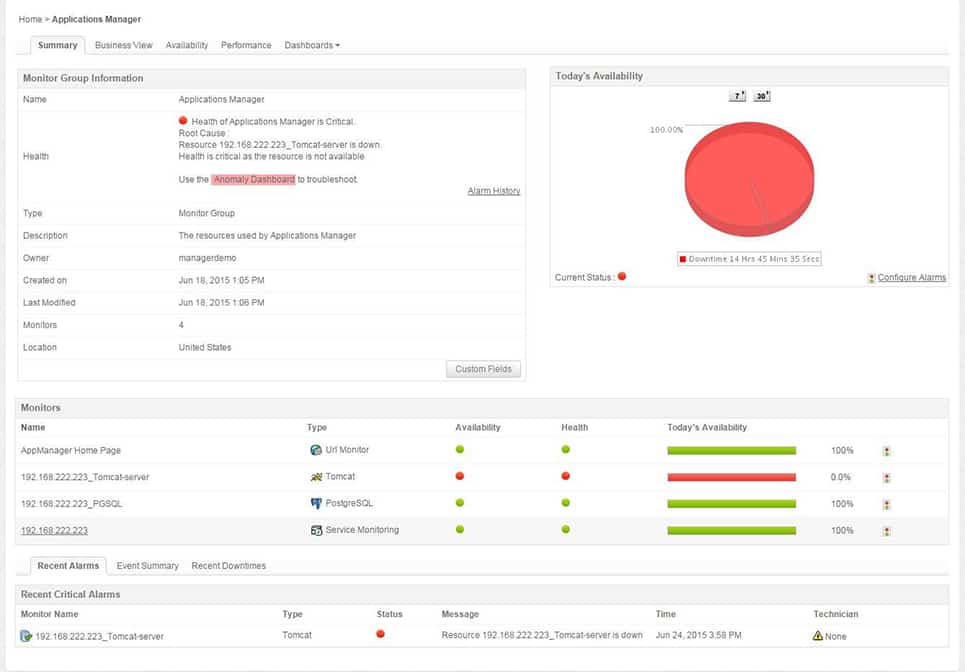
ManageEngine Applications Manager takes a very detailed approach to monitor Redis environments, focusing heavily on monitoring memory metrics and providing actionable insights alongside collected data.
Like other monitoring tools, ManageEngine can monitor both your Redis database, along with its supporting server or container. Metrics like hit ratio, blocked clients, memory usage, memory fragmentation, and evicted key stats are all able to be monitored with minimal setup.
Key Features
- Freeware version
- Specialized memory monitoring
- Advanced reporting
Dataset level monitoring helps ensure there are no crashes and that the uptime of your database remains intact. Alerts can be configured based on a threshold, or certain conditions to help act as an early warning system before data loss occurs.
What makes ManageEngine truly powerful is its ability to consistently monitor the database for anomalous behavior. This feature creates a floating baseline that is constantly comparing current metrics to historical measurements and ensuring that deviations are within a normal range. This helps not only ensure that performance is increasing over time, but also can alert when certain SLAs are not met, or an external change has caused a negative impact on performance.
Data-rich reporting helps all departments correlate performance metrics into actionable tasks. Dev teams can use the reporting for capacity planning and hardware upgrades, while the same data can be configured differently for the BizOps team.
Pros:
- Offers on-premise and cloud deployment options, giving companies more choices for install
- Can highlight interdependencies between applications to map out how performance issues can impact businesses operations
- Offers log monitoring to track metrics like memory usage, disk IO, and cache status, providing a holistic view into your database health
- Can automatically detect databases, server hardware, and devices for real-time asset management
Cons:
- Can take time to fully explore all features and options available
Pricing comes in three tiers, Free, Professional, and Enterprise. At the free level, you can monitor up to five applications or servers and will always remain as freeware. The first paid tier starts at $945 for 25 monitors and one user. Perpetual licensing is also available.
You can test out ManageEngine through either a freeware version or a full-featured 30-day free trial.
4. Site24x7 – FREE TRIAL
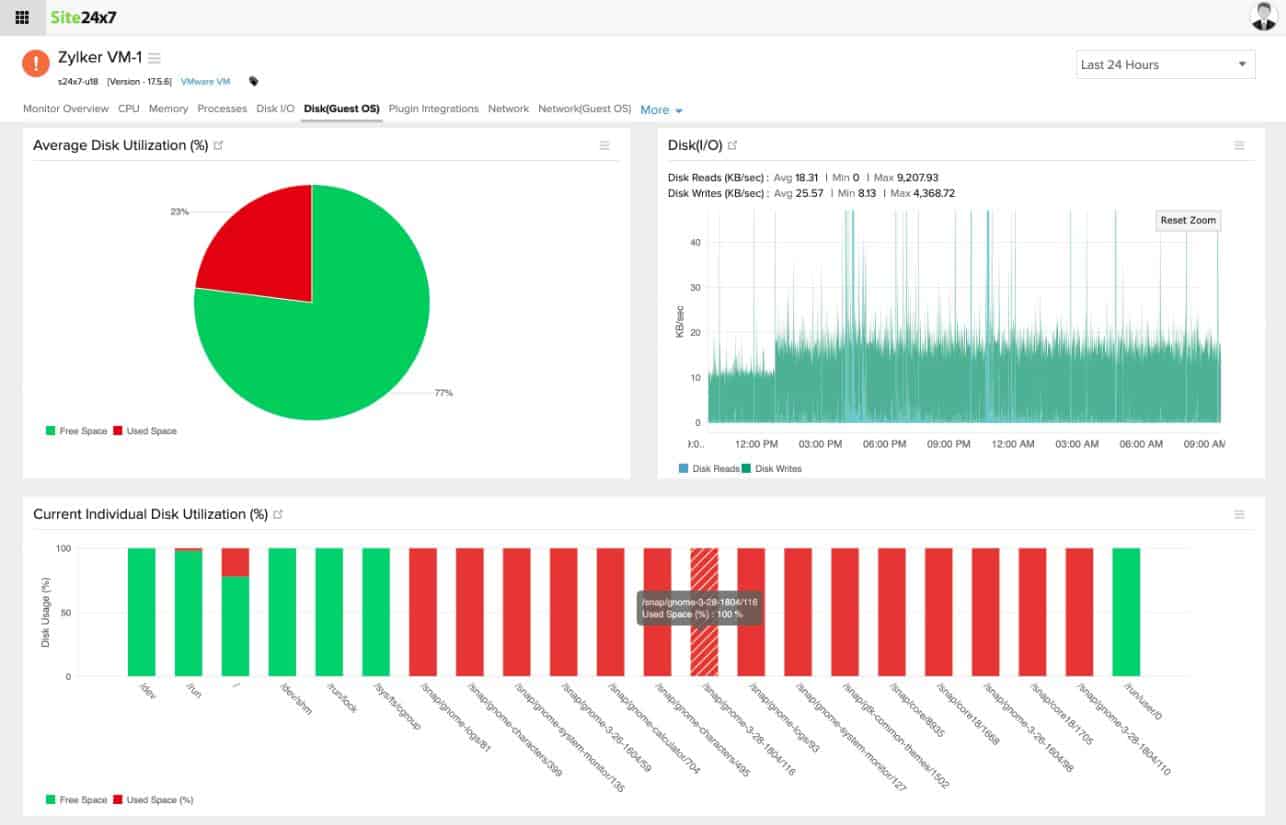
Site24x7 is a cloud-based monitoring system that aims to make monitoring applications, infrastructure, and networks as simple as possible. The platform is extremely flexible in terms of integrations and supported platforms. Rather than having to manually configure integrations in your server, Site24x7 starts with a basic Linux monitoring agent where you simply install the Redis plugin to allow for data collection.
Key Features
- Modular feature upgrades
- Root cause analysis
- Powerful visualizations
Stats such as rejected connections, keyspace misses, CPU usage, and peak memory usage are automatically calculated and pulled down in an intuitive dashboard that makes seeing your Redis database health easy, and at a glance.
The platform is highly visual, and in addition to dashboard visualizations also features an application topology map. This feature allows you to easily view database architecture, hierarchy, and interdependencies during troubleshooting. The reporting dashboard allows users to view top-level insights such as apdex scores, and then drill down to the code level to debug errors at the method level.
Reports and alerts can be distributed across many different channels including email, SMS, RSS feeds, and even push notifications for both Android and iOS. Alerts can be tied to any number of conditions or thresholds and can help keep teams in the loop when SLAs aren’t met, or memory usage is reaching a critical level.
Root cause analysis also helps assist DevOps and DBAs to identify exactly where a problem is stemming from on the query level. From a proactive standpoint, built-in SLA management can help keep particular metrics prioritized and also serve as a valuable tool for MSPs who wish to monitor Redis environments on behalf of their clients.
Pros:
- Flexible cloud-based monitoring option
- Offers a host of out-of-box monitoring options and dashboard templates for SQL server
- Allows administrators to view dependencies within the application stack, good for building SLAs and optimizing uptime
- Offers root cause analysis enhanced by AI to fix technical issues faster
- Can unify SQL monitoring across multi-cloud environments
Cons:
- Site24x7 is a feature-rich platform with options that extended beyond databases management, may require time to learn all options and features
Pricing for Site24x7 starts at $35.00 per month when paid annually, and features a host of modular upgrades that allow you to only pay for structural features that you need, rather than upgrading to a prepackaged tier. You can test out Site24x7 on your Redis database with a 30-day free trial.
5. Paessler PRTG – FREE TRIAL
Paessler PRTG offers monitoring across multiple platforms, devices, applications, and infrastructure, marketing itself as a total monitoring solution. The platform is able to monitor many different environments through the use of customized sensors that are tuned to monitor and report back metrics to a single centralized dashboard.
Key Features
- Freeware version
- Scalable monitoring
- Customizable sensors
While many sensors are pre-made, you can create custom sensors tailored to your needs based on the exact metrics you wish to monitor. For example, you can create a custom SNMP monitor to measure specific values inside of your Redis database deployment.
As metrics come in they are displayed on a simple yet effective looking dashboard that helps balance out key visualizations alongside scroll logs of live data. Alert templates in PRTG allow for flexible notification options that can trigger based on the condition as well as thresholds that are met. Alert notifications can be sent via email, third-party apps like Slack, or straight to ticketing platforms via API integration.
Pros:
- Uses a combination of packet sniffing, WMI, and SNMP to report network performance as well as discover new devices
- Autodiscovery reflects the latest inventory changes almost instantaneously
- Drag and drop editor makes it easy to build custom views and reports
- Supports a wide range of alert mediums such as SMS, email, and third-party integration
- Supports a freeware version
Cons:
- Is a very comprehensive platform with many features and moving parts that require time to learn
Each sensor is configured to measure a single metric, so you’ll likely need multiple sensors per database or server. Pricing is based on the number of sensors you have deployed, which makes scaling your monitoring efforts across large enterprises predictable from a pricing perspective.
There are currently five pricing tiers available starting with PRTG 500 that offers 500 sensors across a single server installation for $1750. You can test out PRTG completely free through a free trial. After the trial is over, your subscription will automatically be downgraded to the free version which limits your account to 100 sensors. You can also get a 30-day free trial of unlimited sensors.
6. Datadog
Datadog is a cloud-based APM platform that focuses on measuring all aspects of a network to give administrators a clear picture of exactly what is happening on all levels. The platform does an excellent job of providing out-of-the-box reports, dashboards, and alert monitors that need little to no customization before use.
Key Features
- Automatic code analysis
- Done-for-you dashboards, reports, and alerts
- Distributed tracing and correlation tools
A lightweight agent collects metrics such as commands per second, cache hit rate, memory usage, and latency right away. The dashboard can also record and display insights for specific memory-related events in Redis like the number of evictions, blocked clients, fragmentation ratio, and keyspace.
These metrics are broken down into three categories, performance, memory, and basic activity metrics. The customizable dashboard allows you to rearrange and prioritize any of these metrics, and even save dashboard views for individuals, or specific NOC teams.
You can easily link specific monitors that measure metrics to alert based on a number of interchangeable variables. Templates can be created for each alert, and messages are intelligent by default to help ensure recipients aren’t accidentally spammed with notifications. These alerts can be sent over apps like Jira, Slack, and PagerDuty, or ported over to a custom platform via webhook.
The platform gives DBAs the tools they need to monitor traces live, with no sampling as well as set up proactive alerts that help prevent database issues from creating outages or noticeable decreases in performance for end-users.
Pros:
- Has an excellent interface, easy to use, and highly customizable
- Cloud-based SaaS product allows monitoring with no server deployments or onboarding costs
- Can monitor both internally and externally giving network admins a holistic view of network performance and accessibility
- Supports auto-discovery that builds network topology maps on the fly
- Changes made to the network are reflected in near real-time
- Allows businesses to scale their monitoring efforts reliably through flexible pricing options
Cons:
- The trial is only two-weeks long
Pricing for Datadog APM is broken down into two tiers, starting with the APM tier at $31.00 per month. This tier gives you many of the basic monitoring features you’d need for a Redis database like distributed tracing, auto-retention, and dependency visualizations.
The second tier called APM & Continuous Profiler is $40.00 per month and includes a few more advanced features like performance correlation, automatic code analysis, and multiple profiling types for deeper insights.
You can try Datadog free with a 30-day trial.
7. Dynatrace
Dynatace pairs out-of-the-box features with AI-powered tools to help DevOps and DBAs get the most out of their monitoring services. The platform offers a full stack APM monitoring and troubleshooting solution rolled into one tool.
The front-end dashboard is sleek and minimalistic, allowing you to customize it however you like and monitor multiple databases, servers, or backend infrastructure.
Key Features
- AI-powered insights
- Infrastructure and application performance monitoring
- Cross-team collaboration
Upon deployment the agent will automatically detect and monitor new microservices and workloads, using premade performance monitoring metrics out of the box. This makes Dynatrace a good option for developers who are constantly working with Redis and publishing changes regularly.
The platform is highly focused on not only monitoring but improving the speeds and efficiency of the DevOps pipeline. You can easily view changes across new and old databases and pull up performance analytics captured over time to see which metrics have changed in correlation with database improvements.
Dynatrace works to ensure that all performance metrics can be used across the entire organization and help eliminate silos with cross-team collaboration features that make sharing changes and metrics easy to execute in a team environment.
From a business perspective, all analytics can be correlated and tied into business intelligence reports to create KPIs, set new performance goals, and ultimately track the customer experience throughout the entire process.
Pros:
- Can secure and monitor complicated Google Cloud/hybrid cloud environments with ease
- Sleek, customizable interface – great for NOCs
- Real-time LAN and WAN monitoring that supports virtual environments, great for MSPs and large enterprise networks
- Leverages AI to detect trends and monitor baseline performance
Cons:
- Dynatrace is better suited for larger networks and enterprise organizations
- Would like to see a longer trial
Pricing for Dynatrace is based on what features you wish to monitor, and how much data you’re looking to process each month. Full-stack monitoring starts at $69.00 per month and infrastructure monitoring at $21.00 per month when billed annually.
You can test-drive Dynatrace free through a 15 day trial.
Which Redis monitoring tool is right for you?
We’ve covered seven of the best Redis monitoring tools, but which one is right for you? In almost all cases, SolarWinds Database Performance Analyzer (DPA) is going to offer the best mix of out-of-box features, paired with detailed metrics about your Redis environment. Its pricing and features make it a great option for dev teams both large and small.
For organizations looking for a more holistic approach to monitoring, Site24x7 features a range of application performance monitoring tools paired with additional sensors that make it easy to scale your monitoring efforts over time to include network monitoring, as well as infrastructure monitoring for your Redis database.
How do you currently monitor your Redis database? Do you just use the standard MONITOR commands? Let us know in the comments below.
Redis Monitoring Tools FAQs
What are the key metrics to monitor in Redis?
The key metrics to monitor in Redis include memory usage, CPU utilization, network traffic, commands processed per second, and number of connected clients.
What are the common tools for Redis monitoring?
Common tools for Redis monitoring include open-source solutions like Redis-cli, Redis-stat, and Redmon, as well as commercial solutions like Datadog, New Relic, and AppDynamics.
How do I monitor Redis performance?
To monitor Redis performance, you can use Redis commands, such as INFO and MONITOR, to gather information about memory usage, CPU utilization, network traffic, and other performance metrics. Additionally, you can use Redis monitoring tools to automate the process and provide real-time monitoring and alerts.
How do I monitor Redis memory usage?
To monitor Redis memory usage, you can use the Redis command INFO to gather information about the memory usage of your Redis instance, or use Redis monitoring tools that provide real-time memory usage data and alerts.

