
Our funding comes from our readers, and we may earn a commission if you make a purchase through the links on our website.
The Best Python Monitoring Tools
UPDATED: January 22, 2024
Attempting to pinpoint an application’s performance bottleneck can be like trying to find a needle in a haystack. Looking through different levels of the application stack, from infrastructure to storage, databases, OS, and containers, to the end-user experience, can be quite an overwhelming experience.
Python monitoring tools can proactively capture, analyze, trace, and display information related to Python-developed applications. They provide full-stack visibility, which can ultimately help identify and fix Python application performance bottlenecks and improve the user’s experience.
These tools can provide the transparency needed so that developers, operators, and DevOps teams can respond quickly and proactively to issues.
Here is our list of the Top Python Monitoring Tools:
- AppOptics APM – FREE TRIAL A unified infrastructure and full-stack APM tool. It collects and combines data to optimize the Python application’s performance. Get a 30-day free trial.
- Site24x7 APM – FREE TRIAL A cloud-based website, server, and web application monitoring platform. Start a 30-day free trial.
- ManageEngine Applications Manager – FREE TRIAL A robust unified APM, infrastructure, and user experience monitoring platform. Start a 30-day free trial.
- Datadog APM An APM platform for end-to-end distributed tracing and live code profiling. It collects and visualizes front-end and back-end data and code-level activity from a single-pane-of-glass.
- Dynatrace An APM platform with infrastructure monitoring, AIOPs, and DEM.
- Cisco AppDynamics An APM and IT operations analytics platform capable of monitoring applications across different environments.
- New Relic One A full-stack application observability platform.
- Sentry An open-source real-time error tracking and APM platform.
- Prometheus Open-source monitoring and alerting tool, capable of collecting and querying multidimensional data.
- Elastic Observability An open-source APM tool based on the Elastic Stack (Elasticsearch and Kibana).
What to look for in a Python Monitoring Tool
Python’s application monitoring tools should be capable of keeping track of vital resources at different levels of the application’s stack, from the infrastructure, platform, to the application itself. Having full-stack visibility helps developers and operations (DevOps) teams identify Python application performance bottlenecks.
Python monitoring tools can usually perform one or all of the following functions.
- Infrastructure Monitoring. Keep track of application servers, VMs, web services, etc. These tools can collect metrics or logs from these resources, including HTTP requests, response time, or database queries.
- Application Performance Monitoring (APM). Monitoring and managing the performance at the application level may cover functions like code performance, app dependencies, rendering times, errors, and exceptions.
- User’s Experience. Keep track of the impact of the application’s performance from the end users' point of view. This is similar to synthetic monitoring, which instead simulates and analyzes the user activity.
Some of the monitoring tools in this list perform one, two, or all previously described capabilities. Additionally, when searching for the right Python monitoring tool, pay attention to features like:
- Support for Python frameworks such as Django or Flask.
- Monitoring agents to instrument code and collect data such as error logs or function performance.
- Application monitoring and optimization through stack tracing.
- Collection of metrics, traces, logs and errors, and exceptions. Capabilities to correlate some of this data.
- Create service mappings interdependencies
- Monitor server resources like CPU, memory utilization, storage (free/consumed), bandwidth, and network latency.
The Best Python Monitoring Tools
Our methodology for choosing monitoring tools for Python-based web applications
We went through the wide range of Python monitoring solutions available on the market and selected the best ones based on the following criteria:
- Support code profiling techniques and distributed tracing facility.
- Application dependency mapping feature is available
- Allows creating and tracking log
- Offers support to Django or Flask Python frameworks
- Collects and correlates logs, traces, and metrics
- Server resource monitoring is available
- Free trial or demo sessions are provided for tools
1. AppOptics APM – FREE TRIAL
AppOptics APM from SolarWinds is a robust unified infrastructure and full-stack application performance monitoring tool. It can collect and combine Python-based application performance data logs, metrics, traces, and user experience data and provide insights.
Key Features
- Customizable dashboards
- SDK to add customized metrics and tracing spans
- 150+ integrations and plugins
- Distributed tracing to analyze internal service impact
- Auto-instrumented service map and summary to visualize application performance bottlenecks
Why do we recommend it?
AppOptics built as a cloud service provides access to dependency mapping, application discovery, server resource availability monitoring, and more features that make it stand out. Further, with this robust tool, developers can track transactions from one module to the next, Docker as well as Hyper-V platforms.
With AppOptics APM, you can build custom metrics or use out-of-the-box metrics like errors, response time, requests, etc., to monitor Python applications in real-time or over a period.
The dashboards allow you to investigate issues across different levels of the application stack through charts and metrics. Additionally, you can define thresholds that trigger alerts and send notifications to users via email, Slack, or other platforms. The solution uses an APM agent, which can be installed on Python frameworks including Django, Flask, Pyramid, and more.
Who is it recommended for?
If you run a web application with multiple modules and features, we recommend you choose AppOptics as it will help monitor all activities until the program is finished. It even allows users to track the entire application as well as the interactions with different systems.
Pros:
- Offers great visualizations reflecting live and historical health metrics and resource consumption
- Is easily scalable, built as a cloud service
- Tracks all major resources such as CPU, memory, and network usage
- Can monitor Docker, Azure, and Hyper-V platforms, offering more flexibility than competing options
Cons:
- Would like to see a longer trial period
There are two commercial licenses, Infrastructure monitoring (at $9.99/host/month) and Infrastructure + Application monitoring (at $24.99/host/month).
EDITOR'S CHOICE
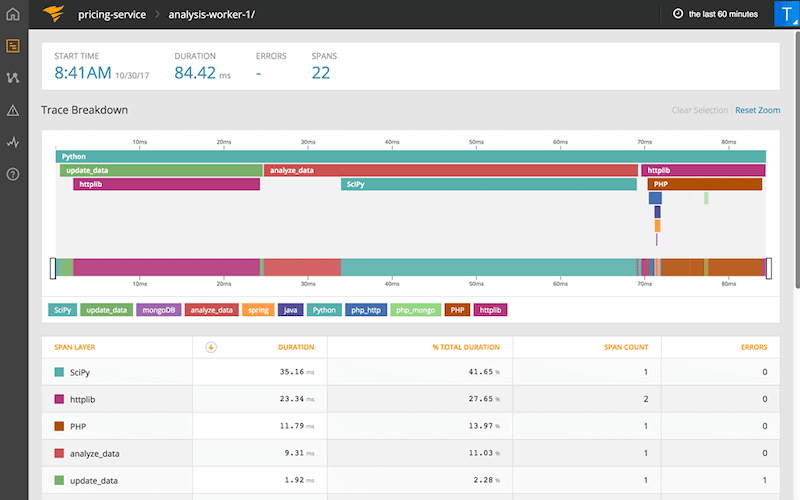
AppOptics is our top pick for a Python monitoring tool because this service is able to trace all linked applications and microservices, which discovers all of the Python code that contributes to your system even those modules that are hosted elsewhere and provided through APIs. The APM produces an application dependency map and it provides live tracing of execution. With this transaction tracing, you encounter each Python script and can then switch to a code profiler in the AppOptics console, where you can watch each line of code step through as it is executed.
Download: Get a 30-day free trial
Official Site: https://my.appoptics.com/sign_up
OS: Cloud based
2. Site24x7 APM – FREE TRIAL
Site24x7 APM is an all-in-one cloud-based website performance monitoring solution designed for DevOps and IT operations. The software keeps track of every website’s component, including servers, networks, clouds, applications, and real-time user experience.
Key Features
- Highly customizable dashboards
- Track website performance from different geographical locations
- View web transactions
- View traces, errors, and exceptions
Why do we recommend it?
Site24x7 APM is a SaaS product with which you can keep track of your on-premises servers along with cloud services using distributed tracing and code profiling techniques. It has an easy-to-use interface that helps you get a 360-degree view of all applications and interactions.
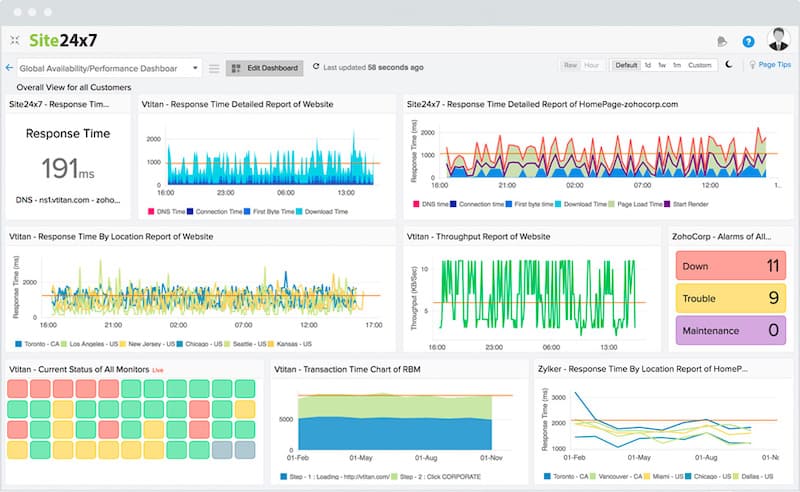
With Site24x7, developers, and operations can get insights into web application’s performance, identify bottlenecks and fix them. Site24x7 APM Insight provides a Python agent to help you monitor and optimize your Python application performance. This agent collects vital application metrics, including response time, errors, throughput, and more. You can monitor these metrics over time, analyze them, and optimize them to improve overall performance.
Who is it recommended for?
You can find access to several monitoring options in the Site24x7 APM package. It is a highly detailed platform that is suitable for small as well as large-scale businesses. Thanks to its excellent features that make it a great option for businesses of all sizes.
Pros:
- Highly scalable SaaS product
- Platform makes it easy to transition into other areas of monitoring such as network, application, or real user monitoring
- Simple and easy-to-use interface
- Supports a free version, great for home labs and testing
Cons:
- The Site24x7 is highly detailed, and may take time to full explore all options and features
There are four different licenses, Starter ($9/month), Pro ($35/month), Classic ($89/month), and Enterprise ($449/month). Sign up to Site24x7 for a 30-day free trial.
3. ManageEngine Applications Manager – FREE TRIAL
ManageEngine Applications Manager is an old player in the APM software market. It has been recognized for the eighth time among the leaders and challengers in the Gartner Magic Quadrant for APMs. The Applications Manager delivers complete visibility into the performance and user’s experience of applications and underlying infrastructure, including virtual networks, servers, databases, etc.
Key Features
- Detailed application dependency mapping
- Trace the execution of Python code deployed in the cloud, microservices, or on-premises
- Send alerts and identify root-cause for essential issues
- Synthetic transaction monitoring to optimize the user experience
Why do we recommend it?
Users can instantly find the root cause of the problem with ManageEngine Applications Manager thanks to the application dependency map feature and log monitoring practice. Also, if it notices that the program is running slow or has any other issue, it immediately sends an alert to the technical team for a fix.
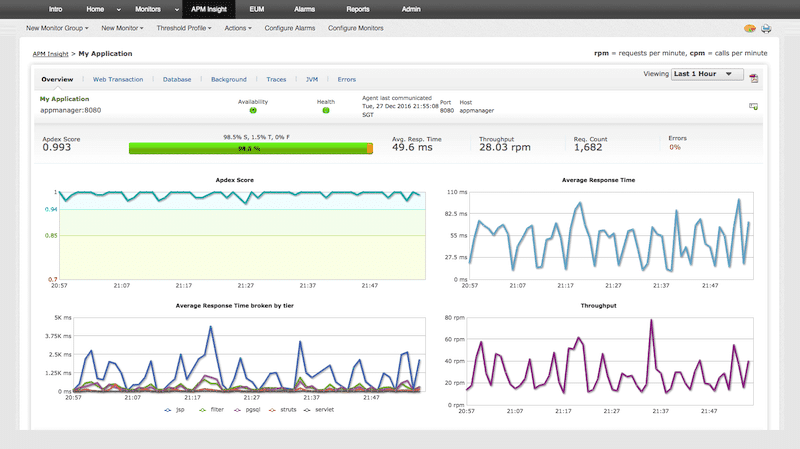
The software provides full-stack monitoring capabilities so that you can isolate Python application's performance bottlenecks and find them anywhere, from the line of code to the URL.
The ManageEngine Applications Manager is famous for monitoring websites, services, APIs, web apps, and the frameworks (like Django) that support it. The software can also trace the code execution for your Python-based applications.
Who is it recommended for?
Companies that develop web applications must use this tool as it helps pinpoint programs that cause trouble in less time and sends priority-based alerts.
Pros:
- Offers on premise and cloud deployment options, giving companies more choices for install
- Can highlight interdependencies between applications to map out how performance issues can impact businesses operations
- Offers log monitoring to track metrics like memory usage, disk IO, and cache status, providing a holistic view into your database health
- Can automatically detect databases, server hardware, and devices in real time
Cons:
- Can take time to fully explore all features and options available
ManageEngine Applications Manager is offered in three editions Free, Professional, and Enterprise. Find out more about the licenses and get a quote. ManageEngine Applications Manager is offered on a 30-day free trial.
4. Datadog APM
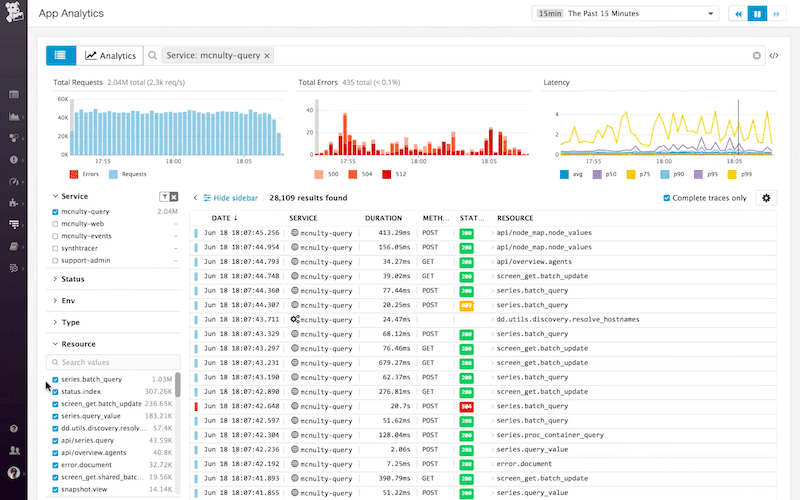
Datadog APM received the 2021 leader position in the Gartner’s Magic Quadrant for APMs, for its ability to execute and have a unique vision. The Datadog APM provides end-to-end distributed tracing (without sampling) and production code profiling. The software is famous for its robust APM feature set.
Key Features
- The Trace View allows you to search through Python stack traces
- Root-cause analysis with Python’s data correlation for metrics, stack traces, and logs
- Log patterns and analytics to keep track of Python errors
- Trace issues and send alerts when necessary
Why do we recommend it?
Datadog APM is a lightweight cloud-based tool that comes with a code-level tracing and synthetic monitoring facility. Most of its features are similar to AppOptics and Site24x7 APM but to access its infrastructure monitoring service you must apply for another subscription.
Datadog APM provides a unified user console to monitor Python's application performance and analyze stack traces, logs, and metrics. In addition, it can automatically generate a Service Map that includes all Python application dependencies. It can also be used along with “Datadog’s Tracing without limits” so that you can troubleshoot any Python issues at the user's, endpoint, or application level.
Datadog APM allows a vast (+500) number of integrations, from Python frameworks such as Django and Flask to databases such as MongoDB and Elasticsearch.
Who is it recommended for?
Datadog APM is worth using if you have a large number of Python programs to keep an eye on. It comes with a flexible pricing option, i.e., you have to pay depending on how much data you process.
Pros:
- Lightweight cloud-based tool
- AI-powered alerts help cut down on false alarms and alert fatigue
- Live reports make it easy to see high-level metrics and drill down quickly
- 450+ integrations to fit nearly any network environment
- Scalable pricing based on how much data is processed
Cons:
- Other event managers offer longer 30-day trial periods
The price for APM starts at $31/host/month, and for APM + Continuous Profiler, the price is $40/host/month. For more pricing information, check Datadog’s website. Get a free trial of Datadog for 14 days.
5. Dynatrace
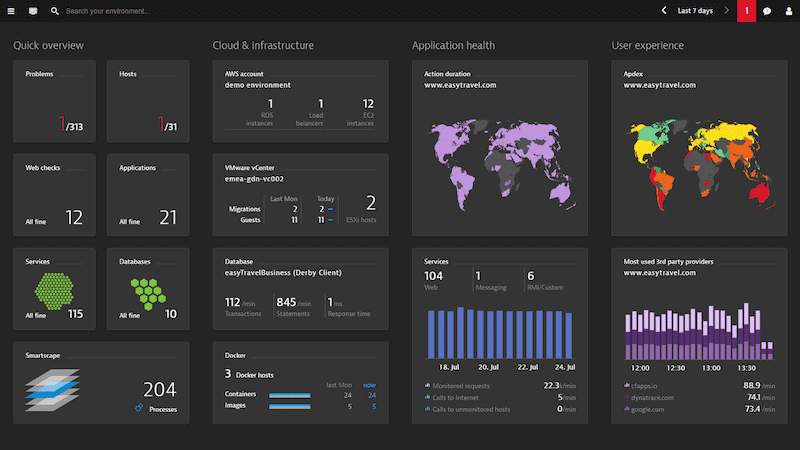
Dynatrace is an all-in-one Application Performance Monitoring (APM) and optimization platform with infrastructure monitoring, Artificial Intelligence for Operations (AIOps), and Digital Experience Management (DEM). It uses the Smartscape technology to provide a complete view of the dependencies of Python-based applications and services. This is useful when users want to know the specific host a particular Python process is currently running. Monitoring at the process level helps you quickly identify the exact function of making calls and the one being called.
Key Features
- Automatic code-level root cause and profiling
- Interactive geographical map to monitor web applications
- Out-of-the-box support for major cloud platforms
- Full-stack observability capabilities using metrics, logs, traces, and a topological model
- Built-in support for +500 different technologies
Why do we recommend it?
With Dynatrace, users can scan all applications and use them for development testing. It provides clear visibility into Python-based applications and their dependencies making the root cause analysis process quick and easy.
Dynatrace comes with OneAgent SDK to help instrument Python applications. OneAgent SDK is a set of libraries that improve the overall visibility of popular Python frameworks such as Django and Flask.
Who is it recommended for?
Enterprise NOCs and businesses with large networks might find it highly suitable as it is a comprehensive application monitoring tool. Smaller businesses might find the product too much to handle.
Pros:
- Highly visual and customizable dashboards, excellent for enterprise NOCs
- Operates in the cloud, allowing it to be platform-independent
- Leverages AI to provide baseline analysis and detect user behavior anomalies
Cons:
- Designed specifically for large networks, smaller organizations may find the product overwhelming
There are various types of licenses. The Infrastructure Monitoring edition starts at $21/month for 8GB/Host (billed annually.) The Full-stack Monitoring starts at $69/month per 8GB/Host (billed annually). Get a free trial of Dynatrace for 15 days.
6. Cisco AppDynamics
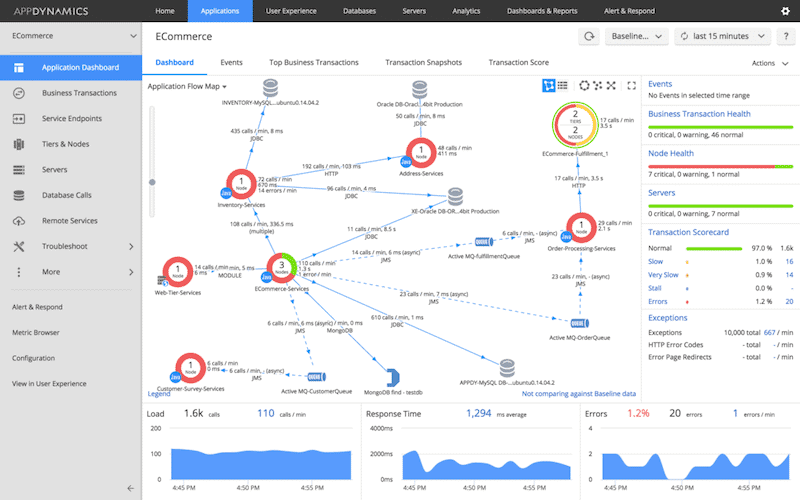
AppDynamics, acquired by Cisco in 2017, is a company that develops performance monitoring and management for applications deployed across cloud (multi-clouds), on-premises, or hybrid environments.
Key Features
- Python code-level diagnostics
- Topology application visualization and dependency mapping
- Real-time detection of errors and exceptions
- Auto-discovery of business transactions
- Support for popular Python frameworks like Django, Flask, and Pyramid
Why do we recommend it?
With AppDynamics, you can monitor your services and the internal workings of an application, run tests, and perform analysis using extensive AI processes. It even comes with an application dependency mapping service, tracing facility, and Cognition Engine that helps assess your module performance requirements and resource availability.
AppDynamics APM, their flagship product, helps you track the Python applications' performance in production or development environments. It auto-discovers and maps each application service and infrastructure dependency. It uses a Cognition Engine with Machine Learning capabilities for baselining performance and detecting anomalies automatically.
The platform also provides detailed dashboards to analyze call stacks, correlate transactions, and troubleshoot the application’s performance bottlenecks.
Who is it recommended for?
DevOps teams might find AppDynamics a suitable option for it allows them to track the performance of newly launched Web applications and validate their frameworks at ease.
Pros:
- Tailored for large-scale enterprise use
- Excellent dependency mapping and visualizations to help troubleshoot complex application systems
- Includes a free version
Cons:
- Would like to see more templates for monitoring
There are four editions, Monitoring, Premium, Enterprise, and Real-User Monitoring. To get a price, request a quote. Get a 15-day free trial of AppDynamics.
7. New Relic One
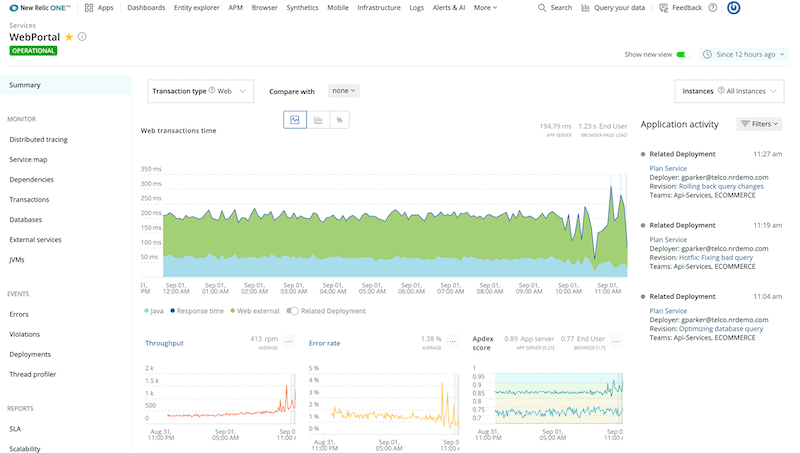
New Relic One is a full-stack observability platform. It collects telemetry data, including metrics, distributed traces, and logs, correlates them, and delivers observability with powerful AI-based insights.
Key Features
- Discover and map the application’s interdependencies
- Cross-application tracing and automated mapping
- Custom instrumentation and APIs
- Examine code-level transactions, errors, and database query traces
- Support for the popular Python frameworks including Django, Flask, CherryPy, and more
Why do we recommend it?
With New Relic One, you can track the Python application's performance and resources regardless of its environment. It is a scalable platform that offers a completely free tier for a single user.
The platform can monitor the performance of Python applications (via APM) and their underlying infrastructure so that you can quickly identify and fix performance issues. You can also extend New Relic to collect and analyze business data to improve the user experience. New Relic can monitor these resources regardless of deployment location, whether cloud, on-premise, or hybrid.
The New Relic dashboard shows Python application data such as response time, error rates, requests, and transactions. You can also create customized dashboards, including metrics such as login attempts.
Who is it recommended for?
If your business service or websites receive a lot of traffic then this tool might be a good fit for you as it will play a good role in improving your overall uptime and ongoing operations.
Pros:
- Focused on providing AIOps for websites and mobile apps
- Can identify and alert to SSL, JavaScript, load times, and browser issues
- Ideal for high-traffic websites and services – great for getting better uptime
- Offers a completely free tier
Cons:
- Available only as a cloud service
Four editions available: Free (forever but limited to one user), Standard (one full-access user for free and then $99/month per full user), Pro, and Enterprise. For more details, check the pricing. Sign up for a fully functional free trial of New Relic APM.
8. Sentry
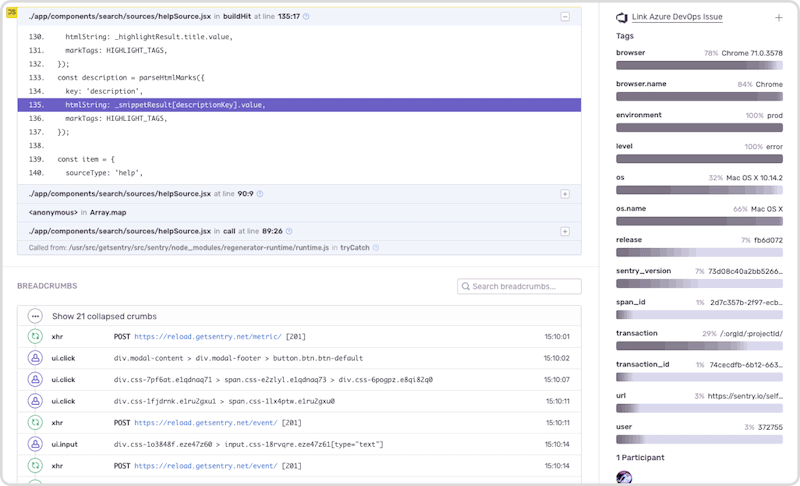
Although Sentry is known for its real-time error and crashing tracking capabilities, its software can do so much more. Sentry is also considered an APM because it can diagnose, fix, and optimize code performance (obviously, Python) and major frameworks (Django and Flask).
Key Features
- Integration with many collaboration tools, including GitHub, Slack, and Jira
- Actionable insights to resolve Python’s code errors and performance bottlenecks
- Monitor errors with full stack traces
- Improve the debugging process with a full view of Python exceptions
Why do we recommend it?
Sentry offers support to multiple programming languages, including Python, and integrates well with different collaboration tools. It even encourages root cause analysis to speed up the resolution process.
Sentry started as an open-source monitoring project, initially supporting only Python, but now it is extended to support a wide range of languages (+30 programming languages). It can be used to identify and report errors found in Python web applications quickly. You can use it as an on-premises solution or as SaaS.
Who is it recommended for?
Sentry is a great tool for monitoring and tracking errors but is not suitable for enterprise organizations as they have complex infrastructures.
Pros:
- Completely open source
- Can query multidimensional data structures
- Supports root cause analysis for faster resolution times
- Supports a wide range of integrations for logging and PSA
Cons:
- Not the best option for enterprise organizations
Sentry is offered in four editions, Developer (free), Team ($26/month), Business ($80/month), and Enterprise (request a demo and quote). Sign up to try Sentry’s free plan for an unlimited time, and then upgrade as you wish.
9. Prometheus
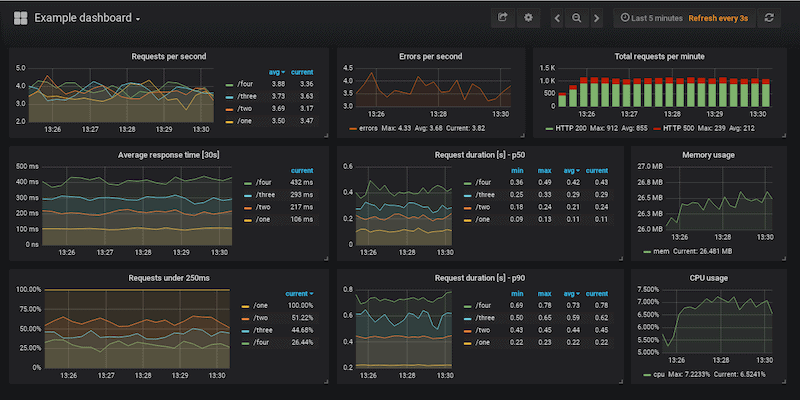
Prometheus is an open-source monitoring and alerting tool. It can be used to instrument Python web applications and generate reports. Prometheus can monitor monolithic architectures and other light service-oriented architectures, such as microservices.
Key Features
- Collect four types of Python’s core metrics, Counter, Gauge, Histogram, and Summary
- PromQL can be used to generate graphs, tables, and alerts from the collected time-series data
- Built-in browser and Grafana integration to generate amazing visualizations
- Integrate to Python frameworks like Django and Flask
Why do we recommend it?
Prometheus is a free, open-source tool that helps collect all the core metrics of your Python application, analyze, and generate insightful reports including graphs and tables. It even sends alerts to the development team to identify any errors. It even features an add-on and hotfix repository that is run by a large community.
Its ability to collect and query multi-dimensional data (time + metric + key/value pair) makes Prometheus an excellent fit for monitoring microservices. The tool stores all collected metrics as time-series data, for example, errors with timestamps. Additionally, the key/value pairs can also be recorded along with the metrics.
Who is it recommended for?
Prometheus is well-suited for microservices architecture or containerized environments. You gain access to clear visibility into the performance of an application and insights into how different components interact with the system.
Pros:
- A free open-source tool
- Has a large community-driven repository of add-ons and hotfixes
- Can accommodate complicated Kubernetes environments
Cons:
- Lacks official paid support
Prometheus is 100% open-source (under the Apache 2 License on GitHub). It is developed and maintained by the community. Τhe latest Prometheus pre-compiled binary or Docker image for free.
10. Elastic Observability
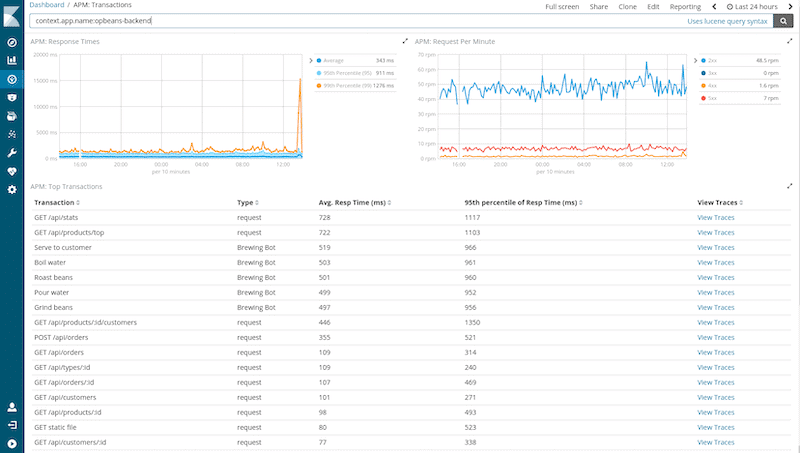
Elastic Observability is an open-source application performance monitoring tool based on Elastic Stack, a group of open-source projects that take data from any type of source, analyze, and visualize it in real-time. The Elastic Observability product was awarded as Visionary in Gartner’s 2021 Magic Quadrant for APMs.
Key Features
- Summary of service transactions, dependencies, and metrics
- Powered by Elasticsearch to help identify bottlenecks
- Service maps to provide a visual representation of service dependencies
- Distributed tracing to help you get a view of how services are interacting
- Test code with multi-step synthetic monitoring to improve user experience
- Monitor with support for popular Python frameworks.
Why do we recommend it?
In comparison to other tools, Elastic Observability is quite a simple and straightforward monitoring tool. It has the support of a strong and huge community that aids and guides users in monitoring Python frameworks and how each service interacts. You can identify bottlenecks and track all dependencies of an application with Elastic Observability.
This tool is becoming popular mainly because it is open-source. Elasticsearch powers it, stores logs and metrics, and Kibana; the interface to visualize and analyze the data.
Elastic Stack supports observability agents for popular Python frameworks, including Django and Flask. The APM agent collects different application-related performance data, including incoming/outgoing requests, response times, database queries, and more. In addition, to improve the performance of Python-based applications, the APM agent can also collect unhandled exceptions and error logs.
Who is it recommended for?
Organizations with complex and distributed systems can use this comprehensive solution for real-time monitoring, troubleshooting, and maintaining the security of web applications. With the help of this tool, DevOps and IT Operations Teams can identify and address issues in real-time and improve overall performance.
Pros:
- Setup is straightforward and simple
- The scripting language is easier to learn than some similar tools on the market
- Massive community-backed support and plugins
Cons:
- More tutorials for new users would be a welcomed change
To start with Elastic Observability, you’ll need Elastic Stack (Elasticsearch + Kibana), then install the APM agents and the server. Elastic Stack is offered in four software editions: Standard ($16/month), Gold ($19/month), Platinum ($22/month), and Enterprise ($30/month). Sign up to start a free Elastic Cloud trial.
Python monitoring FAQs
How do I monitor a Python application?
It is a lot easier to monitor a Python application if your business created it and hosts it. However, these situations are rare and most users need to trace Python code written and hosted by others. In these instances, you need to get an Application Performance Monitor, which is also known as an Observability tool. Such a system will chain through all of the applications you know about and reveal the external systems that support them – you can’t monitor Python code that you don’t know exists. The Observability platform will then watch your applications as they run through a process called distributed tracing. When it encounters a module that is written in a plain text script, such as Python, it will display that script in a code profiler and track through each line as it runs.
Does AppDynamics support Python?
AppDynamics can track the performance of Python code with its Python Agent. The monitoring package’s team has tested the agent with Tornado, Django, Flask, CherryPy, Bottle, and Pyramid.
What is multithreading Python?
Python is able to implement multithreading, which involves spawning new processes before a running process completes. This means that a Python script can have several processes running on a CPU simultaneously and that speeds up the execution of the module.

