
Our funding comes from our readers, and we may earn a commission if you make a purchase through the links on our website.
The Best Operating System Monitoring Software
UPDATED: October 31, 2023
“Everything fails all the time” –Werner Vogels, Vice President & Chief Technology Officer at Amazon.com
Vogels believes that it is not possible to run a service 100% all the time – Systems Just Fail.
Running infrastructure, services, and applications that require a guaranteed up-time tend to be a complex game. We simply cannot have a perfect and ideal system, but we can try to tell when something is about to happen and do something about it.
This is where Operating System Monitoring Tools and Software come into play.
Here is our list of the best Operating System Monitoring Software:
- SolarWinds NPM for OS Monitoring – FREE TRIAL This is the leading network monitoring system but it can also examine the operating systems of network devices. The tool uses SNMP processes to get warnings about problems with network devices. This software runs on Windows Server and you can get it on a 30-day free trial.
- Paessler PRTG – FREE TRIAL This package of monitors for servers, networks, and applications can be tailored and it includes sensors that watch over operating systems.
- SolarWinds Server & Application Monitor (SAM) – FREE TRIAL This package monitors servers and the applications that run on them, with operating system tracking. Runs on Windows Server.
- Site24x7 Server Monitoring – FREE TRIAL This cloud-based system is able to watch over endpoints running and it can also monitor cloud platforms and SaaS packages. Start a 30-day free trial.
- ManageEngine OpManager – FREE TRIAL Monitors networks and servers and that includes operating system monitoring. Available for Windows Server and Linux. Download a 30-day free trial.
- Nagios XI Monitors Windows and Linux operating systems as well as server resources, applications, and networks. Runs on Linux and will run on Windows over a hypervisor.
- Quest Foglight Evolve This package can monitor on-premises and cloud servers as well as virtualization. Runs on Windows Server or Linux.
- EventSentry This package is a performance and security monitor that includes a log manager and it will watch over the performance of your server operating systems. Runs on Windows Server.
- Zenoss Monitore operating systems as well as other server resources plus networks and applications with this flexible package. Runs on Linux.
- ITRS OP5 Monitor This system monitoring package will watch over all of the resources of your servers, including operating systems and it also monitors networks. Available for Linux.
Although computers are designed to check their own resources periodically and self-heal, sometimes unexpected code errors in software or high temperature due to malfunctioning hardware can impact a system’s resources.
The need to implement an all-in-one OS “Operating System” monitoring software and solution is necessary to minimize those failures. An OS Monitoring Tool will collect periodic information from core components, analyze it and display the results in real-time graphics. As soon as an event is triggered, they will alert you so you can work on the problem.
Which Operating Systems can be Monitored:
A comprehensive monitoring tool can help you test the performance in different types of Operating Systems and Servers, such as:
- Windows XP, Vista, 7, 8, 10, 2008 Server, 2012 Server, 2016 Server, Linux, UNIX, and Mac Osx.
- Windows WMI (Exchange Server and Microsoft SQL Server).
- Redhat Enterprise Linux, Suse Linux Enterprise Server, CentOS, etc.
- Others: Citrix XenServer, Hyper-V Server, etc.
System Components & Metrics to Monitor:
Desktop or Server OS monitoring basically relies on checking services, event logs, and performance counters. System Monitoring tools should be able to gather and display the following system metrics:
- CPU Utilization: A process can either reduce or increase the CPU overall consumption. A process could enter a hung state due to errors in the code and increase the usage of the CPU, leading to a potential rise in temperature.
- Network Monitoring: A faulty network adapter, incorrect switch settings, protocol failures or faulty hardware can affect the network bandwidth and even entire traffic in the network.
- Memory: Excessive memory usage could also impact an OS. For example, too much cache usage (% of memory) can lead to a performance crash.
- Physical Disk: High average response times could indicate a faulty physical disk. Swapping to available partitions and freeing space on the volume are common responses.
- Event logs: These are the records for your network security. If something is suspicious or if there is an error, the logs will register the event in the background.
- OS Services: A monitoring tool can alert you when a critical service is paused, running, stopped or terminated. Some important services to check in a Windows Server are Active Directory, DHCP, Sendmail, Plug and Play Service.
- Applications: Some monitoring tools are tailored to check on the app itself, such as Apache, MySQL, IIS, etc.
and any other important features of an Operating System that needs to be carefully managed and monitored (Registry, Systems Files, etc).
The Best OS Monitoring Software & Tools
Our methodology for selecting OS monitoring tools and software
We reviewed the operating system monitoring tools and software market and analyzed the options based on the following criteria:
- An autodiscovery system to log all network devices
- A network topology mapper
- The ability to collect live network devices statuses
- A facility to analyze network performance over time
- A free trial period, a demo, or a money-back guarantee for no-risk assessment
- A good price that reflects value for money when compared to the functions offered
Below you'll find a quick description of each Software suite as well as a few screenshots of their Dashboards, Cost/Pricing and Download links for each.
1. SolarWinds NPM for OS Monitoring – FREE TRIAL
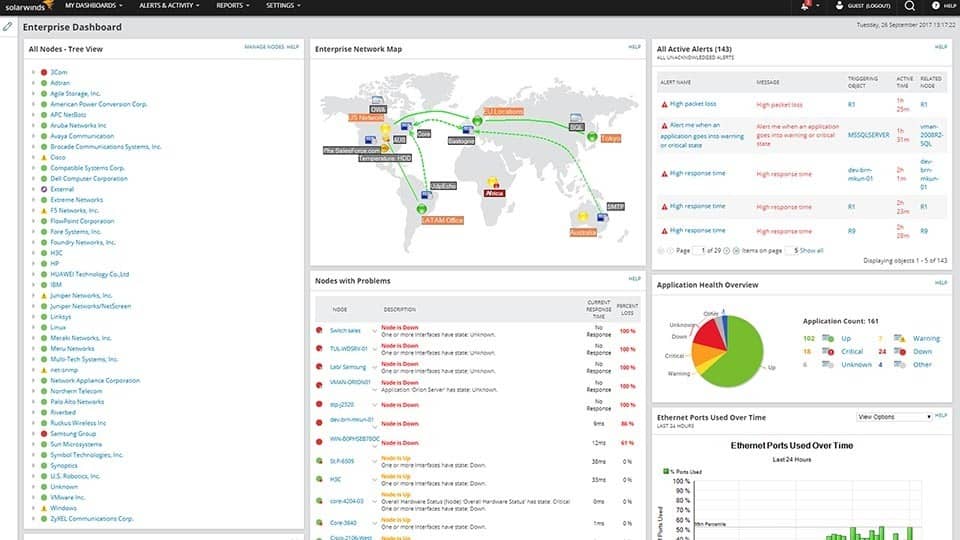
SolarWinds Network Performance Monitor (NPM) is simply one of the best network management tools on the market. It is a very simple-to-use and intuitive network monitoring software. SolarWinds NPM is compatible with many vendors, such as Cisco, Microsoft, Linux, IBM, etc.
Key Features:
- Customizable dashboards
- Advanced alerting
- Real time monitoring
It can monitor availability, performance, and faults on a network. NPM can let you find the root cause of any fault quickly with its smart topology-aware network alerting system. To help maintain networks healthy, NPM shows you an auto-updating map with all entities and their relationships.
For Operating System Monitoring, NPM has the ability to montior every single aspect of an OS and help you pinpoint issues before they become a problem!
Pros:
- Supports auto-discovery that builds network topology maps and inventory lists in real-time based on devices that enter the network
- Has some of the best alerting features that balance effectiveness with ease of use
- Supports both SNMP monitoring as well as packet analysis, giving you more control over monitoring than similar tools
- Uses drag and drop widgets to customize the look and feel of the dashboard
- Tons of preconfigured templates, reports, and dashboard views
Cons:
- This is a feature-rich enterprise tool designed for sysadmin, non-technical users may some features overwhelming
Get a 30-day free trial download!
2. Paessler PRTG – FREE TRIAL
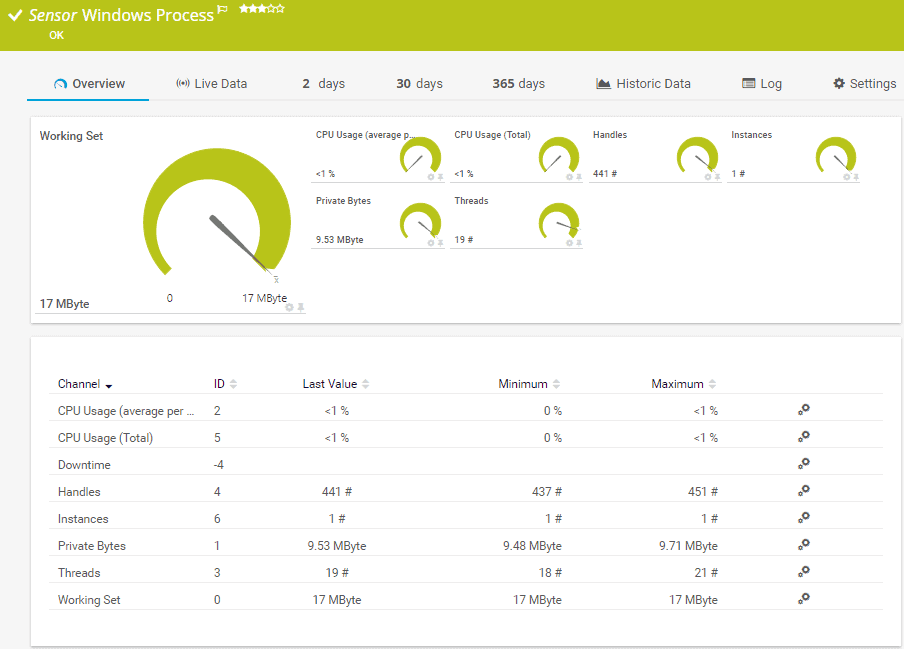
PRTG by Paessler is another Industry Titan in the Network Monitoring and Management realm, but they also do well in monitoring specific operating system vitals, services and critical components.
Key Features:
- Real time monitoring templates
- Highly customizable sensors
- Intuitive user interface
PRTG Monitors the following Operating Systems:
- Windows (CPU, Traffic, Memory, Hard-drives and more)
- Linux (via SNMP and SSH)
- Max OSX (via SNMP)
- Sonicwall, IBM and Hyper-V and VMWare
As you can see, PRTG is very flexible and has really made an effort to cover as many OS's as possible in their Management and Monitoring Platform.
Pros:
- Supports a wide range of cloud monitoring environments – great for companies using multiple cloud products
- Drag and drop editor makes it easy to build custom views and reports
- Offers flexible integration with helpdesk systems and third-party messaging platforms
- Highly customizable sensors – great for building custom monitoring solutions
- Supports a robust freeware version
Cons:
- PRTG is designed with network professionals in mind – not ideal for non-technical users
They have a FREE 100 Sensor Fully Functional download as well, so head over to their Site below and download today!
The first 100 Sensors Free! Start a 30-day free trial with unlimited sensors.
3. SolarWinds Server & Application Monitor (SAM) – FREE TRIAL
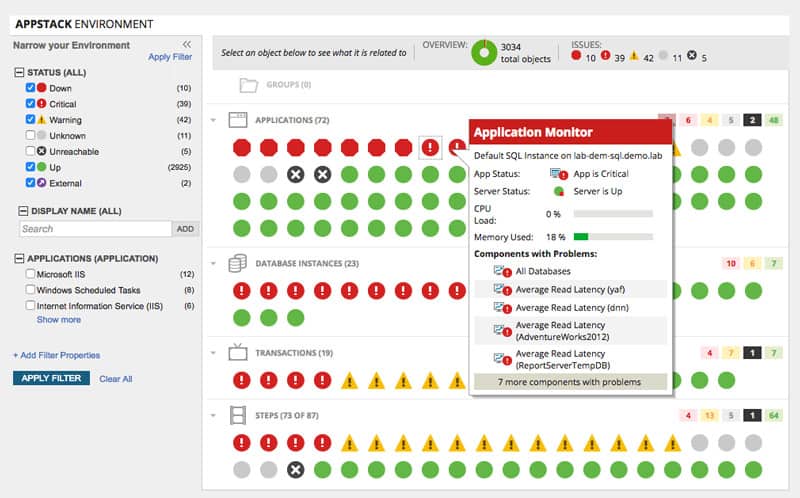
SolarWinds Server & Application Monitor (SAM) tool is an around excellent tool for getting a deep dive into monitoring any Operating System you can imagine.
They have out of the box templates for nearly every version and flavor of the following operation systems: Windows 2003 Server, 2008 Server, 2008 R2 Server, 2012 Server & 2012 R2, Linux, Java, Active Directory, Citrix, HP-UX, AIX, Solaris, UNIX, and more.
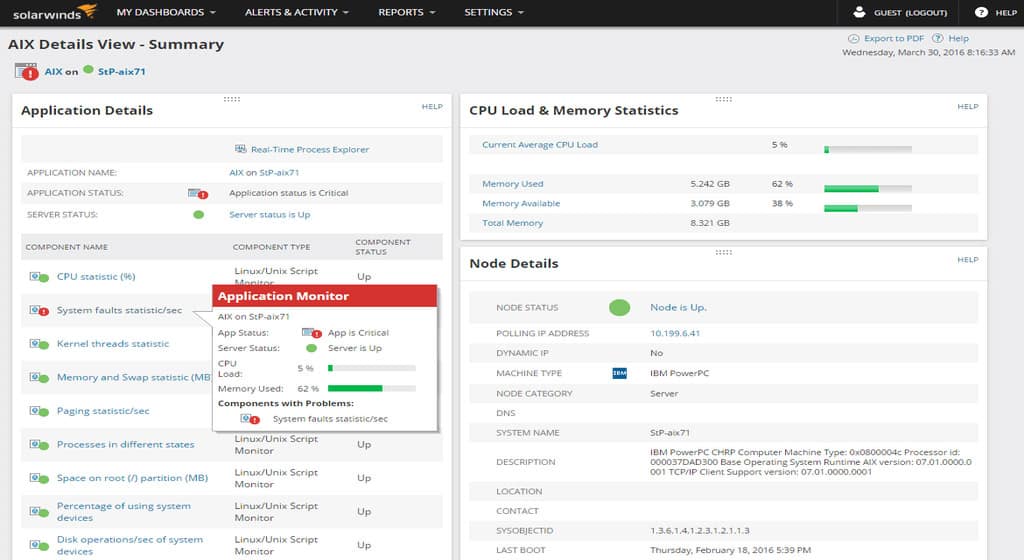
We over 1200+ Services, Programs and Software OS's that you can monitor, this is by Far one of the most versatile OS monitoring Solutions on the Market.
Key Features:
- Comprehensive monitoring
- Wide range of integrations
- Team access controls
Pros:
- Designed with large and enterprise networks in mind
- Supports auto-discovery that builds network topology maps and inventory lists in real-time
- Has some of the best alerting features that balance effectiveness with ease of use
- Uses drag and drop widgets to customize the look and feel of the dashboard
- Robust reporting system with pre-configured compliance templates
Cons:
- SAM is a feature-rich enterprise tool, small businesses may find it overwhelming
We Suggest you download the 30-day Free Trial to get Started Immediately, you'll have 30 Days FREE to try it out and see how Well it works in your Environment!
4. Site24x7 Server Monitoring – FREE TRIAL

Site24x7 Server Monitoring provides supervision for on-premises servers and cloud platforms. It can also watch over the performance of VMware and Hyper-V virtualizations, AWS and Azure platforms, Docker, and Microsoft products, such as IIS, SQL Server, and Office 365.
The on-premises servers that this package monitors can be running Windows, Windows Server, and the Debian, Ubuntu, CentOS, RedHat, Madriva, CoreOS, Fedora, Suse, Gentoo, and Raspberry Pi distros of Linux.
Pros:
- Server discovery and automatic agent installation
- Live monitoring of server resources
- Time series graphs and charts
- Service and process monitoring
- Packaged with network monitoring tools and an APM
Cons:
- No on-premises version
Site24x7 Server Monitoring is part of the Infrastructure plan, which costs $9 per month (when paid annually) to monitor up to 10 servers. Get a 30-day free trial.
5. ManageEngine OpManager – FREE TRIAL
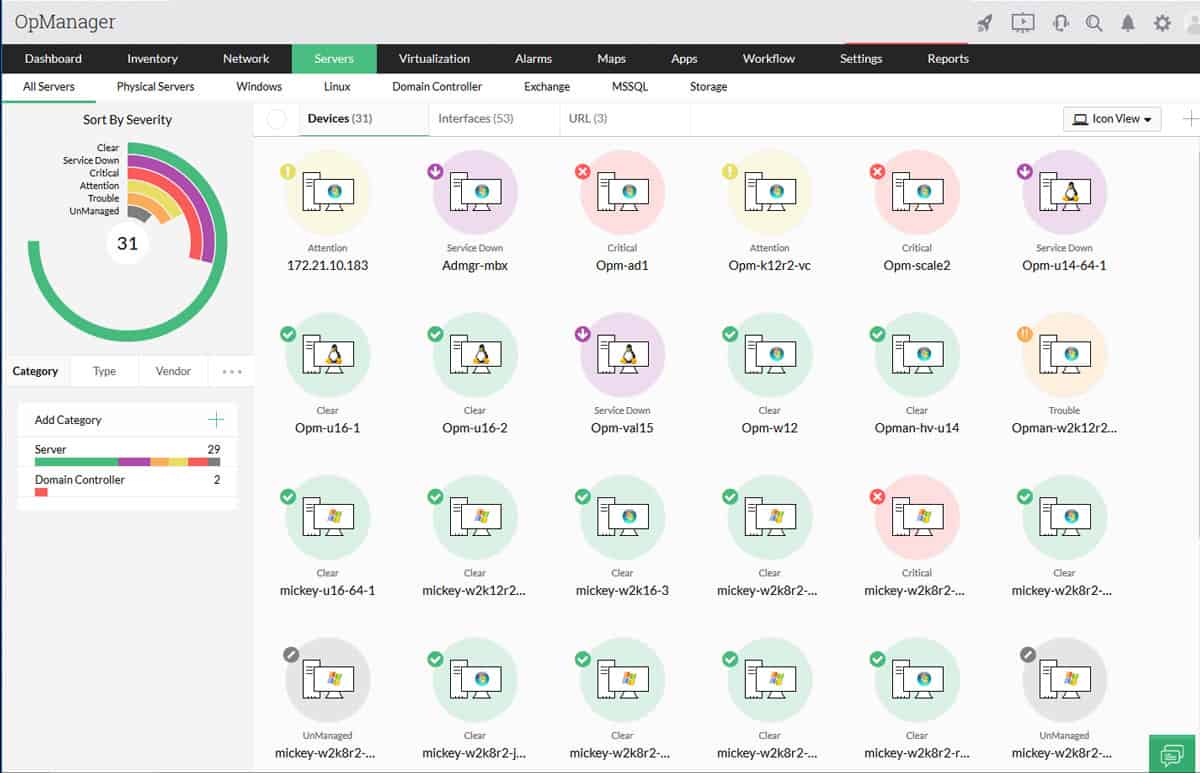
ManageEngine OpManager is a monitoring tool for servers, important applications, processes, and services. The tool uses WMI and SNMP protocols to constantly monitor the server’s availability.
Key Features:
- Automated discovery and network mapping
- Integrated network management
- Customizable dashboards
Out-of-the-box, OpManager can monitor around 300 performance metrics, such as processor queue length, memory, free physical memory, disk I/O, etc. You can check these metrics through recorded logs or with its graphical view in real-time. You can also be alerted of any event and create advanced reports.
Pros:
- Designed to work right away, features over 200 customizable widgets to build unique dashboards and reports
- Leverages autodiscover to find, inventory, and map new devices
- Uses intelligent alerting to reduce false positives and eliminate alert fatigue across larger networks
- Supports email, SMS, and webhook for numerous alerting channels
- Integrates well in the ManageEngine ecosystem with their other products
Cons:
- Is a feature-rich tool that will require a time investment to properly learn
Start a 30-day free trial.
6. Nagios: Operating System Monitoring
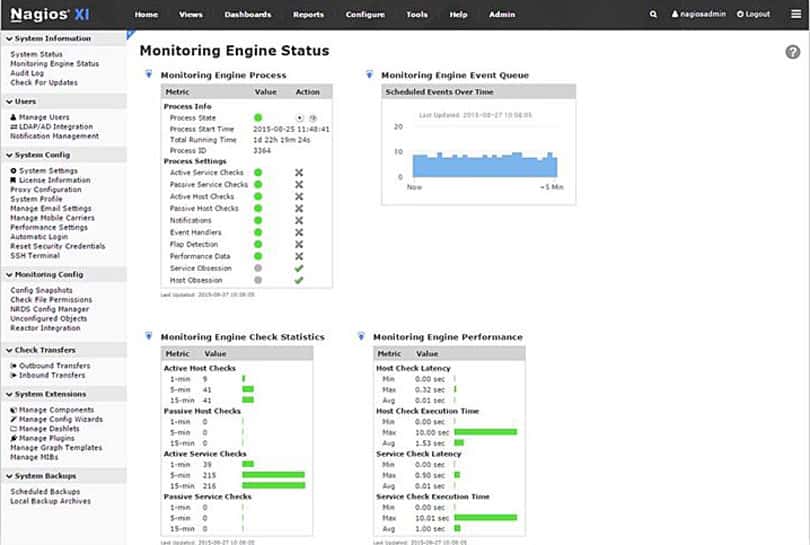
Nagios XI OS monitoring tool provides an extensive functionality for checking desktop and server OSs. Nagios works on Windows, Linux, Unix, OSx, Solaris, AIX, and HP-UX.
Key Features:
- Multi-vendor support
- Intuitive design
- Robust alerting framework
It can monitor your system’s performance counters, services and process states, event logs, specific applications (such as IIS, MySQL, etc), and services. When an event is undergoing, Nagios uses its proactive alarming system to alert managers.
Pros:
- Open-source transparent tool
- Simple, yet informative interface
- Flexible alerting options support SMS and email
- Robust API backend makes it a great option for developers who want to integrate their own custom applications
Cons:
- Would like to see additional integrations into more ticketing systems
- Installation can be technical and complex
Nagios Core FREE and Nagios XI $1,995 with a 60 Day Trial offer!
7. Quest: Foglight for Operating Systems
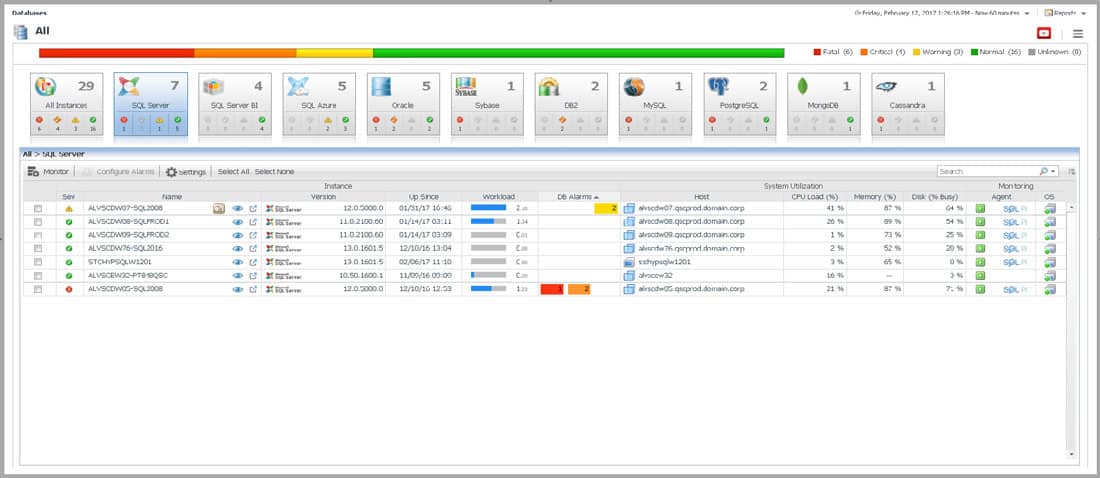
A tool used by midsize to enterprise businesses to monitor the performance across different operating systems. Foglight can monitor servers, databases, network devices, virtual systems, applications, etc.
Key Features:
- Enterprise reporting capabilities
- Real-time monitoring
- Automated asset discovery
With Foglight you can quickly find issues and analyze their root cause with the help of the real-time graphics of the OS processes.
The tool will collect some of the most important metrics such as storage capacity, I/O users, memory and CPU utilization, and create alarms and events if these metrics reach a certain threshold.
Pros:
- Designed for larger businesses and enterprise networks
- Simple user interface – uses color well
- Collects all key metrics such as storage, disk, CPU, and memory
- Highly customizable
Cons:
- Must contact for pricing
Request Pricing on their Website.
8. EventSentry: System Health Monitoring
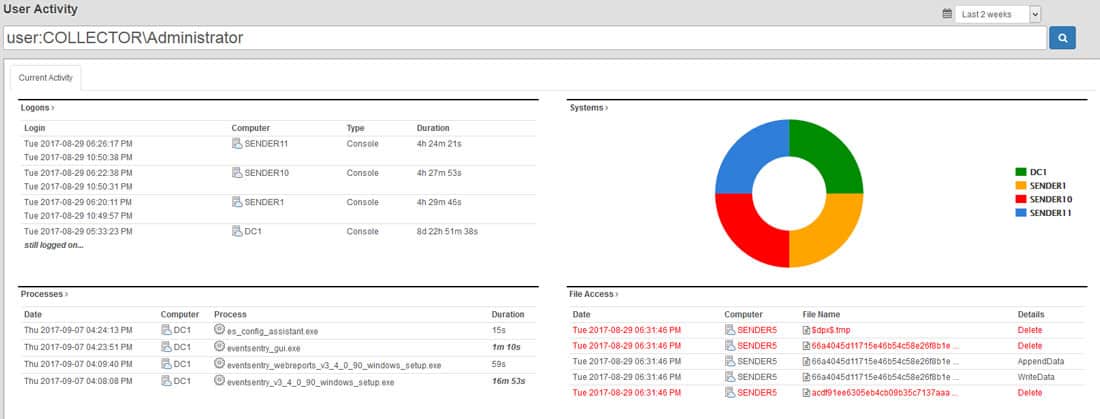
System Health Monitoring checks the most important aspects of different servers to make sure that they are healthy and running smooth. This tool can help a systems administrator know the health of a computer by analyzing different core components such as physical disk space, services, processes, scheduled tasks, applications, and hardware.
Key Features:
- Customizable monitoring
- Intuitive log management
- Performance monitoring
EventSentry’s System Health Monitoring collects data in real-time, analyzes it, and immediately raises alarms if necessary. The tool can also gather history information and predict trends on the system.
Pros:
- Offers live and historical insights for devices via SNMP and other protocols
- Insights are made available through a simple web interface
- Features built-in compliance tracking – ideal for larger organizations
Cons:
- Better suited for medium to large-size networks
Starts at $85 per Device and Price Goes Down as your Buy More Licenses.
9. Zenoss: Server Monitoring
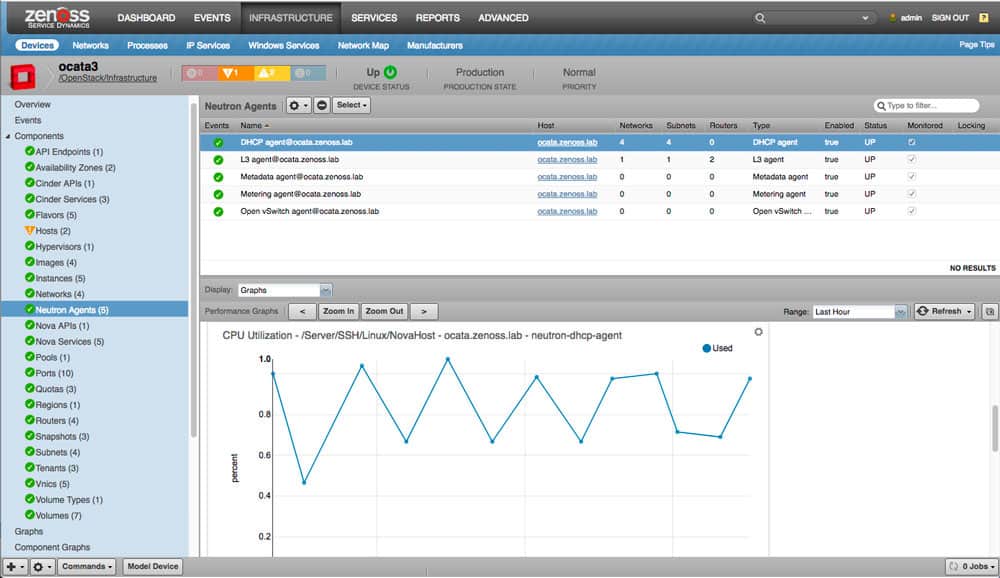
Server Monitoring from Zenoss checks and analyses the performance of servers in real-time. It can help systems administrators monitor a large selection of different OS vendors, such as Microsoft, Oracle, HP, Dell, Cisco, IBM, Linux, in a single dashboard.
Key Features:
- Designed for Linux machines
- Flexible deployment options
- Highly customizable
Zenoss, Server Monitoring tool can gather information on core components like, physical disks, processors, memory cards, interface throughput, and monitor them periodically.
The tool will also auto-discover network elements as they come and go and keep them in a centralized networking inventory.
Pros:
- Open-source, completely free tool with two paid options
- Uses network discovery to automatically pull in new devices that enter the network
- Can support multi-site networks encompassing both LAN and WAN
- A wide range of Cisco ACI plugins offered by the Zenoss community
Cons:
- Support is only for paid tiers
- Dashboard interface needs improvement, specifically the nested menu options on the home screen
The tool will also auto-discover network elements as they come and go and keep them in a centralized networking inventory.
10. Op5 Monitor
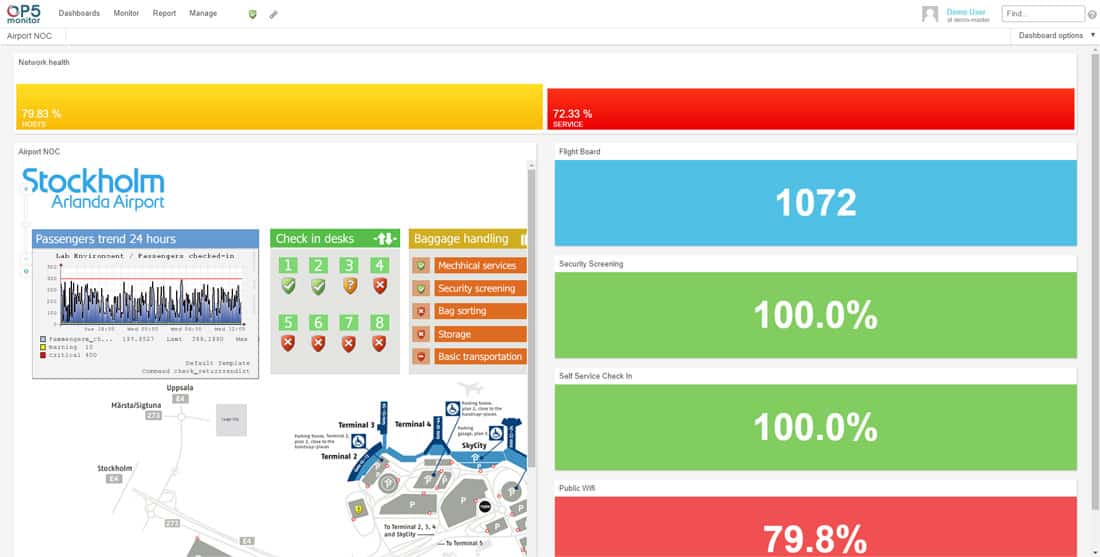
This product is based on the open-source project Nagios, and it’s developed by OP5. The OP5 Monitor is a monitoring tool designed to check servers, applications, networks, and storage (whether on-premise, hybrid, or in the cloud).
Key Features:
- Log monitoring
- Performance monitoring
- Preconfigured alert templates
It can show the performance and health of the entire network in its interactive dashboard, and log all events with the OP5 Logger. With OP5 Monitor you can also gain full control of distributed IT environments in a single place.
Among its most useful features are reporting and alerting, SNMP traps, log server monitoring, management packs, and automatic self-healing.
Pros:
- Focuses primarily on offering their services to large enterprises
- All features and interfaces are designed to scale and handle large amounts of data well
- Simple widget customizations can be added or removed
- Offers geolocation mapping, and dependency mapping to help visualize complicated network services
Cons:
- Must contact sales for accurate pricing information
- The interface could be made more user-friendly with fewer menu options
Request Pricing online.
Conclusion
Operating Systems are not vulnerable to failures, but getting 1 step ahead of them doing so on your Watch is a step in the right direction.
Malfunctioning processes and OS services could increase the load on the CPU, which in turn could put the fans to work hard, which in turn could increase the temperature of the processor… it is an endless cycle.
The Best OS Monitoring Tools will not solve the problem… but it will help you pinpoint the issue before a real catastrophe occurs and maintain your systems healthy.
OS Monitoring Software and Tools for Managing Windows/Linux OS FAQs
What is operating system monitoring?
Operating system monitoring is the process of monitoring the performance and health of computer operating systems in real-time. This includes monitoring key performance indicators (KPIs) such as CPU utilization, memory usage, disk space utilization, and more.
Why is operating system monitoring important?
Operating system monitoring is important because it helps identify performance issues and potential problems before they become critical. This helps prevent downtime, improves the stability and reliability of your systems, and ensures that your applications and services are running optimally.
What KPIs are typically monitored in operating system monitoring?
Common KPIs that are monitored in operating system monitoring include CPU utilization, memory usage, disk space utilization, network traffic, and process utilization.
What tools are used for operating system monitoring?
There are a variety of tools available for operating system monitoring, including SolarWinds Network Performance Monitor (NPM), Atera, Paessler PRTG, ManageEngine OpManager, Nagios XI, and more.
Can operating system monitoring be done remotely?
Yes, many operating system monitoring tools provide the ability to monitor systems remotely, allowing you to monitor your systems from a central location, no matter where they are located.
Can operating system monitoring be customized?
Yes, many operating system monitoring tools allow you to customize monitoring, including setting custom thresholds and alerts, creating custom dashboards, and more. This allows you to focus on the metrics that are most important to you.
How does operating system monitoring help prevent downtime?
Operating system monitoring helps prevent downtime by identifying performance issues and potential problems before they become critical. This allows you to take proactive steps to resolve issues and prevent downtime, improving the stability and reliability of your systems.


SolarWinds Server & Application Monitor Start a 30-day FREE Trial