
Our funding comes from our readers, and we may earn a commission if you make a purchase through the links on our website.
The Best Network Device Monitoring Tools
UPDATED: September 11, 2023
The process of routinely checking on systems, applications, services, and devices (or having them check in) to ensure that they are in good health, productive, and free of errors is referred to as network monitoring.
Techniques and technologies for quality network monitoring can not only inform you when systems or resources have failed or are in a partial state of failure, but they may also foresee and warn against impending IT disasters.
We have combed through as many tools as we were able to locate, selected the most useful ones, compiled them into an easy-to-read manner, and described their primary benefits for you.
Here is our list of the best network device monitoring tools:
- Auvik – EDITOR'S CHOICE This SaaS platform provides network monitoring with both SNMP-based device status tracking and traffic analysis with flow protocols, so you get to track every aspect of your network’s activity. Get a 14-day free trial.
- SolarWinds Network Performance Monitor – FREE TRIAL The most popular network monitoring system, checks the state of network devices by using the SNMP protocol. Moreover, it may also alert you to any potential security threats. Utilizes the Windows Server platform. Start your 30-day free trial.
- ManageEngine OpManager – FREE TRIAL This system provides network device monitoring and server monitoring. It is able to track physical and virtual systems and also wireless networks. Runs on Windows Server, Linux, AWS, and Azure. Start a 30-day free trial.
- Site24x7 Network Monitoring – FREE TRIAL This is a monitoring solution that is cloud-based and is used for monitoring networks, servers, and applications. This monitoring tool keeps an eye on both actual and virtual resources. Start a 30-day free trial.
- Paessler PRTG Network Monitor – FREE TRIAL A set of monitoring tools, the majority of which are network monitors. It is a network monitoring tool. Utilizes the Windows Server platform. Start your 30-day free trial.
- Atera A collection of remote monitoring and management tools that are hosted in the cloud and include automated network monitoring as well as an application for network mapping.
- Datadog Network Monitoring Gives you good visibility over each of the components of your network and the connections between them, regardless of whether your environment is in the cloud, on-premises, or a hybrid combination of the two.
- Nagios An infrastructure monitor that may be extended and is based on the open-source and free Nagios Core software. It also has thousands of free plugins available. Runs on Linux.
The Best Network Device Monitoring Tools
Our methodology for selecting network monitoring tools
We reviewed the market for network device monitoring tools and analyzed the options based on the following criteria:
- An autodiscovery that compiles a network inventory
- An automated network topology mapper
- Constantly updated network documentation
- Device status tracking with SNMP
- A facility to process performance problem notifications into alerts
- A free trial period or a demo for no-risk assessment opportunity
- A fair price that reflects value for money when compared to the functions offered
1. Auvik – FREE TRIAL
Tested on: Cloud/SaaS
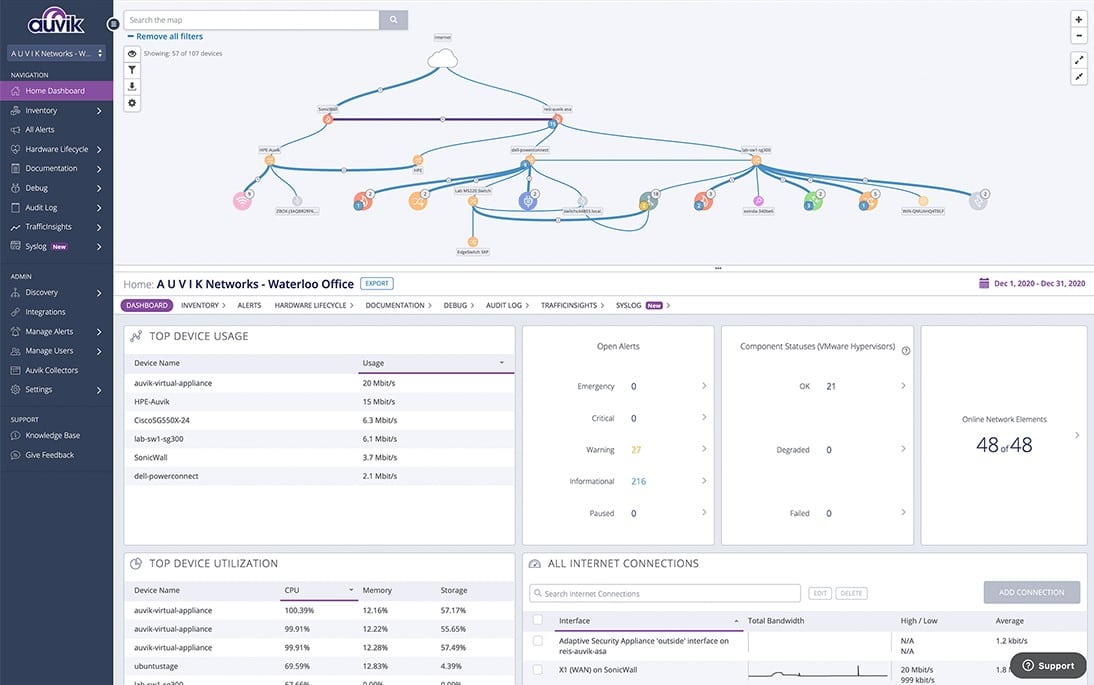
Auvik is a network monitoring solution that is hosted in the cloud and comes with a variety of tools for managing systems. The package can be accessed using a web browser, and the installation process for the collectors on your machine begins when you create an account with the provider. The Auvik package enables monitoring of various locations while also centralizing control over those locations. Because of this, the package is perfect for monitoring a wide area network (WAN).
Key Features:
- Alerts and Notifications: It has by default 50 pre-configured alerts and also supports customizable alerts . you can schedule how you want to receive alerts.
- Get Live and Historical Data: It continuously monitors your network from topology to config history for troubleshooting, analyzing and planning.
- Syslog for Root Cause Detection: you can see logs about network issues directly from the dashboard to see everything in the contextual view.
- VPN Monitoring: This is best for remote workers. It monitors the number of active VPN sessions and prevents downtime due to capacity issues.
Why do we recommend it?
We recommend Auvik because it helps you stay informed about your network through alerts and notifications. If you want to have a peace of mind and keep an eye on your network all the time, this tool is the best choice because it checks everything from structure to device performance. It also supports customizable alerts hence you can easily find the issues and fix them faster.
The process of discovering networks is where the service provided by Auvik gets started. This causes the monitor to immediately generate all of the fundamental data that is required for it to function properly. Since the discovery service is always running, it is always able to detect when new devices are connected to the network.
When the monitoring service is put into operation, the system will sound an alarm whenever any of the predetermined limits are exceeded. Because of this technique, technicians can go on to other activities, secure in the knowledge that the thresholds provide them enough time to prevent problems with system performance that would be obvious to users.
The processing power that is used by Auvik comes from the cloud servers that are part of the service. However, for the system to function properly, each monitored location must have collectors installed. Both Windows Server and Ubuntu Linux are supported by this software. Additionally, it is doable to operate the collector within a virtual machine.
Who is it recommended for?
Auvik is used by network experts because it helps to save a lot of time. It handles data collection task automatically so experts can focus on critical tasks. Experts can easily monitor SSL VPN capacity, instantly seeing how many VPN sessions are active and if they're nearing the license limit.
Furthermore, Auvik allows remote employees to avoid downtime caused by VPN capacity concerns, assuring continuous production. It is a must-have solution for network professionals who want to improve remote worker assistance and network administration efficiency.
Pros:
- Checks Internet Connection: You can manage multiple sites using ISP and check for dropped packets, jitter, or latency.
- Quick and Easy to Set Up: it includes deep performance monitoring; hence, users can drill down deeply and achieve the good performance they want.
- 14-day Free Trial: You can try to learn this tool’s features and functionality for 14 days and without needing credit card information.
- Real-Time Network Visibility: It gives real-time network visibility to respond to the network problems immediately and enjoy faster network.
Cons:
- Overloading Issue at the Beginning: Many users find that it shows an overload warning at Initial data and doesn't support all devices.
Auvik is available on a 14-day free trial.
EDITOR'S CHOICE
Auvik is our top pick for a network device monitoring service because it adds traffic monitoring to its device monitoring service.s Buyers who just want that SNMP-based device monitoring service should look at the Essentials edition. The Performance edition provides network traffic monitoring services as well as device monitoring. This cloud-based service allows network managers to monitor multiple sites from one dashboard and the console is accessed through a Web page, so it is accessible from anywhere.
Download: Get a 14-day FREE Trial
Official Site: https://www.auvik.com/#trial
OS: Cloud-based
2. SolarWinds Network Performance Monitor – FREE TRIAL
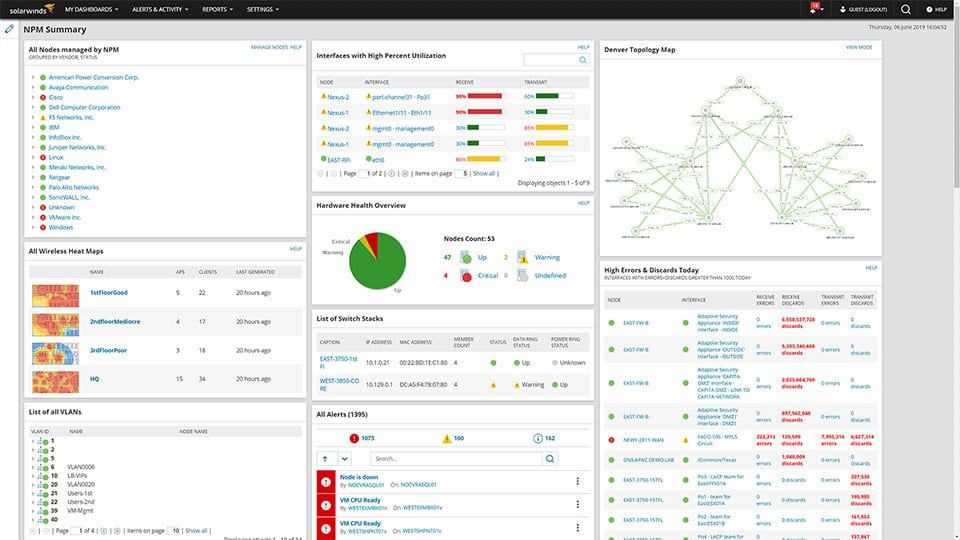
SolarWinds Network Performance Monitor requires little effort to install and can be up and running in almost no time at all. The device deploys itself within an hour of autonomously discovering network devices and doing so. Because of the straightforward manner in which it monitors and controls a complete network, it has one of the most user-friendly and instinctive interfaces possible.
Key Features:
- Network Optimization: Improve your network's speed, reliability, and efficiency.
- Network Performance Reporting: Access detailed reports showing important performance metrics, allowing you to make informed decisions.
- Network Mapping Tools: Create customized maps and visualize data paths within your network for better understanding.
- Network Latency Test: Analyze how quickly your network responds to requests, helping you identify and fix delays.
Why do we recommend it?
We recommend SolarWinds Network Performance Monitor because it provides complete visibility into the health and performance of your Cisco ASA environment. NPM allows you to simply monitor the state of VPN tunnels, which are essential for accessing multiple sites. This ensures that consumers can access critical network services without interruption, keeping your organization functioning smoothly.
The product has a wide range of available customization options, and its user interface is simple to administer and adapt in a short amount of time. You can personalize the performance dashboards, charts, and views that are hosted on the web. You can devise a custom topology for the entirety of your network's physical architecture. You also can generate individualized dependency-aware intelligent warnings, in addition to a great deal of other functionality.
Who is it recommended for?
If you are an IT professional or network administrator you must use this NPM tool to immediately identify and handle network issues reported by users. Using NPM's path analysis tool, you can receive insights about essential network paths, such as devices, apps, networks, and suppliers, all on a single page. This eventually reduces issues and makes sure users have consistent access to critical services.
Pros:
- Wifi Packet Sniffer: Offers fault, performance, and network availability monitoring, along with features like cross-stack network data correlation and hop-by-hop network path analysis.
- Cisco Network Device Monitoring Software: NPM allows you to monitor and analyze the fault, availability, and performance of Cisco devices.
- LAN Monitoring: Users can maintain health and stability of the LAN environment . you can also customize network alerts to check network performance and status.
- Monitor Router Traffic: Gives you a centralized overview of the types and number of routers being monitored hence you can effectively manage router resources.
Cons:
- Limited Compatibility: NPM tool only works with Windows servers so if you are organization with other OS , this tool is not your fit.
The program is sold as distinct modules, each of which corresponds to a certain function. The SolarWinds Network Performance Monitor, which comes with a 30-day free trial, has a starting price of $1,995 and is sold as a one-time license that also includes the first year of maintenance.
3. ManageEngine OpManager – FREE TRIAL
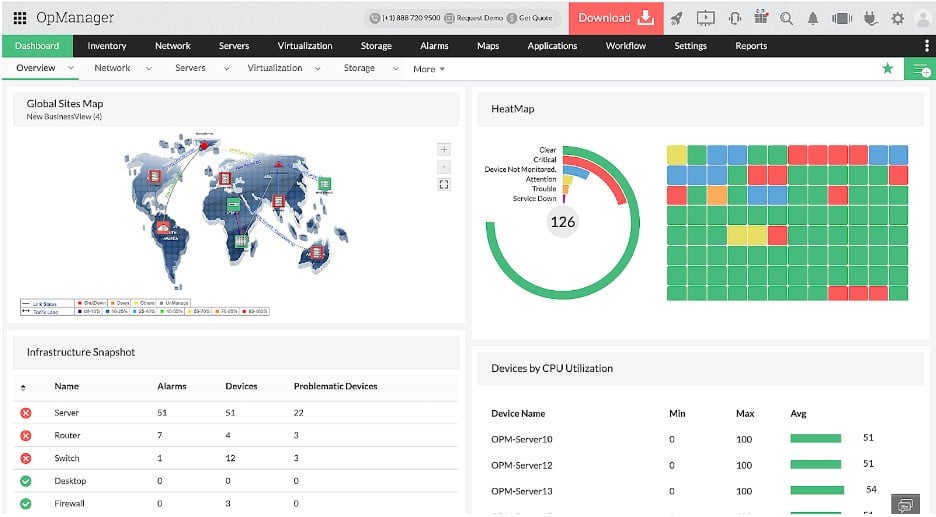
ManageEngine OpManager provides monitoring for networks, servers, and virtualizations. It is based on the Simple Network Management Protocol, so it is able to send out broadcast requests for reports from SNMP device agents. Each device agent responds to the request with a report called a Management Information Base (MIB). By compiling MIB data, OpManager is able to create a network inventory and draw up a topology map.
Key Features:
- Physical and Virtual Network Monitoring: It monitors your physical and virtual servers 24/7 to ensure optimal performance.
- Wireless Network Monitoring: It involves monitoring WiFi strength, wireless routers, switches, and other network statistics.
- WAN Monitoring: OPmanager uses Cisco IP SLA technology, which provides a visual representation of WAN links, outages, and performance issues.
- Fault Management: It has amazing fault management functionality, which shows unwanted events and issues in a classified manner, color-coded according to their critical level.
Why do we recommend it?
Because ManageEngine OpManager can monitor every component of a data center and network with a single package, we highly recommend it. OpManager effectively monitors virtualized servers, which are typical in contemporary settings, thanks to native virtualization support. Its Root Cause Analysis tools also help to correlate performance measures, which makes problem-solving procedures easier. With so many capabilities, OpManager is a useful tool for monitoring the functionality and health of your business's IT infrastructure. It offers insights and suggestions for streamlining processes and reducing downtime..
The OpManager system repeats its MIB requests continuously and this provides live network device monitoring. Details in the MIB also let OpManager know if devices have been added, moved, or removed. The system updates the network inventory and redraws the topology map automatically in response. This system also sees when rogue devices connect to the network.
Other functions in OpManager provide monitoring for Hyper-V, VMware, Citrix, Xen, and Nutanix HCI virtualizations. The system can keep track of internet connections between sites and out to cloud platforms.
The software for OpManager runs on Windows or Linux. It is also available as a service on AWS and Azure. The system can also be supplemented by the linked NetFlow Analyzer, which monitors network traffic.
Who is it recommended for?
IT experts and network administrators use this tool because it helps in reliable network monitoring. This tool has been trusted for 15 years due to its performance. OpManager gives complete information into servers, virtual machines (VMs), switches, routers, and more. Because of its affordability and ease of use, small and large businesses can use it. By tracing problems back to their source, OpManager helps users to effectively detect and fix problems.
Pros:
- Storage Monitoring: Monitors various storage devices like Fiber Channel switches, storage arrays, and tape libraries. It provides capacity utilization monitors, storage growth trend graphs, and other monitors to ensure efficient storage management.
- Network Mapping: OpManager provides automatic L1/L2 network mapping, to help in the rapid detection of network outages and performance degradation.
- Network Visibility: Supports both SNMP device monitoring and flow-based traffic monitoring to have the complete network visibility and track total traffic flowing through interfaces.
- Network and Configuration Management: Handles network configuration backup, mitigating security threats arising from unauthorized configuration changes.
Cons:
- Complex Licensing Structure: Users can find it difficult to navigate between modules and may need to pay extra licenses to access particular capabilities, thereby complicating license management.
Price:
- Standard Edition (10 devices) – from $245 per year
- Professional Edition (10 devices) – from $345 per year
- Enterprise Edition (250 devices) – from $11,545 per year
ManageEngine offers OpManager for a 30-day free trial.
4. Site24x7 – FREE TRIAL
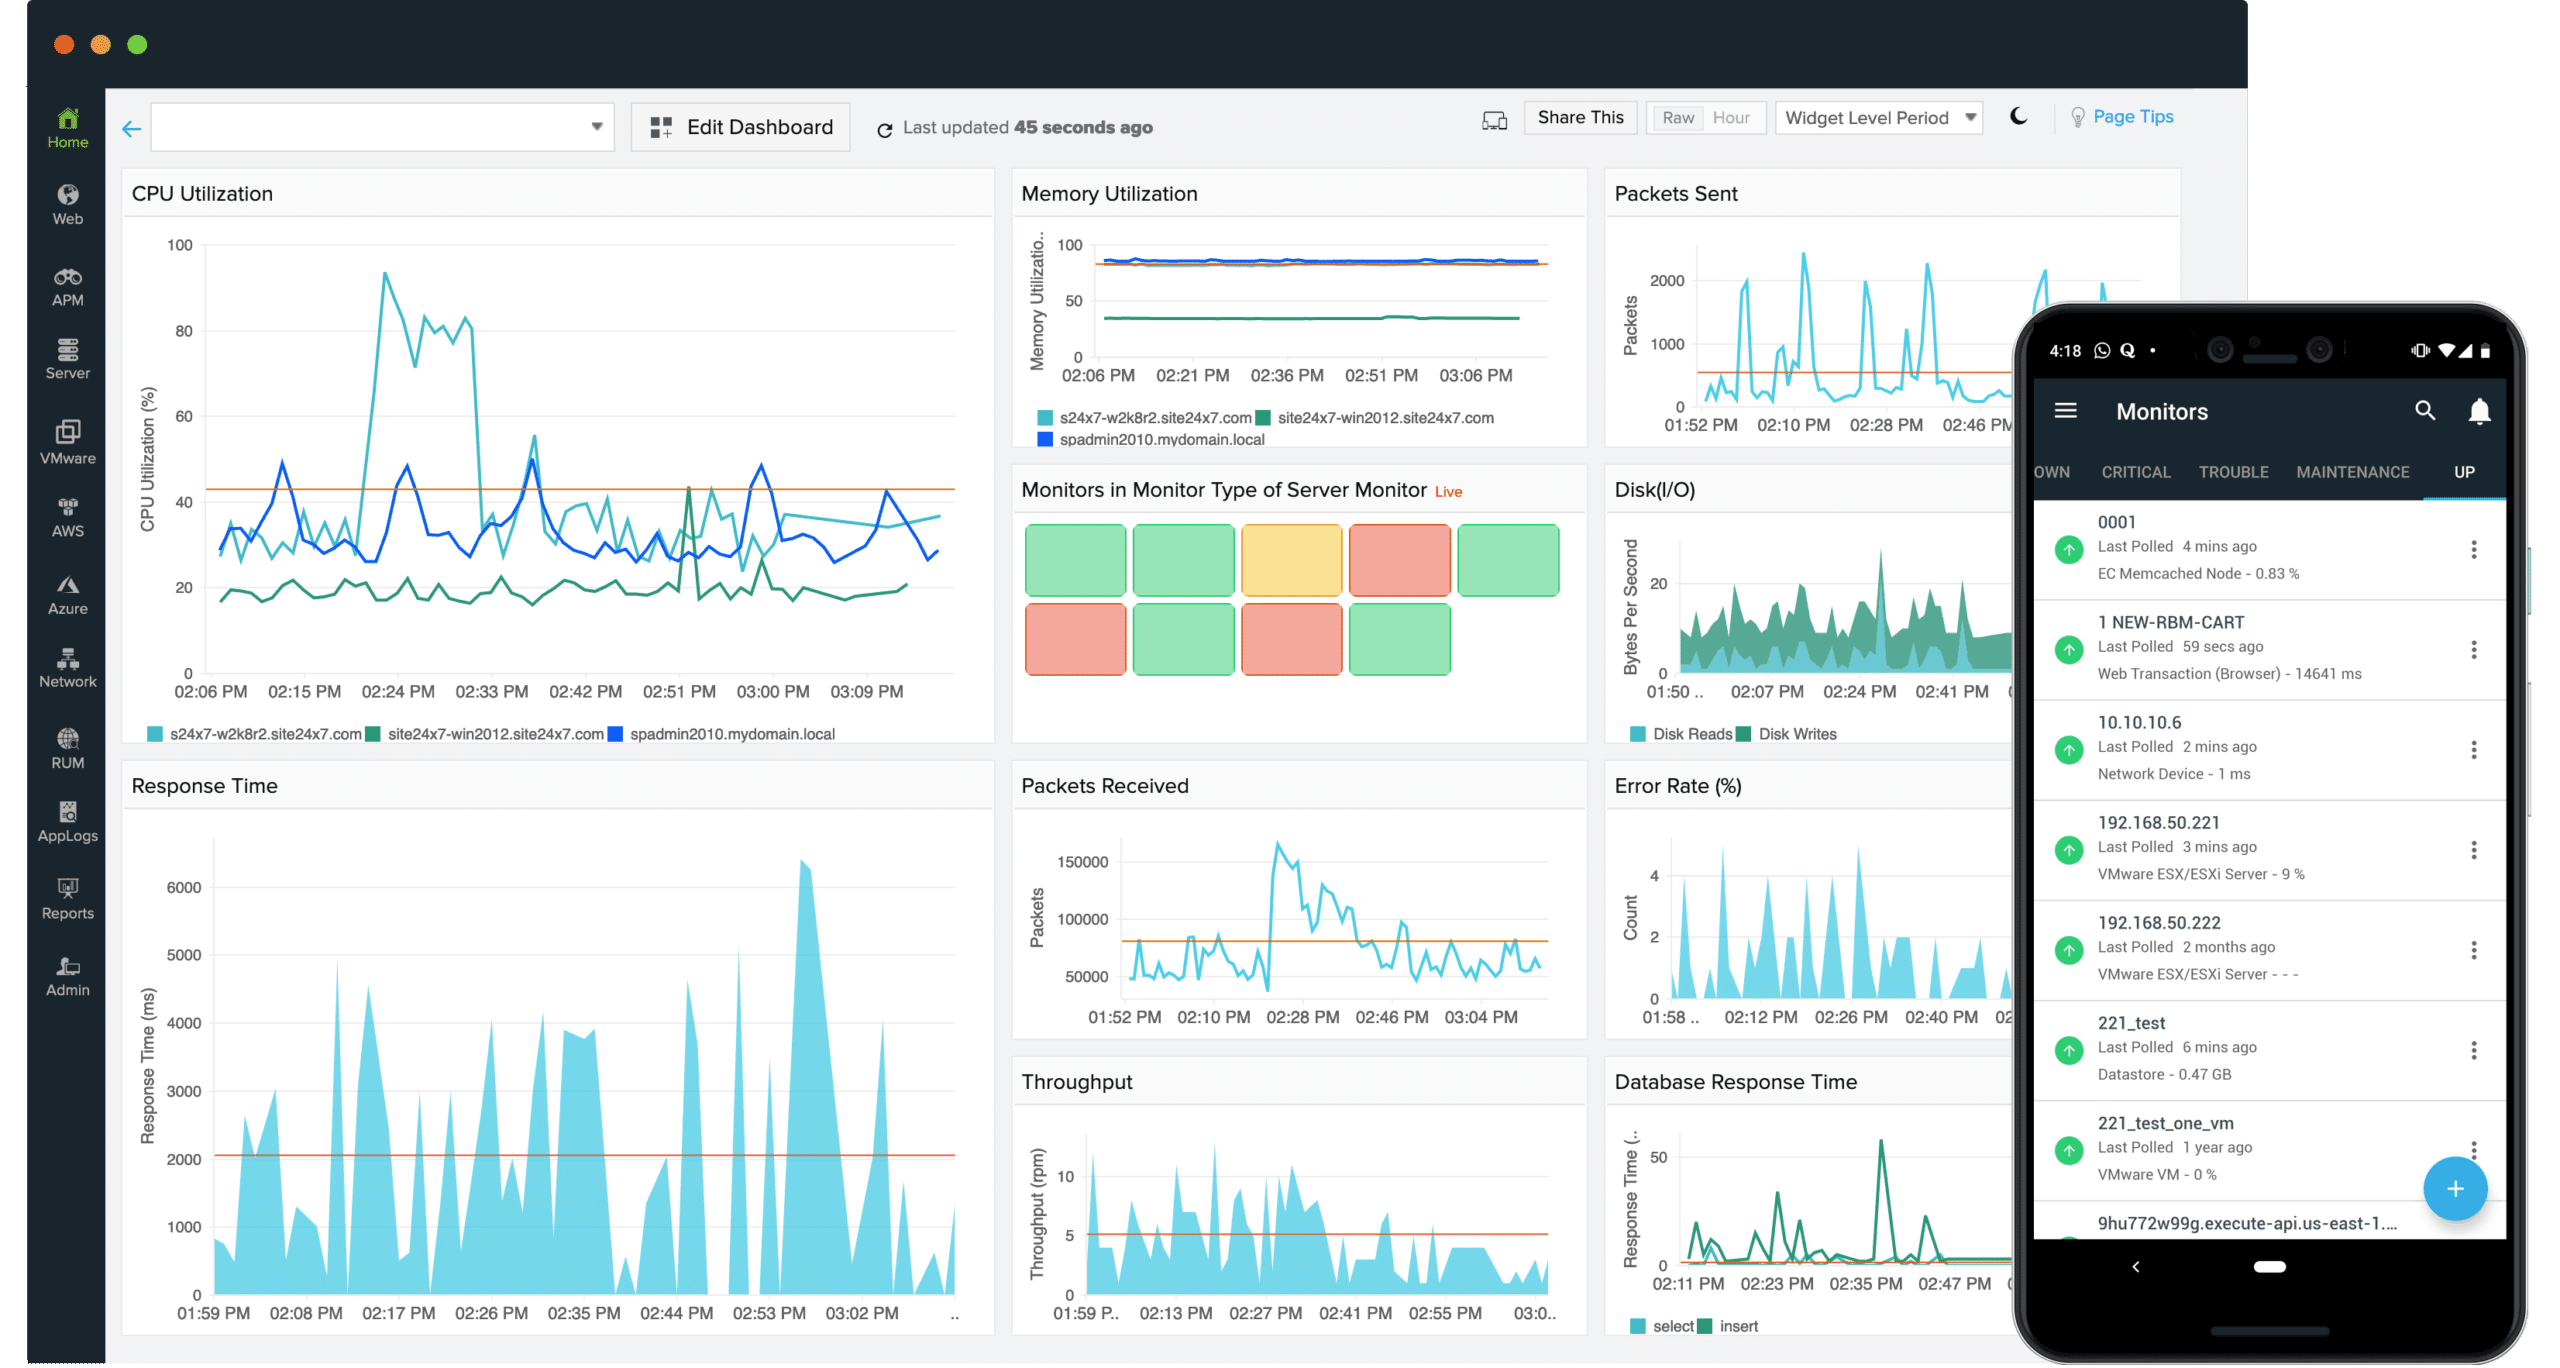
The monitoring services provided by Site24x7 include coverage for networks, servers, and applications. The network monitoring service included in this package initiates the process by first searching the network for devices that are linked to it. The information technology department creates a network topology map and reports its results in a network inventory.
Key Features:
- Website Availability Monitoring: It checks for uptime and makes sure your website is easily accessible from all major cities.
- Website Defacement Monitoring: Website defacement protects your website from hacking and checks for the insertion of malicious code or any hazardous content.
- FTP Transfer Monitoring: Involves monitoring round-trip time, FTP downloads and uploads, response time, and much more.
- REST API Monitoring: Users can check how their API performs across 130 cities across globes and check for latency issues, troubleshoot issues, and much more.
Why do we recommend it?
Monitoring of crucial network components including firewalls, switches, and routers are the top functionality of Site24x7. Users can efficiently manage complicated networks by proactively detecting and resolving problems thanks to deep performance visibility. In order to guarantee the best possible performance and dependability of IT systems, Site24x7 offers the tools and insights required for managing network infrastructure and cloud environment monitoring.
The Network Monitor will poll the devices once per minute to obtain status data, and it will do so using the processes from the Simple Network Management Protocol (SNMP). The inventory and topology map will be updated to reflect any changes in the network infrastructure that are brought to light by the responses to these questions.
The dashboard of the monitor displays live data that has been interpreted based on the results of the device responses. The user can personalize the dashboard's panels and can access it with any browser that is considered to be standard.
If the SNMP system identifies a problem with the device that it is monitoring, it grants the device agents the authority to immediately issue a warning rather than waiting for a request to do so. These messages, also known as Traps, are detected by Site24x7 Infrastructure, which then causes an alert to be produced. This warning can be communicated to technicians via text message (SMS), email (email), phone call (voice call), or instant messaging post (IM post).
Who is it recommended for?
DevOps professionals that want quick application troubleshooting find Site24x7 very helpful. With its Application Performance Management feature, developers can monitor all important parameters at a glance and guarantee the best possible app performance. With support for apps developed in Java, .NET, AWS, Azure, iOS, and Android environments, Site24x7 enables real-time user experience monitoring across platforms, browsers, locations, ISPs, and other factors.
Pros:
- Linux Syslog Monitoring: It monitors your system log and immediately notifies you when there is an unusual pattern change in Syslog.
- Windows Event Log Monitoring: It monitors for events on windows, server process,custom apps, batches and more to reduce downtime.
- 100+ Plugin Integrations: It supports over 100 plus plugin integrations, it helps to check for elements impacting your system, you can also create custom plugins according to bottlenecks and needs.
- IT Automation: Automation gives quick alerts to manage and fix network problems in seconds.
Cons:
- False Alerts: Users notice that the tool occasionally sends false alerts which can be misleading sometimes.
Start with a 30-day free trial.
5. Paessler PRTG Network Monitor – FREE TRIAL
The Paessler PRTG Network Monitor software has gained a lot of popularity due to the extensive infrastructure management capabilities it offers. A hierarchical view that highlights performance and warnings may be readily shown to include all of the devices, systems, traffic, and applications that are part of your network. PRTG utilizes a wide variety of different technologies to monitor the complete IT infrastructure, including SNMP, WMI, SSH, Flows/Packet Sniffing, HTTP requests, REST APIs, Pings, and SQL, among many more.
Key Features:
- Comprehensive Monitoring: PRTG brings a broad area of monitoring to the table which spans networks, servers, applications, and devices by SNMP, WMI, Flow technologies, packet sniffing, and OS-specific REST APIs.
- Flexible Alerting System: Besides this, Nagios provides a variety of alerting mechanisms for email, SMS alerts, or push notifications for issue resolution or to keep you notified about changes in status, such as problem solutions.
- Intuitive Dashboard and Reporting: PRTG provides a personalizable and convenient dashboard that comes with visual maps and graphs for simple data interpretation, as well as detailed reports that can be scheduled for analysis and surpass compliance.
- Auto-Discovery and Pre-Configured Device Templates: The auto-discovery tasks itself perform automatic identification and configuration of network devices. Moreover, a template with recommended sensors can be used and allow the fast setting up of the monitoring.
Why do we recommend it?
PRTG provides you with real-time data for availability, health, traffic, and bandwidth by continually monitoring servers, firewalls, routers, switches, applications, and services. Its representations, like as graphic maps and dashboards, make problem detection easier and allow for faster troubleshooting. PRTG provides users with unrivaled access into their network infrastructure, allowing them to address issues quickly and ensure maximum performance.
It is one of the better options available to companies that have relatively little experience in the field of network monitoring software. The user interface is quite strong while still maintaining a very simple and straightforward design.
The ability of PRTG to monitor equipment in a data center using a mobile app is a feature that sets it apart from other similar products. The physical hardware receives a printed-out QR code that matches the sensor, which is then affixed to the hardware. The code is scanned using the mobile app, and a brief description of the product is presented on the screen of the mobile device.
Who is it recommended for?
If you are looking for an affordable solution then PRTG is your go to tool. System administrators use this tool frequently because of its wide capabilities, which include monitoring for hardware, software, network performance, and data traffic. It includes features such as free alarm systems, reports, and mapping, which are crucial for optimal network management.
Pros:
- Ease of Use: PRTG is very intuitive which can be appreciated by people with all levels of experience in forwarding processes. Additionally, the platform has templates that can be readily copied if necessary.
- Scalability: PRTG is good for small networks to large corporations, and it is able to provide scalable monitoring of thousands of devices or systems at a single installation, making it suitable for any size of a company.
- Free Version Available: Through Paessler, you can enjoy PRTG’s free version with up to 100 sensors supported without a fee. This is very good in the small business world or for those users who want to run the software before getting it.
- Versatile Monitoring and Integration Capabilities: Monitoring and integration traits allow users to track essential business parameters helping in optimizing business performance levels.
Cons:
- Complexity in Large Deployments: PRTG's user-friendly design can become complex in large, diverse environments due to numerous sensors and intricate configurations, requiring significant time and effort to master.
Paessler PRTG Network Monitor comes with a 30-day free trial.
6. Atera
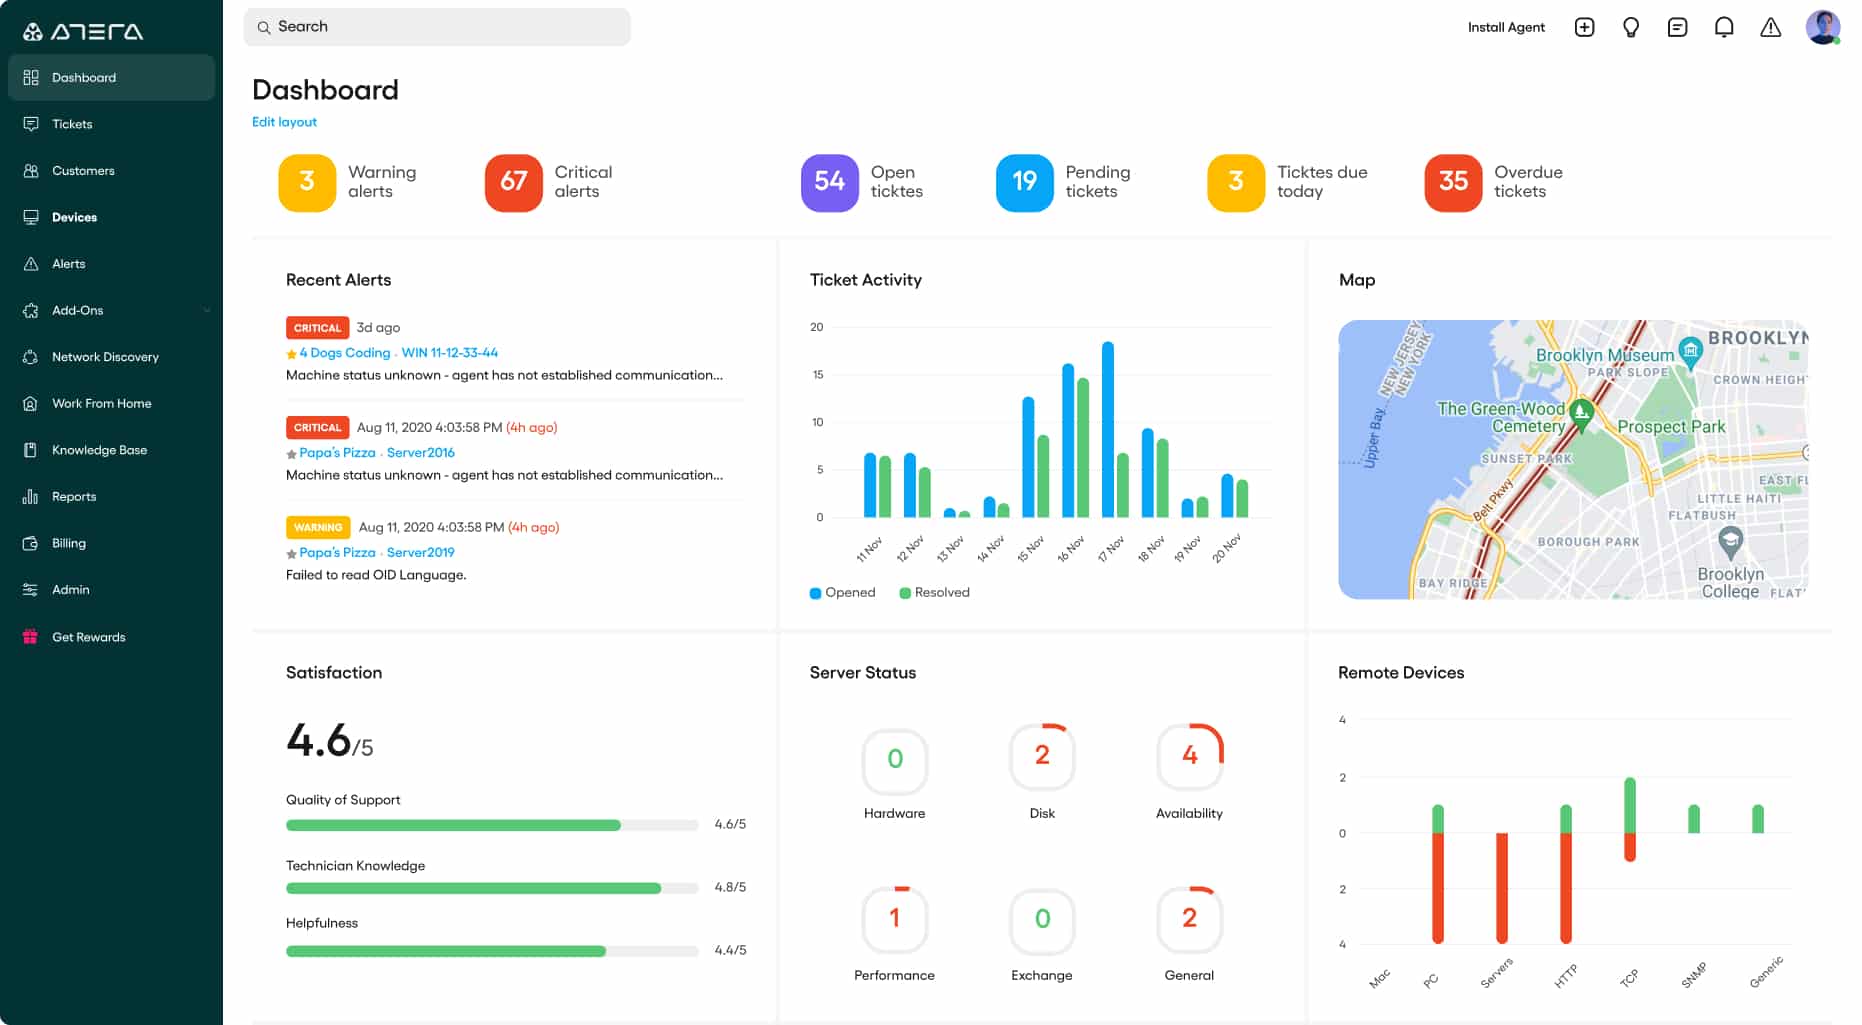
Atera is a software package that was developed specifically with managed service providers in mind. It is a platform that is delivered as Software as a Service (SaaS), and it incorporates technologies for Remote Monitoring and Management (RMM) as well as Professional Service Automation (PSA).
Key Features:
- Integrated RMM and PSA Solution: Atera synchronizes with RMM and PSA tools, and therefore all commands such as billing, client, and incident management are done from one screen.
- Cloud-Based Architecture: Atera serves as a remote-based IT service that grants IT engineers, as well as MSP, the ability to enhance response and hearing accessibility by being there at the time they are needed.
- Automated Processes and Alerts: It processes information about the operations in the system as quickly as possible, helping to take the response for the warning signs and faults and solve them during the process.
- Built-in Remote Access and Support: The platform includes remote desktop access and support capabilities, enabling IT professionals to troubleshoot and resolve issues without the need for on-site visits. This feature supports quick resolution times and enhances productivity.
Why do we recommend it?
If you are a business dealing with device management more then Atera is a reliable tool. It has a transparent pricing structure, allowing users to manage unlimited devices without financial strain. Users can save greatly while having the ability to scale their operations without incurring additional costs.
The remote operation of the network monitoring system is accomplished using an agent that is installed on Windows Server. The agent gives the service the ability to search the network, and discover all of the devices in the network that are running it. This is accomplished with the help of SNMP, with the agent serving in the role of the SNMP Manager.
The SNMP protocol gives the agent the ability to recognize these messages. These are then forwarded to the dashboard that Atera uses to monitor the network, where they are displayed as alerts. Although Atera does provide an automatic topology mapping service, it is only available as an additional purchase in addition to the primary subscription packages.
Who is it recommended for?
Atera is mostly used by IT professionals to manage their workflow. It is ideal for MSPs, IT consultants, technicians and the professionals who work remotely. This tool has good help desk functionalities, billing, and robust reporting tools. Overall, it provides a holistic approach to handle complex tasks and enhances productivity.
Pros:
- Scalable Pricing Model: Atera's per-technician structure grants cost efficiency to the MSPs and IT businesses since the monthly fee covers unlimited device monitoring and management without additional per-device charges.
- Comprehensive Toolset: Atera converges many essential tools in one place. These tools consist of network monitoring, patch management, reporting, ticketing, time tracking, and billing. The result is a unified platform that suits numerous IT management needs.
- User-Friendly Interface: Since user-friendliness was the priority, the design entails a logical structure,and a simple but aesthetically-pleasing display. Thanks to this, the learning curve is smoothed out for novice users and the overall productivity is boosted in the process.
- Strong Community and Support: Atera offers chat, e-mail, ticket, and a responsive customer success team support channels, as well as training, and webinars. Hence it lets users enjoy the platform to the full extent.
Cons:
- Limited Customization and Integration: However, Atera's inability to be customized to small workflow requirements and fewer third-party integrations can limit adaptability and can necessitate manual workarounds in cases where specific tool incorporations are needed.
You have the option of signing up for a flexible monthly membership or an annual subscription at a discounted rate. You will have three different licensing kinds from which to choose, and you will have the opportunity to test out Atera's full feature capabilities for FREE for thirty days.
7. Datadog
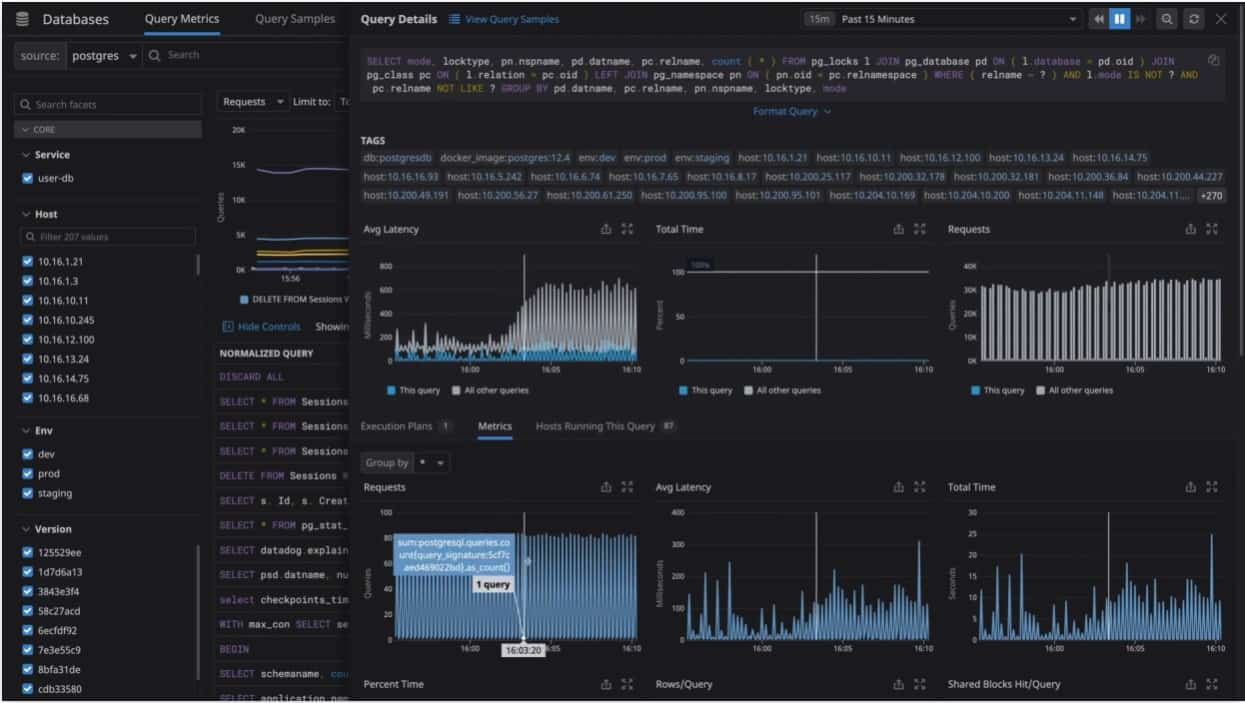
Datadog is responsible for monitoring how well network devices perform. The service is a cloud-based system that can investigate a network and identify all of the devices that are linked to the network. The information gleaned from this research will be used by the network monitor to compile an asset inventory and produce a topology map of the network. When this method is carried out, it indicates that the system will carry out its setup routines.
Key Features:
- Real-time Network Performance Monitoring: Datadog is best at monitoring network performance and traffic, even providing real-time data on bandwidth, throughput, and latency.
- Detailed Visualizations and Dashboards: The platform offers customizable dashboards with graphs, maps, and charts for detailed network data analysis, aiding in trend identification, anomaly detection, and in-depth metric examination.
- Automated Alerts and Anomaly Detection: uses advanced algorithms for real-time anomaly detection in network behavior, it quickly alerts users to prevent potential performance and security issues.
- Comprehensive Log and Event Management: Datadog will make your troubleshooting and integrating network monitoring with log management a lot easier. The best part is it gives a unified view to analyze and correlate network activities.
Why do we recommend it?
We recommend Datadog for network device monitoring because it provides full insight across on-premises, cloud, and hybrid environments while requiring low overhead. Datadog Network Performance Monitoring provides users with insight into all network components, including hosts, services, and VPCs.
Because the autodiscovery process is always running, it can detect any alterations that you may have made to your network and immediately bring both the inventory and the topology map up to the current. In addition to recognizing virtual systems, the service can extend the monitoring of links out to cloud resources.
The end-to-end visibility of all connections is provided by Datadog Network Monitoring. These connections are also connected with performance concerns that are indicated in log messages. The system's dashboard is hosted in the cloud and may be viewed using any browser that is considered the industry standard. This brings together information about the performance of the network from a wide variety of sources and encompasses the complete network, both link by link and end to end.
Datadog Network Performance Monitoring (NPM) employs a one-of-a-kind, tag-based tracking method to monitor the performance of on-premise and cloud-based networks. This method gives you the ability to segment network traffic between hosts, containers, services, or any other Datadog tag.
Who is it recommended for?
Datadog's network monitoring tool is helpful to IT professionals and network administrators because it gives precise information about network performance. They can monitor crucial data such as TCP retransmits, latency, and connection churn. Moreover, it proactively identifies and resolves network issues by monitoring traffic health between any two endpoints at many layers, such as app, IP address, port, or process ID (PID).
Pros:
- Scalable: Datadog is highly scalable, seamlessly expanding to monitor thousands of hosts and devices to meet the evolving network monitoring needs of growing organizations.
- Suitable for Beginners: Datadog simplifies network monitoring with an intuitive interface that eases use for newcomers and boosts efficiency for experts.
- Supports Multiple Integrations: Datadog's support for hundreds of integrations enables a comprehensive monitoring strategy, allowing organizations to unify IT stack data for holistic analysis.
Cons:
- Cost at Scale: It has affordable pricing for small to medium deployments, but if you are using this tool for large networks or want advanced features then it might charge operational expenses.
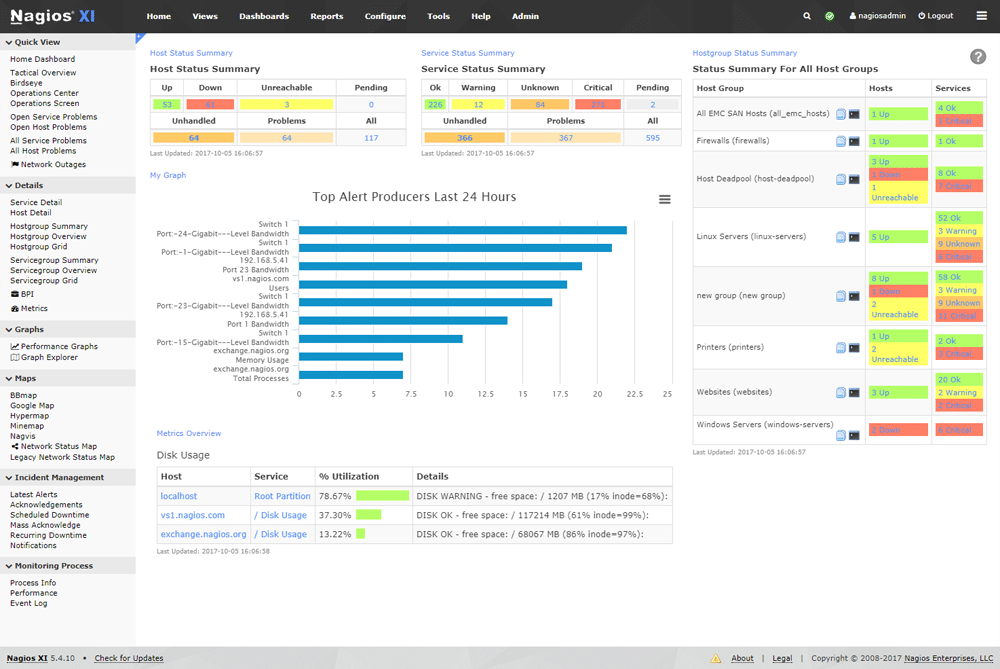
8. Nagios
Nagios is designed to serve a diverse group of users, ranging from sole proprietors and SMBs (small to medium businesses) to huge enterprises. Because of this, the price plan for Nagios is considered to be one of the most flexible. They provide a free version, an open-source alternative, a one-time license option, and a subscription service. It is one of the few tools that, despite its modest price, enables an extremely flexible monitoring and alerting system (thanks to its adaptability to plug-ins), making it one of the few tools of its kind.
Key Features:
- Extensive Monitoring Capabilities: Nagios provides extensive monitoring across network services (SMTP, HTTP, SNMP), host resources (processor load, disk usage), and server components like switches, routers, and environmental sensors.
- Customizable Alerting System: It features a highly configurable alerting system that notifies users of issues and recovery information via email, SMS, or custom scripts hence admins can always stay informed of the status of their IT environment.
- Advanced Visualization Options: You can easily understand reports and network maps because Nagios offers advanced visualization through customizable dashboards..
- Extensible Through Plugins: Offers unparalleled flexibility to have customized monitoring through an extensive system of community-contributed and custom plugins for any service.
Why do we recommend it?
Nagios is well-known for its proactive problem detection and response capabilities, which helps prevent disruptions to end users and customers. It helps to anticipate infrastructure changes, and reduce network failure due to old systems. This tool is best at responding quickly and can help improve your overall productivity and customer happiness by offering stable network service.
Monitoring is the primary function of Nagios. Network, Infrastructure, and Database are some of the most important aspects of an IT system that are monitored by Nagios. The software is simple to install, but it will take some effort to configure it to meet your specific needs when you first start using it.
It provides solutions such as Network Traffic Monitoring Software, Network Analyzer, and Network Monitoring Software respectively. A comprehensive dashboard, complex visualizations, bespoke application monitoring, automated alarms, specialized views, and advanced user management are some of the features that come standard with the Nagios Network Analyzer software.
Who is it recommended for?
Experts in the DevOps culture who need to continuously monitor services, business processes, and system applications find the Nagios useful tool . It runs plugins to monitor hosts or servers on the network or online on a regular basis, acting as a server daemon or service. Nagios is suitable for DevOps specialists who require proactive monitoring to uphold system availability and dependability, enabling effective infrastructure management and reducing downtime.
Pros:
- Flexibility and Customizability: Thanks to its plugin architecture, Nagios can be adapted to virtually any monitoring scenario, making it an extremely versatile tool for a wide range of network sizes and types.
- Robust Community Support: Being one of the most popular open-source monitoring tools, Nagios benefits from a large, active community. This community contributes to plugins, offers advice, and provides support through forums and documentation.
- Cost-Effectiveness: The core version of Nagios, Nagios Core, is free and open-source, which makes it an attractive option for organizations looking to implement a comprehensive monitoring solution without incurring licensing costs.
- Proven Reliability: Over the years, Nagios has proven to be a reliable solution for monitoring IT infrastructure. It’s used by thousands of organizations worldwide, from small businesses to large enterprises.
Cons:
- Complex Configuration: Configuration can be time-consuming; Nagios' complexity and time-consuming configuration present a steep learning curve, especially for beginners or those managing large, dynamic environments.
Top Choice
Out of all, our first choice is the Auvik. The application will keep you apprised of any developing issues by notifying you of them via email and text message.

