
Our funding comes from our readers, and we may earn a commission if you make a purchase through the links on our website.
The Best Database Monitoring Tools
UPDATED: August 28, 2023
Managing, optimizing, and securing your databases can sometimes seem like an uphill battle, especially when you’re doing a lot of administrative work manually. A single dropped table, spike in traffic, or ransomware attack could completely cripple a database server, and ultimately the entire business.
In this article, we’ll be reviewing some of the best database tools available that help sysadmins manage their workloads more efficiently, and work smarter, not necessarily harder.
Here’s our list of the best database tools & software:
- SolarWinds Database Performance Analyzer for SQL Server – EDITOR’S CHOICE Best choice holistic database management for any sized network.
- SolarWinds AppOptics APM – FREE TRIAL Designed for deep-dive analysis and troubleshooting on the development level.
- SentryOne SQL Sentry – FREE TRIAL Offers flexible subscription and annual pricing along with bulk licensing and non-profit discounts.
- ManageEngine Applications Manager – FREE TRIAL This software package is a performance tracker for applications and includes database monitoring. Runs on Windows Server, Linux, AWS, and Azure.
- Site24x7 Server Monitoring – FREE TRIAL Monitors databases, networks, and in a fracture in a single platform.
- Paessler PRTG Network Monitor – FREE TRIAL Great database monitoring option for companies looking to expand their overall monitoring capabilities.
- Datadog Database Monitoring Blend ease of use with detailed database insights.
- SQL Power Tools Focuses solely on SQL monitoring and offers improved features from over the years.
- Red-Gate SQL Monitor Simple browser-based monitor with auto-refresh dashboards that are accessible from anywhere.
- dbWatch Database Control Doubles down and focuses completely on managing multiple databases and SQL Server environments.
The Best Database Tools & Software
1. SolarWinds Database Performance Analyzer – FREE TRIAL
SolarWinds Database Performance Analyzer works as both a proactive and reactive database troubleshooting tool for SQL Server environments. The platform combines powerful root cause analysis and troubleshooting tools with simplified health reports that aid DBAs by pre prioritizing tasks based on their risk to the database.
Key features:
- Scalable features
- Database and hardware monitoring
- Simplified database health reports
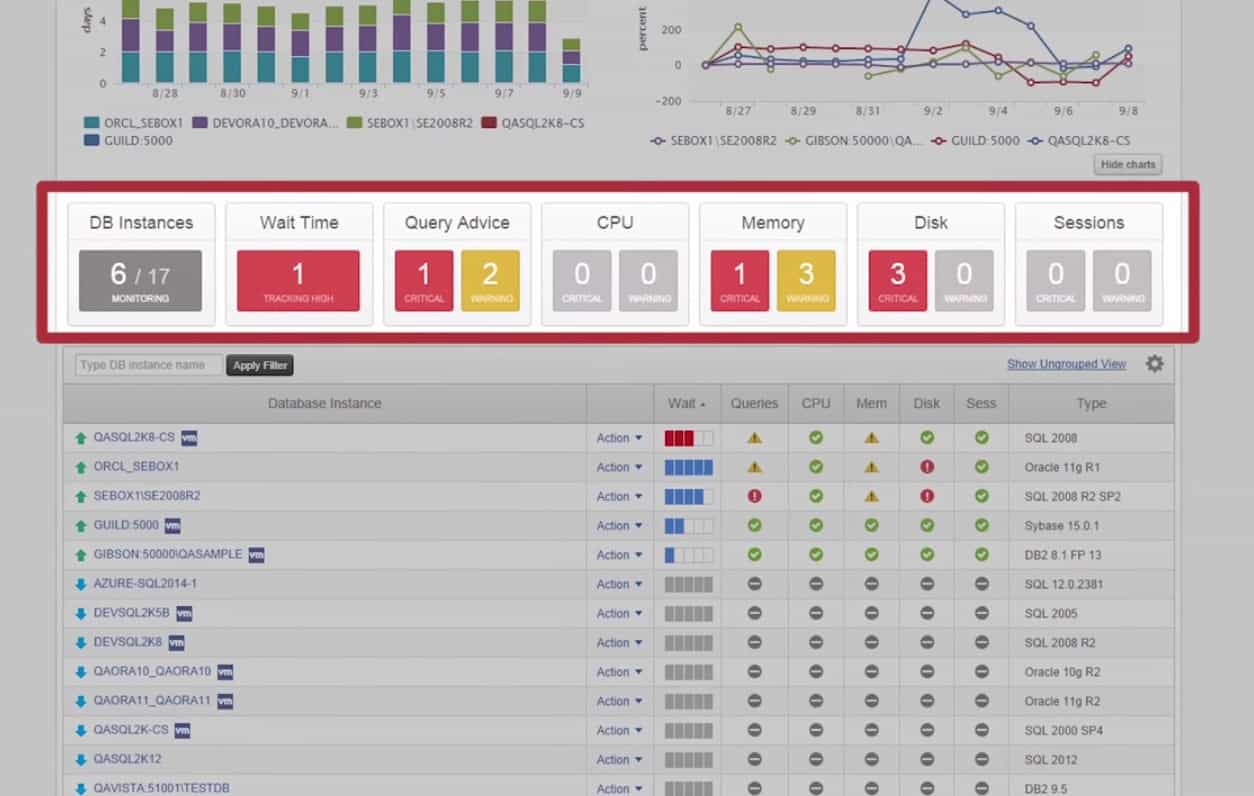
The customizable dashboard helps highlight events such as wait time, query status, and server hardware utilization like CPU cycles, available memory, and disk usage. If problems are detected, an easy-to-see yellow and red status will be displayed and alert support teams at a glance that a problem has been identified.
Specialized alerting can also be configured to send emails, or third-party app alerts to designated recipients when certain events take place, or thresholds are broken. A robust backend API makes integrating these alerts into popular ticketing platforms relatively easy.
SolarWinds Database Performance Analyzer works across a myriad of environments such as DB2, MySQL, Aurora, SQL Server, as well as with cloud or hybrid-cloud environments. The software can be installed on Windows or Linux and set up in the cloud via AWS Launch or Azure Marketplace.
The features inside the platform are truly designed with simplifying the day-to-day tasks DBAs have to attend to, while also having enough monitoring capabilities to scale as the database or company expands.
Pros:
- Highly intuitive DB management system tailored for medium to large size database implementations
- Monitors in real-time, offering a number of alert and notification options that can integrate into popular helpdesk solutions
- Threshold monitoring helps keep teams proactive, and fix issues before they impact performance
- Dashboards are highly customizable and can be tailored to individuals or teams
- Built-in query analysis helps DBAs build more efficient queries
- Leverages machine learning to identify performance bottlenecks
Cons:
- Could use a longer trial period
Currently, pricing for SolarWinds Database Performance Analyzer starts at $1995 (£1563) and is available for testing through a free 14-day trial.
Related Post: Best Network Troubleshooting Tools
2. SolarWinds AppOptics APM – FREE TRIAL
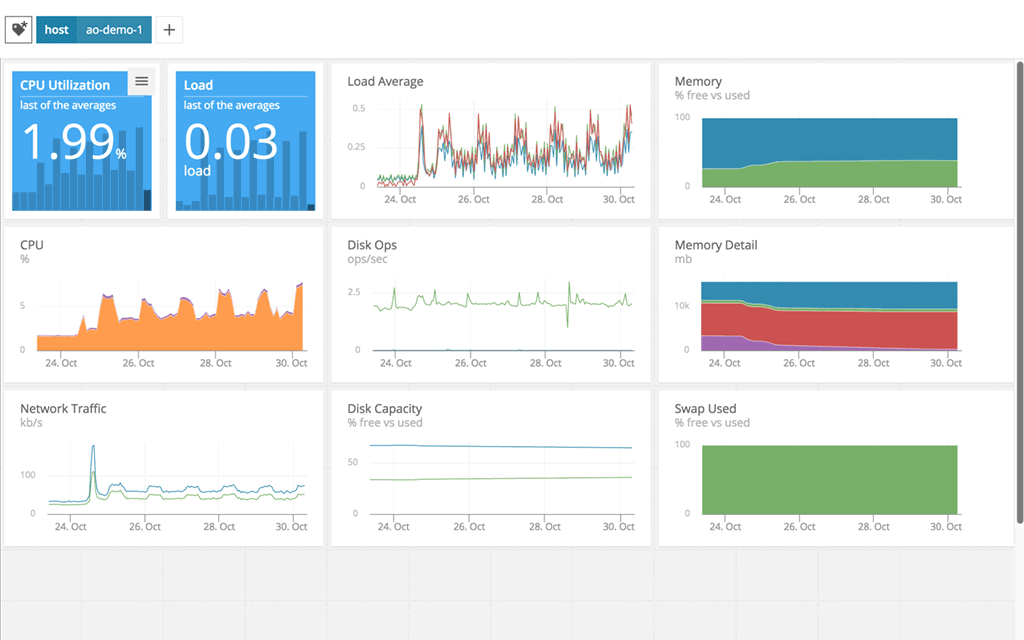
SolarWinds AppOptics APM is a cloud-based application performance monitor that offers a deep look into both infrastructure and database health metrics. The SolarWinds tool integrates with dozens of different tools and supports database environments such as MySQL, Apache DBMS, PostgreSQL, MSSQL, and Oracle.
Key features:
- Simple pricing structure
- Able to monitor multiple environments
- Database correlation and comparison features
While some database tools only give a top-level look at performance, AppOptics was designed to serve DBAs and developers who need to deep dive into traces and queries for in-depth analysis. A simple comparison tool allows admins to see changes across tables over time, and easily spot differences between historical records, and duplicated environment testing environments.
Like many of our top tool choices, AppOptics isn’t just restricted to monitoring databases, the tool can be used to monitor hybrid clouds, virtual servers, and even applications on barebones servers.
Pros:
- Offers great visualizations reflecting live and historical health metrics and resource consumption
- Is easily scalable cloud service
- Tracks all major resources focusing on over 180 different metrics
- Can monitor Docker, Azure, and Hyper-V platforms, offering more flexibility than competing options
Cons:
- Would like to see a longer trial period
Pricing for SolarWinds AppOptics APM is divided into two tiers, Infrastructure Monitoring, and Infrastructure + Application Monitoring. In order to truly benefit from all the troubleshooting and full-stack features, you’ll need to purchase the second tier which starts at $24.99. You can test out SolarWinds AppOptics completely free with a 30-day free trial.
3. SentryOne SQL Sentry – FREE TRIAL
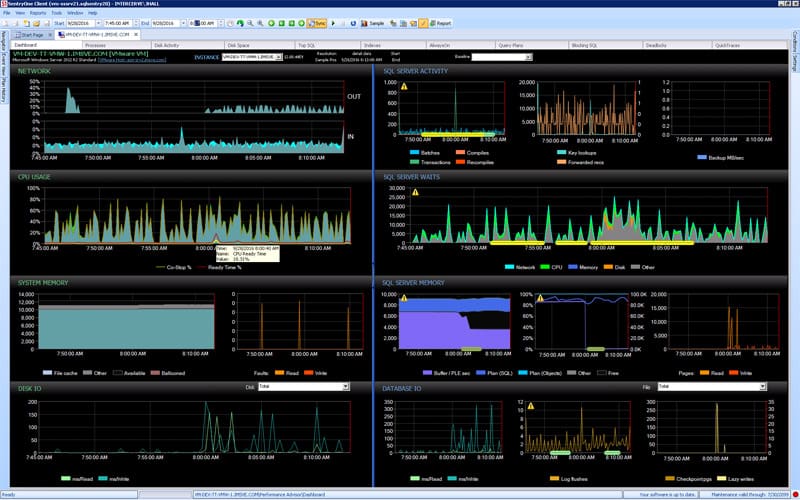
SentryOne SQL Sentry offers a simple way to monitor your database environment that incorporates live database metrics into a classic-looking dashboard that will take you to the mid-2000s. But don’t let the outdated GUI fool you, SentryOne still has some serious power under the hood that can help keep your databases healthy, and your mind worry-free.
Key features:
- Subscription and annual license option
- Cloud and on-premises support
- Volume and non-profit discounts
There are some advanced tools that go beyond just database management, like automated index fragmentation that reviews live and historical data before making recommendations or creating alerts. Alerting can also be customized and configured to your liking but comes with over 100 different alerting conditions that are ready to go out of the box.
Smaller organizations can choose to send these alerts to a sysadmins’ email, while enterprises can use the API to port alerts over to a ticketing system to automatically add critical events to the NOC queue. Sentry One doubles down on its core offering and can focus on providing exceptional SQL and database monitoring, making it great for networks that are only missing visibility into their databases.
Pros:
- Dedicated to monitoring specifically only SQL, good for companies that already have other app monitoring tools they’re happy with
- 100+ alerts and templates customized around SQL server health monitoring
- Supports root cause analysis for faster resolution times
Cons:
- Pricing is on the higher end
- Isn’t a holistic application/infrastructure monitor
Pricing is flexible and is currently offered as either a license or subscription model. The subscription version can be purchased for $1500 per year for SQL Sentry Premium and $325 per year for the Azure SQL Database version.
Special volume and non-profit discounts are available. You can trial the full version of SentryOne SQL Sentry completely free for 14 days.
4. ManageEngine Applications Manager – FREE TRIAL
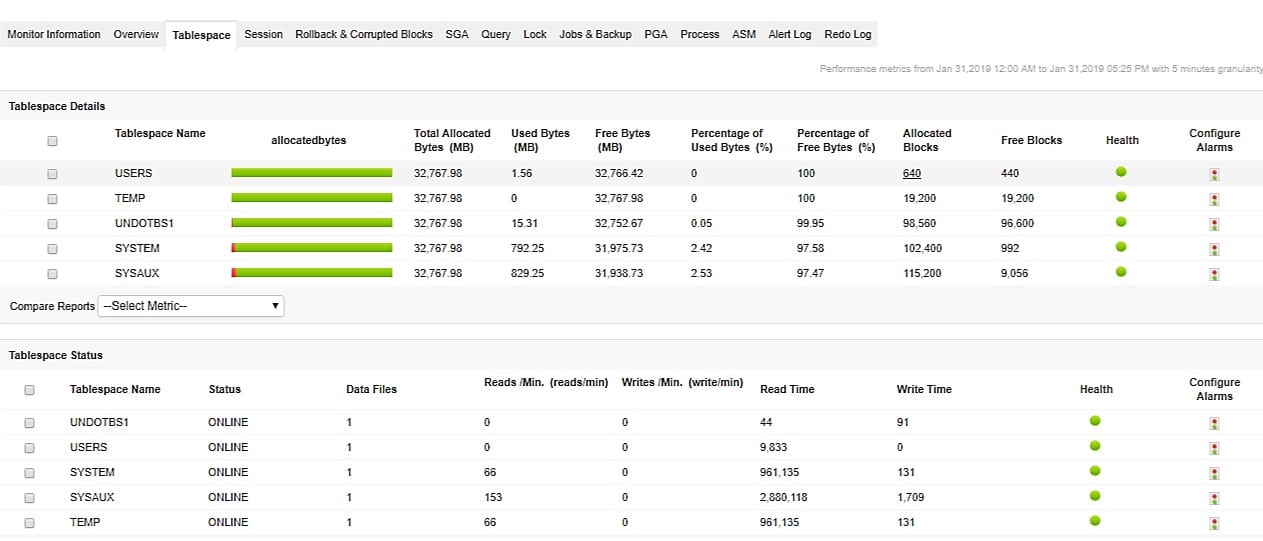
ManageEngine Applications Manager discovers software, middleware, and services, and maps them. The list of application types that this system can monitor includes databases. The tool will identify which applications access database instances and how. It also identifies the server resources that support those databases. So, it places database monitoring in context.
Key features:
- Live activity tracking
- Capacity planning
- Query analysis
The relational databases that this system can monitor are SQL Server, MySQL, Oracle, and PostgreSQL relational databases. It is able to monitor NoSQL systems, such as Cassandra, Couchbase, and MongoDB, big data packages, and key-value stores, such as Redis.
This system creates an application dependency map, which tracks all of your applications and watches how they interact. This service is important because it is able to chain forward when an individual application starts up and predict which resources it will need. So, if too many applications that require database access all run at once, you will experience performance problems. The service is able to generate predictive alerts for this scenario and also for potential overloading of server resources.
The system will track all of your database system and aggregate performance data in an overview. Drill down to see the details of each instance. The examination of activity spots slow-running queries and identifies the cause. This could be resolved by rewriting queries, redesigning tables, or increasing database memory allocation. The Applications Manager gives you advice on which path to take.
Pros:
- Performance tracking for relational databases, NoSQL databases, big data systems, and key-value stores
- Predictive alerts
- Examines databases on Windows Server and Linux
- Tracks database activity on AWS, Azure, and Oracle Cloud
- Capacity planning support
Cons:
- Not a SaaS package
ManageEngine offers a Free edition of Applications Manager. This is limited to monitoring five assets. However, it includes the capability to monitor databases. The paid system is available in two editions. These are Professional, for a single site, and Enterprise for multiple sites. The Professional edition is sized and priced to be suitable for use by small businesses. Its starting price is $395 per year. Larger businesses can pay for extra capacity. The Enterprise edition is built for very large multi-site businesses and its price starts at $9,595 per year.
The software for Applications Manager runs on Windows Server or Linux. It is also available as a service on the AWS Marketplace and the Azure Marketplace. You can assess the system and its database monitoring capabilities with a 30-day free trial.
5. Site24x7 SQL Server Monitoring – FREE TRIAL
Site24x7 features a combination of network, application, and server monitoring all in one package, making it great for monitoring both database health and the health of its environment. The platform is a lightweight SaaS tool that lives in the cloud, so there’s no need for complicated integrations or long-drawn-out on-boarding.
Key features:
- Flexible pricing
- Server, network, and application monitoring
- Cloud-based monitoring
The cloud nature of the tool makes it a great fit for organizations that have multiple database environments across different platforms or have clients they manage in an MSP-type relationship. Performance is displayed live in real-time and is accessible anywhere an internet connection is available.
The platform can measure and monitor multiple conditions and thresholds while aiding in coordinating the performance between live and development databases. Outside of top-level analytics, the tool hosts a number of troubleshooting features that allow admins to quickly drill down to the table and query level to see exactly where the bottleneck exists.
Pros:
- Flexible cloud-based monitoring option
- Offers a host of out-of-box monitoring options and dashboard templates for SQL server
- Allows administrators to view dependencies within the application stack, good for building SLAs and optimizing uptime
- Offers root cause analysis enhanced by AI to fix technical issues faster
- Can unify SQL monitoring across multi-cloud environments
Cons:
- Site24x7 is a feature-rich platform with options that extended beyond databases management, may require time to learn all options and features
Pricing for Site27x7 is flexible and done through a subscription model that offers simple tiered plans with optional add-ons that help the service scale with your database monitoring needs. The platform has a completely free version that limits to five services or servers which helps smaller teams get familiar with the tool before purchasing.
You can test-drive Site24x7 Database Monitoring with a 30-day free trial.
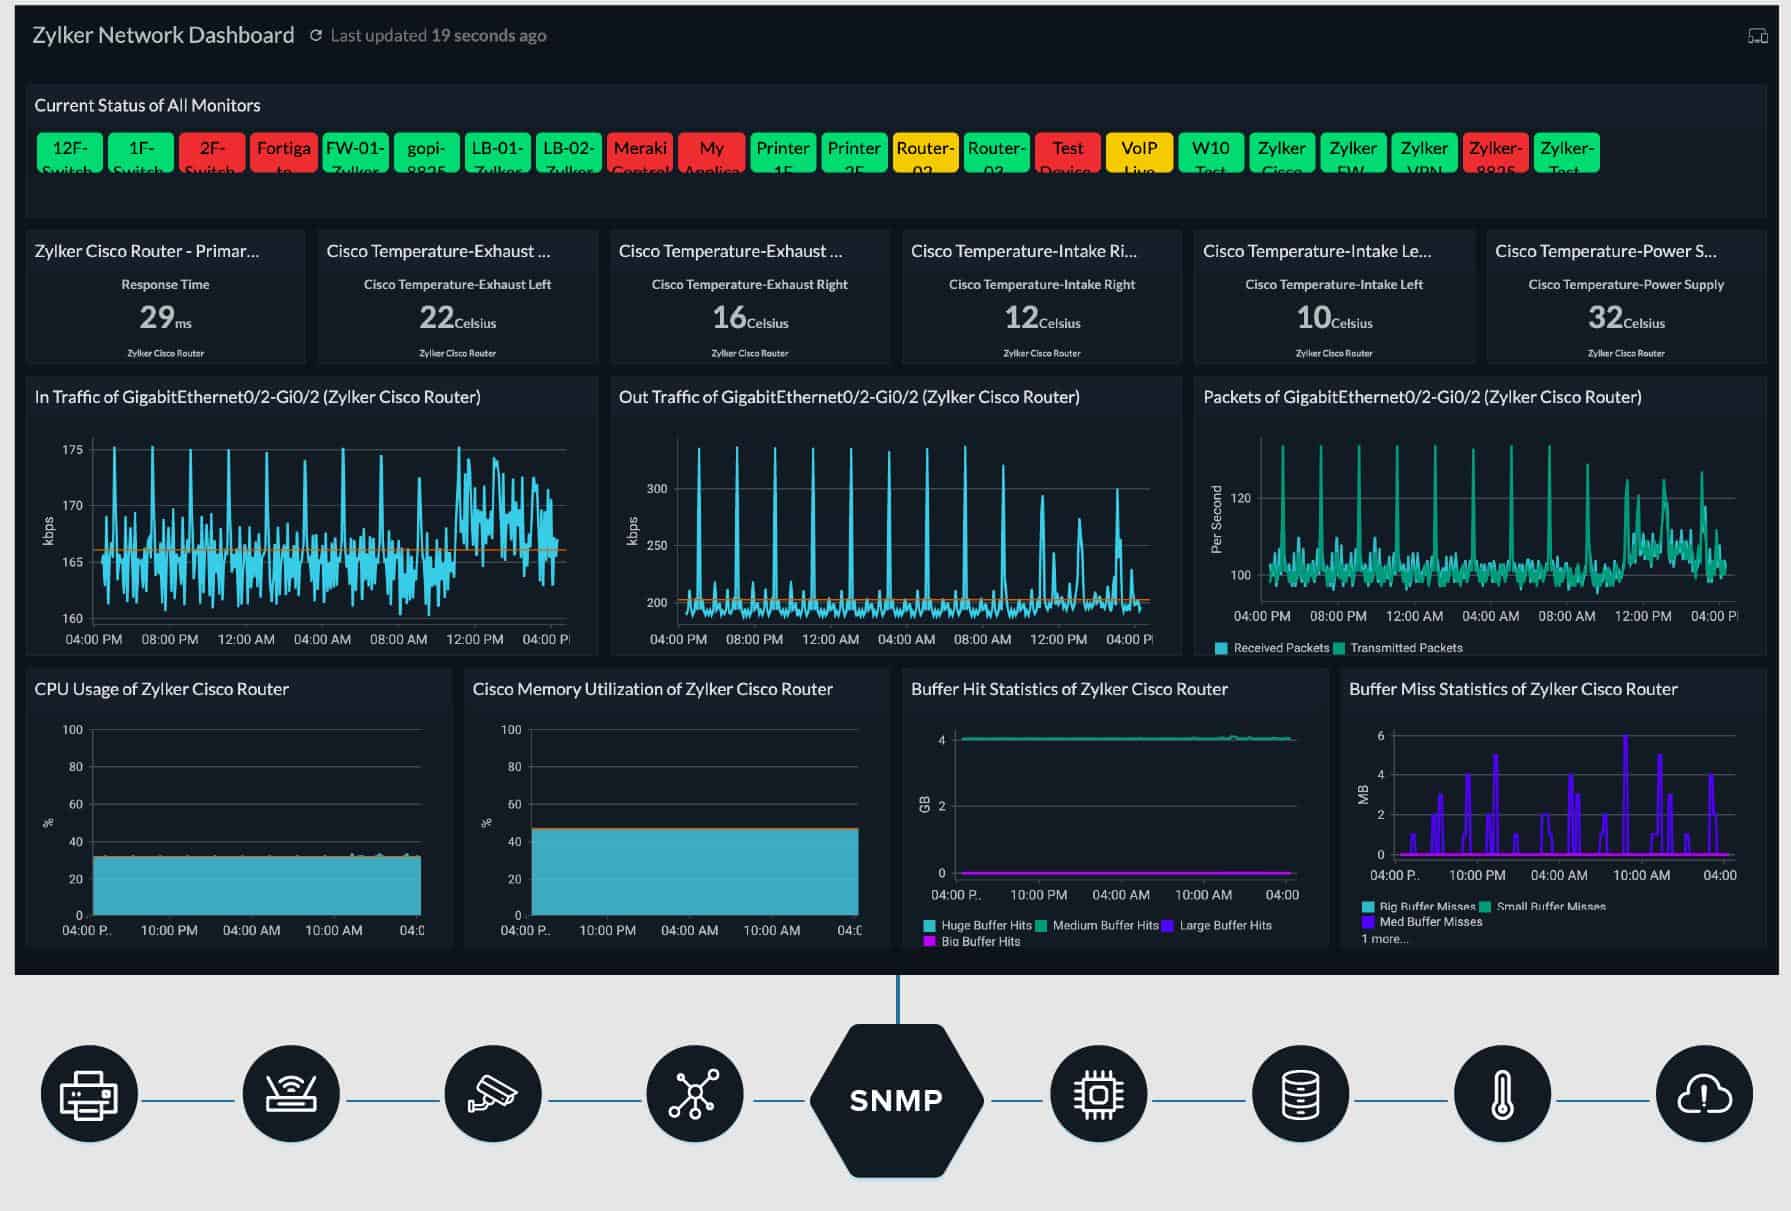
6. Paessler PRTG Network Monitor – FREE TRIAL
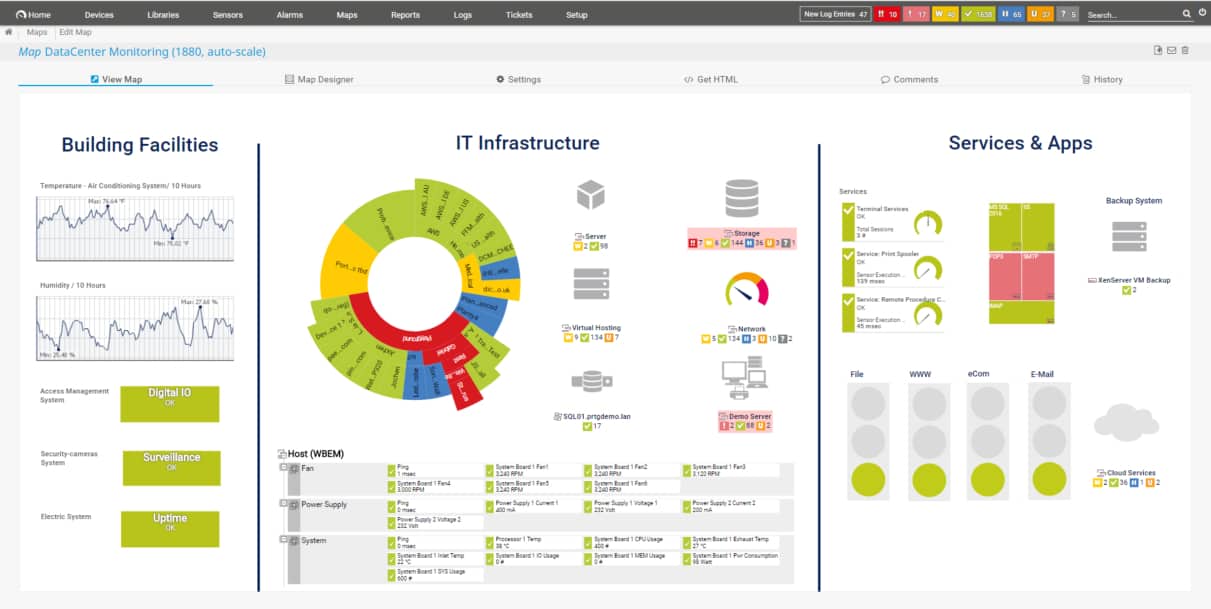
The Paessler PRTG platform is known for its ability to monitor the performance of virtually anything through a series of customizable sensors that collect environment-specific data based on their locations. PRTG covers nearly all SQL environments including PostgreSQL, MSSQL, MySQL, and Oracle.
Key features:
- Full network, infrastructure, and application monitoring suite
- Pay only for what you use
- Simple dashboard views
The configuration of the sensors is already done for you, allowing you to simply install them through an MSI file, or deploy them in your cloud environment. Metrics like execution time, wait times, top queries, and exception handles are all pulled down into your dashboard which automatically highlights some of the most popular metrics that are monitored in database environments.
PRTG’s dashboards are simple and clean, even when monitoring a large number of databases at the same time. This is due in part to the modular nature of the dashboard and how PRTG allows its users to create custom views for different looks at the data.
Organizations who might need additional monitoring needs outside of just database performance monitoring may want to examine PRTG’s offerings more closely, as its entire suite of sensors covers a lot of different technologies.
Pros:
- Uses a combination of packet sniffing, WMI, and SNMP to report network performance as well as discover new devices
- Autodiscovery reflects the latest inventory changes almost instantaneously
- Drag and drop editor makes it easy to build custom views and reports
- Supports a wide range of alert mediums such as SMS, email, and third-party integration
- Supports a freeware version
Cons:
- Is a very comprehensive platform with many features and moving parts that require time to learn
To get started, PRTG has a freeware version that limits you to 100 sensors. This is great for small testing labs or home setups. Each sensor is configured to monitor a particular metric, so expect to use one sensor for each metric your want to track.
On the paid end there are multiple tiers which include packaged bundles of sensors, starting with PRTG 500 which offers 500 sensors for $1600 (£1253). The pricing model is dynamic, meaning you don’t get charged for sensors you don’t actually use, which makes forecasting your database growth along with your budget a simple process that you can control.
You can test out all of the features PRTG offers through a 30-day free trial.
7. Datadog Database Monitoring
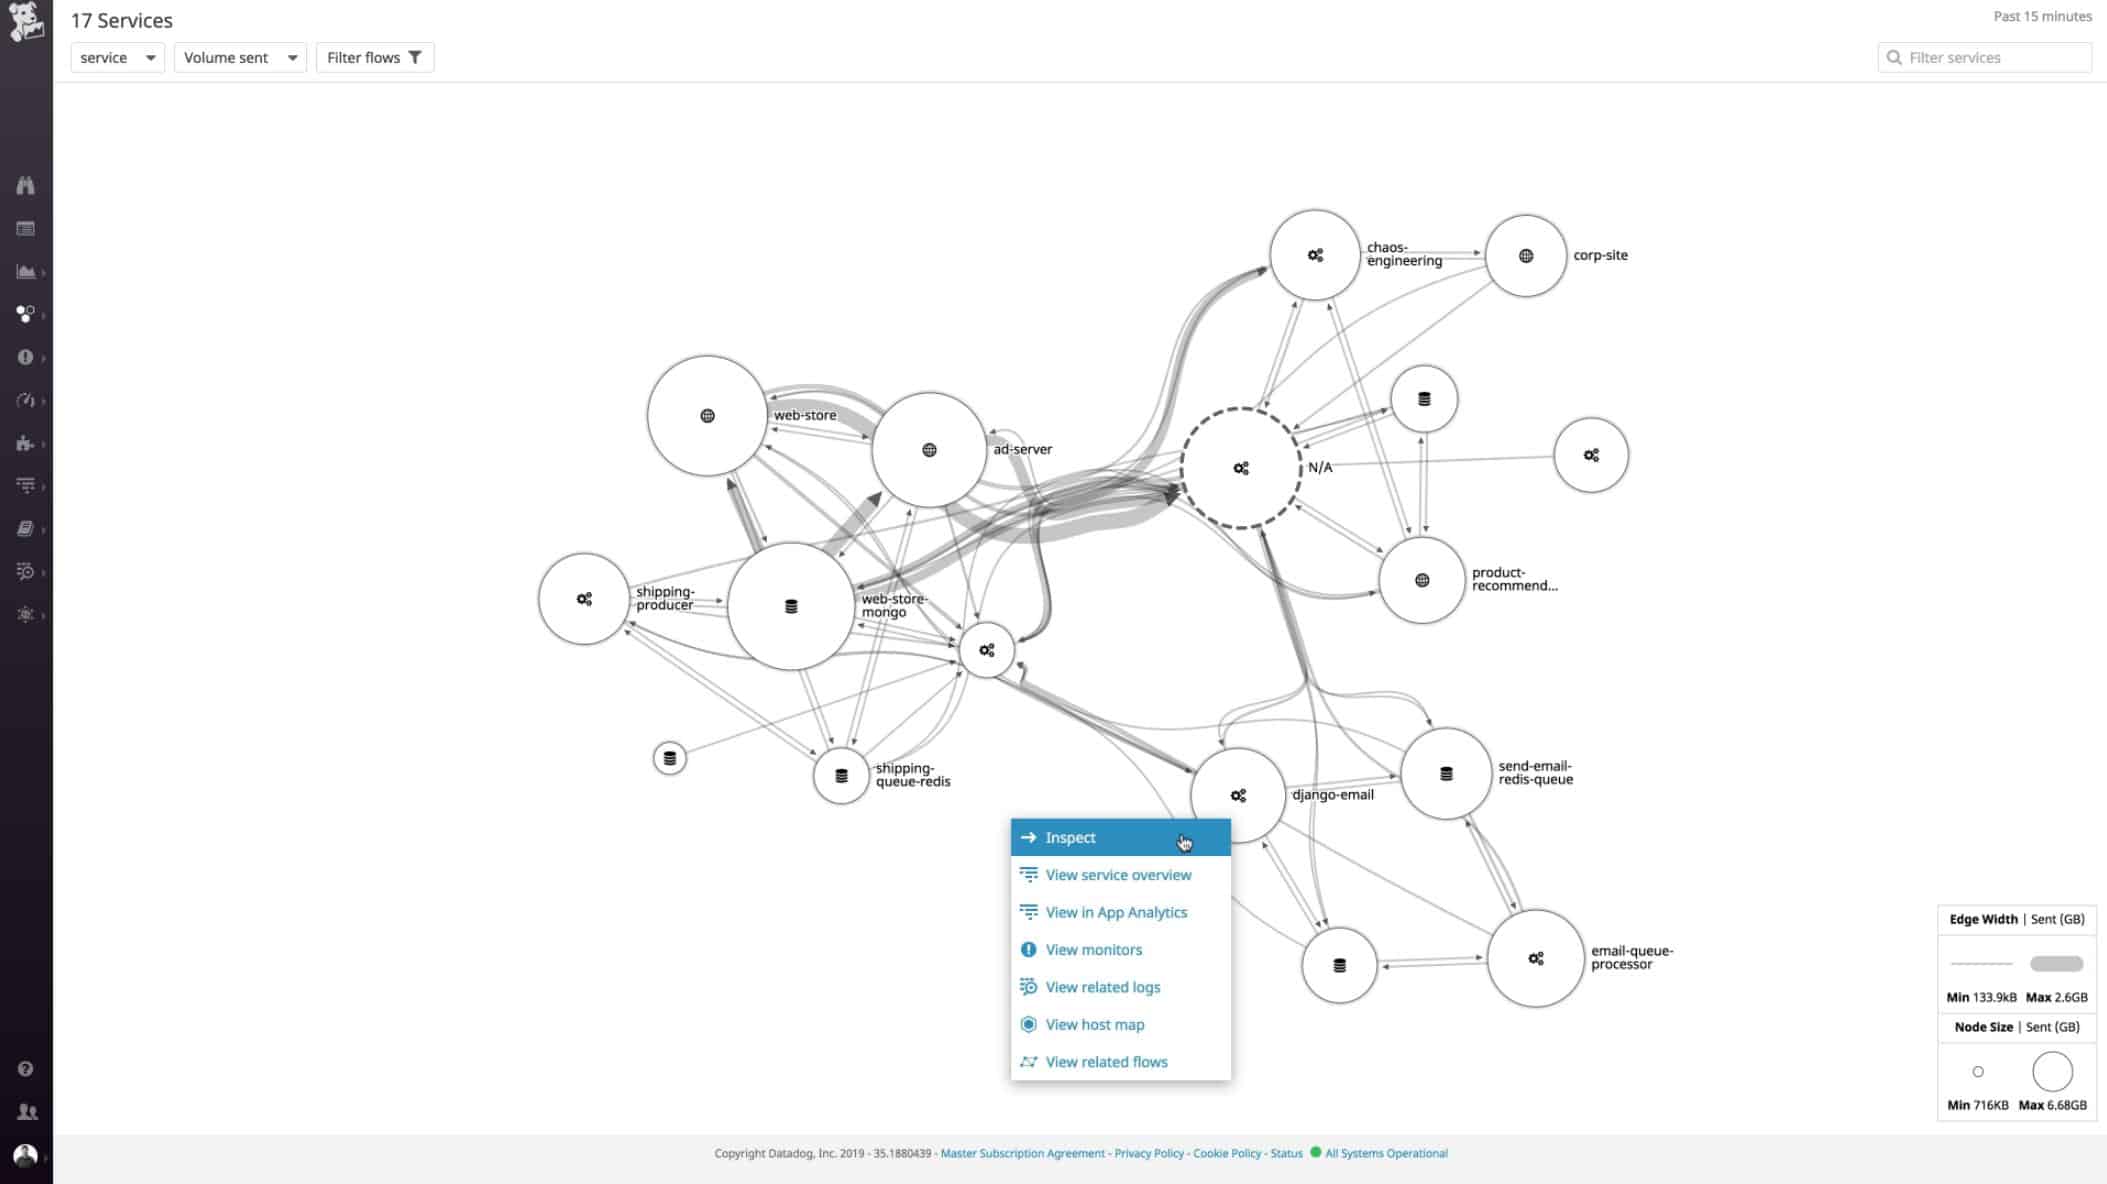
Datadog is a complete cloud-based monitoring suite that offers database performance monitoring insights combined with in-depth troubleshooting tools. The Datadog platform stands out by leveraging AI machine learning techniques that can help reduce alert fatigue, highlight baseline performance, and detect anomalous behavior across your SQL environment.
Key features:
- AI-powered root cause analysis
- 400 plus integrations
- Preconfigured metrics and alerting
Datadog has one of the best interfaces on the market which makes it incredibly easy to start interpreting valuable data right away. Dashboards contain preconfigured metric tracking, but also let you build out your own views on an individual or team level.
The platform supports a wide range of SQL environments like Redis, PostgreSQL, SQL Server, MySQL, and MongoDB. With 400 plus additional integrations, you can create connections to and from Datadog Database Monitoring to make your monitoring efforts cohesive across your organization.
Datadog strives to make as much of the data monitoring process as out-of-the-box as possible through preset alerts, dashboards, integrations, and monitor templates. All preset elements can be completely customized which never makes you feel like you’re trapped in a rigid product.
A series of troubleshooting and analysis tools help you find the root cause of database problems quickly, and are paired with vivid graphical representations of the server, and database structure that makes it easy to see data dependencies, and granular problems even when scaled across an enterprise-level environment.
Pros:
- Has an excellent interface, easy to use, and highly customizable
- Cloud-based SaaS product allows monitoring with no server deployments or onboarding costs
- Can monitor both internally and externally giving network admins a holistic view of network performance and accessibility
- Supports auto-discovery that builds network topology maps on the fly
- Changes made to the network are reflected in near real-time
- Allows businesses to scale their monitoring efforts reliably through flexible pricing options
Cons:
- The trial could be longer
You can test out the full version of Datadog Database Monitoring completely free with a 14-day trial.
8. SQL Power Tools
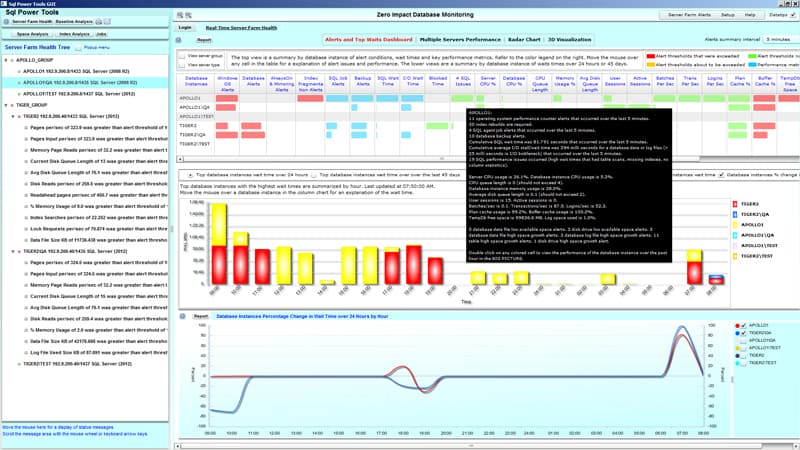
Seasoned DBAs might recognize SQL Power Tools, as it was once at the top of its class for SQL monitoring. While there are other larger platforms that include a more holistic approach to APM, SQL Power Tools is still an incredibly useful tool that cannot be ignored.
Key features:
- Database monitoring plus security tools
- Single focus tool
- Advanced Behavior Analysis
SQL Power Tools uses a classic design to display database metrics such as response time, top queries, hung queries, and server resource usage all in a single pane that is fed with live data. Over the years new features have made SQL Power Tools more intuitive and helpful for busy database administrators. Advanced Behavior Analysis can help identify rogue queries, SQL injection attempts, and other acts that could point to an internal or external threat.
The entire system is lightweight and focuses solely on SQL environments, which makes it unique from the other tools which strive to ‘do all the things.’ If you’re looking to keep it simple and only use a single tool for SQL monitoring, SQL Power Tools offers its classic features with a few additional modern twists.
Pros:
- Was specifically built to be as lightweight as possible, allowing it to manage a large number of SQL servers with little resource consumption
- Offers built-in security auditing and monitoring that leverages behavioral analytics to stop SQL attacks
- Clean user interface takes little time to learn
Cons:
- Doesn’t support other applications beyond SQL
- Must contact sales for pricing
Databases like Oracle, MariaDB, SQL Server, Sybase, and Informix are all supported along with virtual, on-premises, and cloud environments as well. Currently, pricing is not publicly available, however, you can trial the platform with a 21-day trial.
9. Red-Gate SQL Monitor
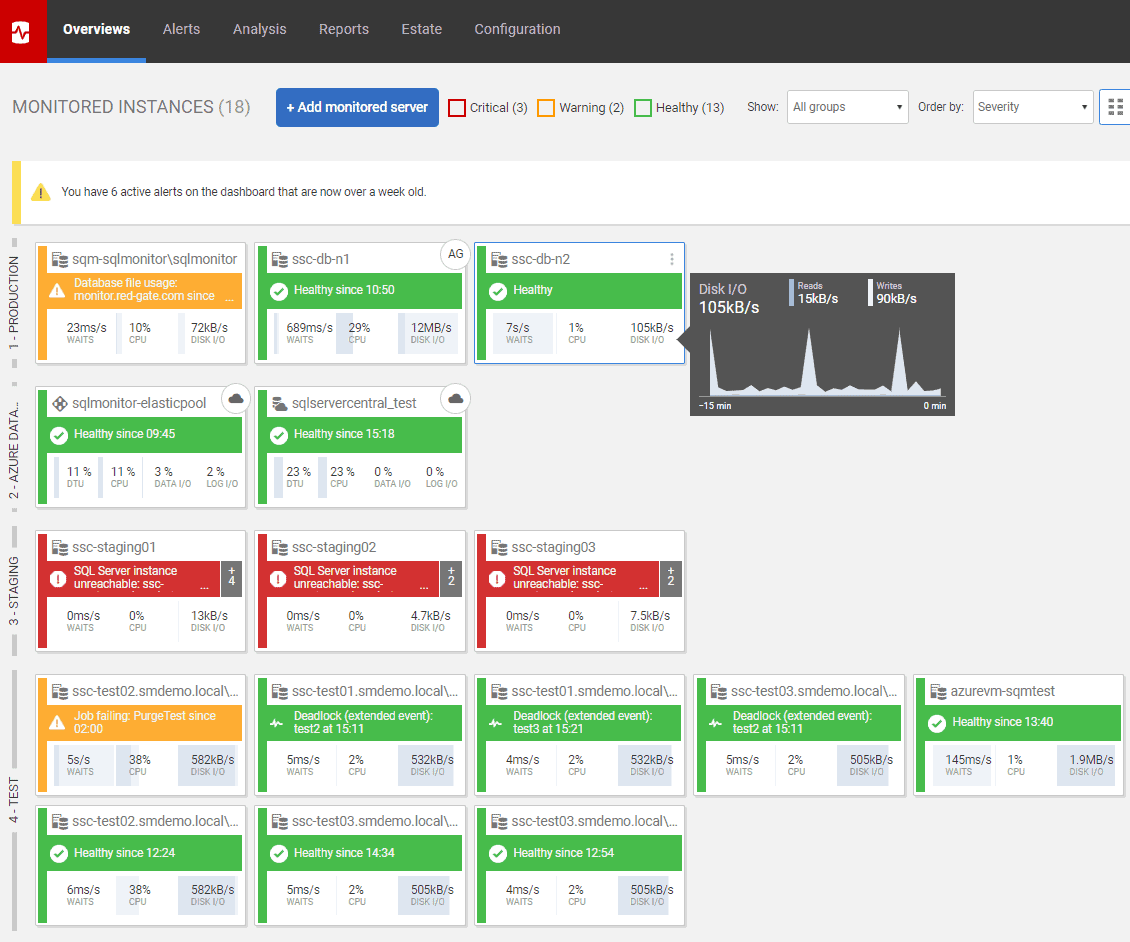
Red-Gate is another SQL Monitor which doubles down on monitoring databases and stays in its own lane as a dedicated SQL monitoring tool. You can monitor multiple databases or SQL servers with a simple home screen that can be accessed via any browser for monitoring wherever you go.
Key features:
- Browser-based monitoring
- Auto-screen refresh
- Preconfigured metrics and dashboard
The alerts and monitoring features provide a view that almost resembles a Trello board, making it really easy to see which items need to be tended to through a green, yellow, and red color-coded system. The online dashboard automatically refreshes making it really easy to throw on an additional monitor, or large display for your NOC team to stay in the loop throughout the day.
There are over 40 different customizable alert templates you can deploy that cover database health as well as server resource metrics that can also impact the database. These all come standard and can be activated in just a few clicks, making Red-Gate a great database monitor tool that doesn’t take an entire afternoon to get set up.
Pros:
- Scalable interface, can manage multiple databases without clutter
- Best suited for multi SQL server environments
- Offers pre-configured alerts and templates specifically for SQL DBAs
Cons:
- The trial is only 14 days, could be longer
Pricing is tied to the number of servers you wish to monitor and also comes in bundles that can include multiple servers. The platform can also be purchased on a per-server basis starting at $1645 (£1200) per server that includes a single year of support and upgrades. You can start with a free trial.
10. dbWatch Database Control
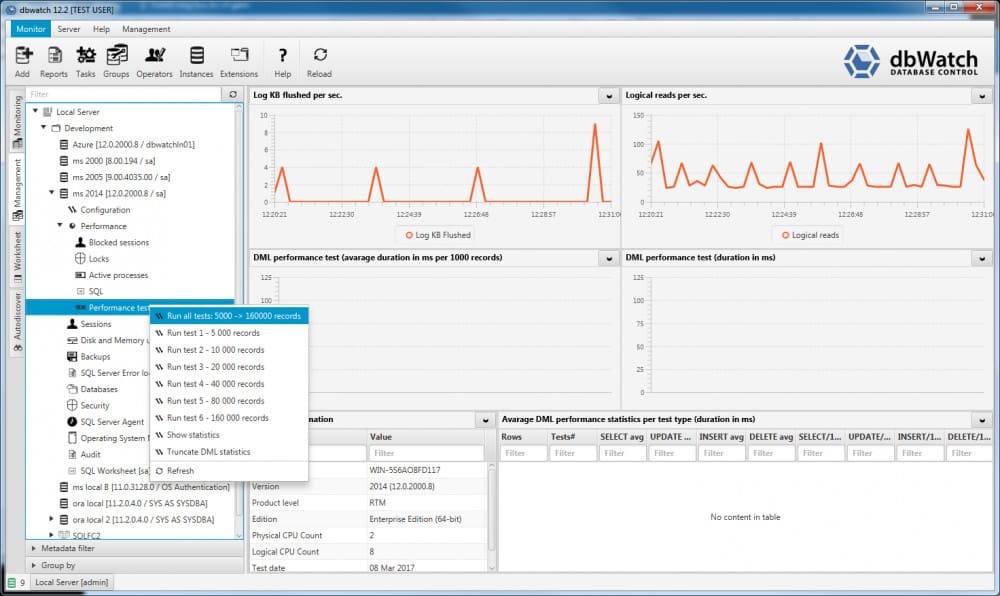
The dbWatch Database Control tool is specifically designed for monitoring databases across multiple environments. Unlike some of our other database tools, dbWatch Database Control doesn’t offer network-wide monitoring but instead focuses simply on database management.
Key features:
- Dedicated database monitoring
- Multi operating system support
- Cluster management
This makes dbWatch a solid choice if you already have the infrastructure and network monitoring in place but are looking for a tool that is hyperfocused on providing database monitoring. This includes cloud and on-site servers as well as support for Sybase, SQL Server, MySQL, MariaDB, and PostgreSQL.
The tool gives a solid look into both the live and historical health of your database, allowing you to pair dbWatch as a part of your database backup routine. For audits and comparisons, historical data reporting can be used to compare data, or help comply in an investigation.
Pros:
- Supports multiple database types including cloud-based databases like Azure SQL
- Good option for businesses that have a large number of SQL servers in operation
- Can proactively alert based on set thresholds
- Available cross platform on Windows, Linux, and Mac
Cons:
- Specializes only in SQL server monitoring
- Minimum license requirement of 10, not for small businesses
Pricing for dbWatch Database Control is broken down into three tiers, dbWatch Essentials, dbWatch Pro, and dbWatch Enterprise. The first tier includes a majority of the monitoring tools you’ll need for the most basic forms of health monitoring. The Pro plan introduces advanced troubleshooting features, and database maintenance automation. Finally, the Enterprise plan includes autodiscovery features and database cluster management tools for larger networks.
The tool runs on Windows, Linux, and macOS operating systems, and comes with a 30-day free trial to test out for yourself.
Choosing the right Database Tool
For almost any sized organization SolarWinds Database Performance Analyzer will provide the best experience, providing out-of-the-box features that allow organizations both big and small to optimize and monetize their database environment efficiently as possible.
Do you monitor your databases? If so, what tools do you have experience using? Let us know in the comments below.

