
Our funding comes from our readers, and we may earn a commission if you make a purchase through the links on our website.
Best Cloud Monitoring Tools
UPDATED: June 14, 2023
The cloud has empowered businesses to scale and grow like never before. But with this rise in cloud services, a new problem has emerged: Monitoring your cloud infrastructure. Cloud monitoring tools enable you to monitor multiple cloud and hybrid environments from a single dashboard.
In this article, we’ll take a look at the very best cloud monitoring tools. Let’s get started.
Here is our list of the best cloud monitoring tools:
- AppOptics – FREE TRIAL Full-stack advanced troubleshooting tool aimed at developers looking to optimize and monitor their cloud environments. Start a 30-day free trial.
- Pingdom – FREE TRIAL Tailored to monitoring website hosts, services, and applications. Register and begin with a 30-day free trial.
- SolarWinds Server & Application Monitor – FREE TRIAL Offers a mix of cloud and on-site monitoring, making it a great fit for cloud and on-premises environments. Get a 30-day free trial.
- ManageEngine Applications Manager – FREE TRIAL This package of application performance monitoring systems also tracks the performance of servers and cloud platforms. Runs on Windows Server, Linux, AWS, and Azure. Start a 30-day free trial.
- Site24x7 – FREE TRIAL Offers powerful multi-cloud monitoring with a simple pricing structure and simple account add-ons.
- Paessler PRTG – FREE TRIAL Specialized sensors allow for multi-cloud visibility and custom sensors to be built.
- Datadog Cloud Monitoring Provides the best balance between ease of use, powerful insights, and competitive pricing
- ppDynamics APM Provides intelligence reporting and AI-assisted metrics that blend performance metrics with business outcomes.
The best Cloud Monitoring Tools
1. SolarWinds AppOptics – FREE TRIAL
AppOptics by SolarWinds is an application performance monitoring tool that has cloud and multi-cloud monitoring capabilities. The entire platform is designed to monitor your applications and services no matter where they are located.
Key features:
- On-premises and multi-cloud monitoring
- Trace level troubleshooting tools
- Smart alerting
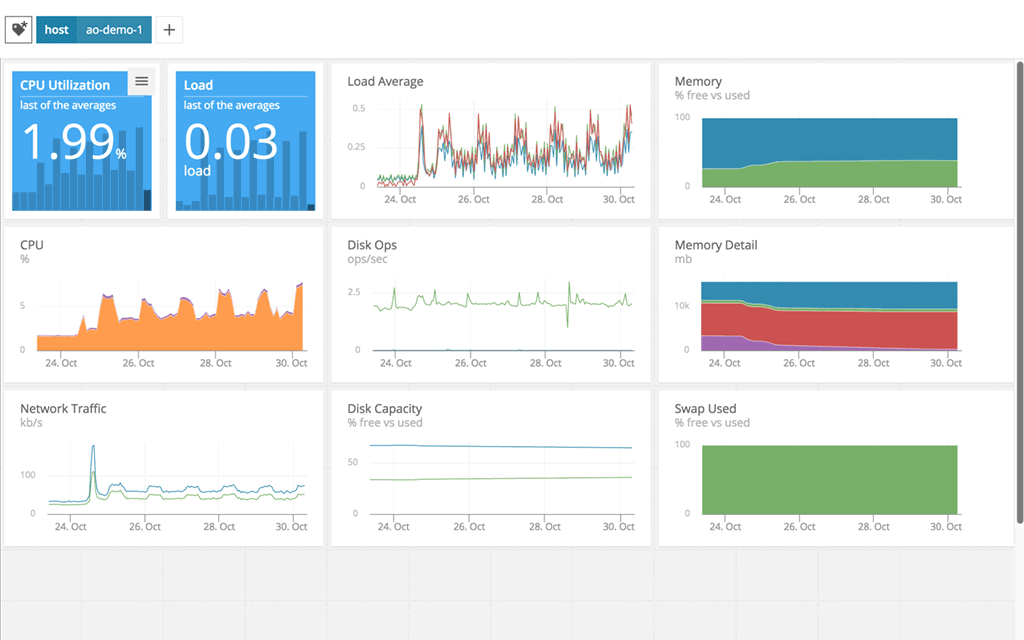
AppOptics was designed to make cloud monitoring as simple as possible by streamlining the deployment process and repackaging dashboards with valuable insights straight out of the box. With very little configuration you can choose any of the 150 plus integrations from AppOptics and have your cloud services begin reporting data to the dashboard in just a few minutes.
Data is displayed through a simple modular dashboard that allows you to customize and configure its view to your liking. Since AppOptics works to monitor all environments, you can easily use it as a single APM tool to monitor everything like AWS services, hosted WordPress sites, and a local server environment as well.
As the data pours in, smart alerting can be configured to detect new problems as well as anomalous behavior and deviations from a set baseline. Different cloud platforms can be compared side by side and multi-cloud services can be bundled into a single dashboard to help admins get a service-level view of how a particular asset is performing.
Once issues are found, the platform has a host of advanced troubleshooting tools admins can use to get problems fixed fast. Real-time distributed tracing allows you to go from overview to deep dive in just a few clicks and gives teams the tools they need to find bottlenecks in microservices across any cloud environment.
Pros:
- Offers great visualizations reflecting live and historical health metrics and resource consumption
- Is easily scalable cloud service
- Tracks all major resources focusing on over 180 different metrics
- Can monitor Docker, Azure, and Hyper-V platforms, offering more flexibility than competing options
Cons:
- Would like to see a longer trial period
AppOptics features two tiers, Infrastructure Monitoring, and Infrastructure and Application Monitoring. The first tier starts at $9.99 per month and includes the ability to monitor 10 hosts or 100 containers. The second tier starting at $24.99 per month allows more visibility into the same amount of hosts by providing live code profiling, expecting tracking, distributed tracing, and root cause analysis.
You can test-drive the full version of AppOptics completely free with a 30-day free trial.
2. Pingdom – FREE TRIAL
For sysadmins looking to monitor their cloud-based web services, Pingdom by SolarWinds offers an easy and scalable way to start monitoring your sites and services. You may know that you can ping other websites with Pingdom, but in reality, you can monitor much more.
Key features:
- iOS and Android mobile app
- Apdex score monitoring
- Full-stack troubleshooting
Pingdom is a core part of a bigger tool called SolarWinds DevOps which offers full-stack monitoring as a service. Here you can view the overall performance of your site, getting a real-time look at metrics like page speed, transaction monitoring, real user monitoring, and bounce rates.
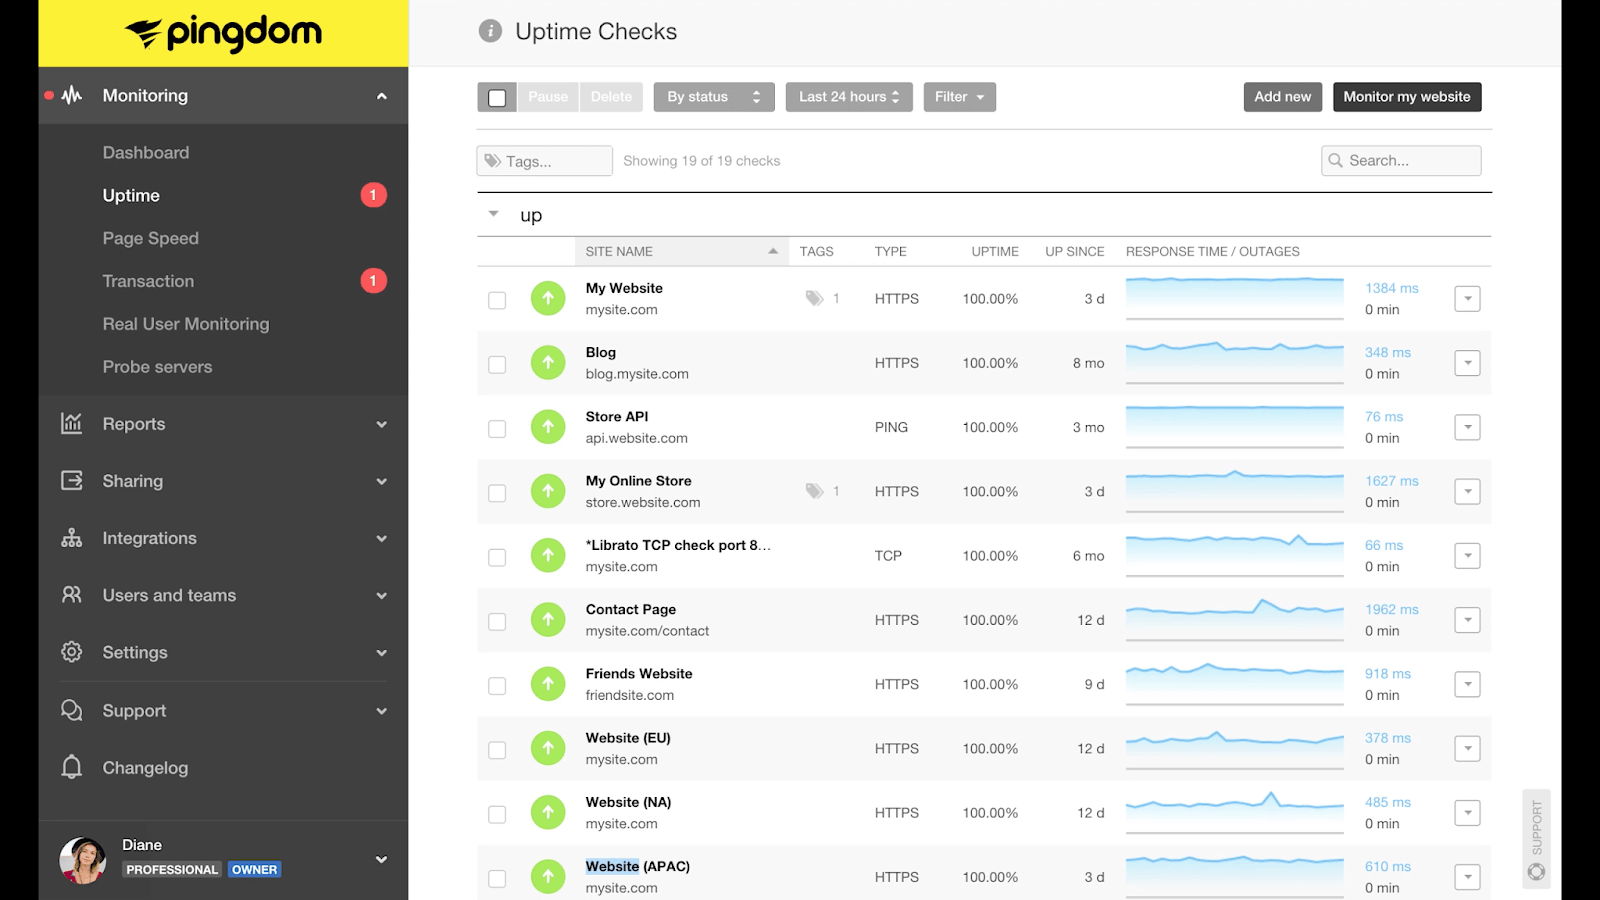
Pingdom can also monitor the performance and uptime of your web cloud server, monitoring it externally from different parts of the world to ensure your customers are getting congruent availability worldwide. Prebuilt metrics and visuals help get the ball rolling with no time wasted on creating reports or fussing with dashboard layouts.
The central home screen provides a solid balance of visuals to insights and makes it simple to see on a map where bottlenecks are occurring for your global services. Intelligence monitoring also configures an Apdex score for your site, giving you a single health score that offers an at-a-glance look at your overall performance.
Immediate alerts via email, push notification, or third-party apps combined with root cause analysis tools empower admins to not only get issues resolved but find the core of the problem and prevent it from happening again.
One of my personal favorite aspects of Pingdom is the mobile app for iOS and Android, which manages to keep many of the detailed reporting metrics on mobile, without it feeling too cluttered or overwhelming.
Pros:
- Can monitor externally from over 70 locations, making it a great option for monitoring applications and services that serve a global audience
- Lives in the cloud, meaning no onboarding or complicated setup
- The dashboard is accessible from anywhere an internet connection is available
- Alerts can be sent to email, SMS, and even integrate into custom solutions via API
- Uses root cause analysis to assist admins in fixing issues quickly
Cons:
- Could benefit from a longer trial time
Pricing is straightforward and starts at $10.00 per month. You can test out the platform for your cloud-based site free with a 30-day free trial.
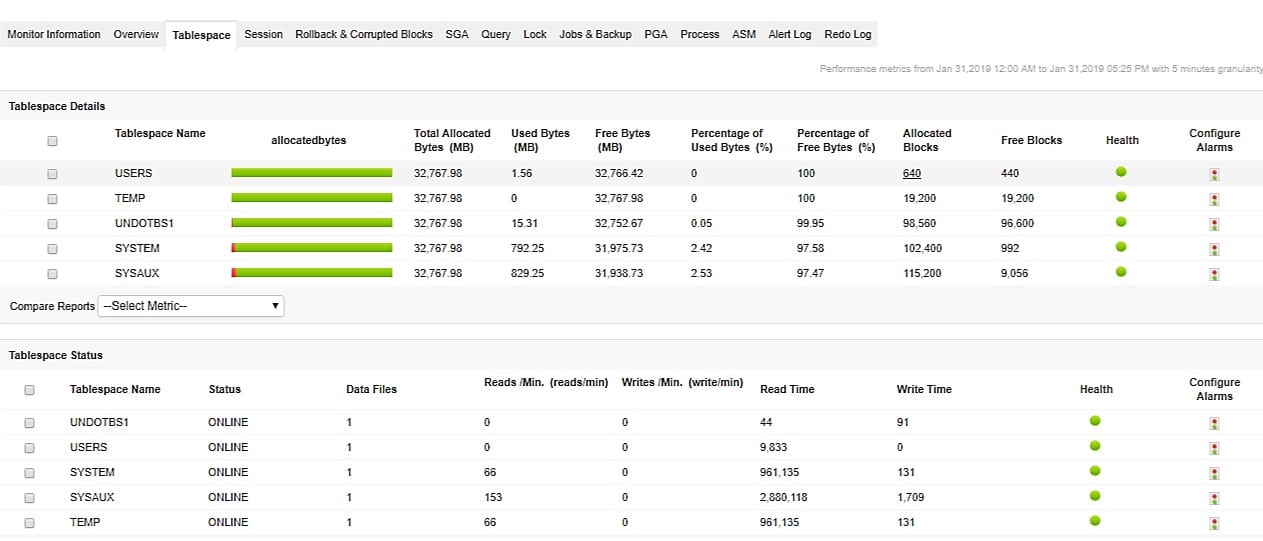
3. SolarWinds Server & Application Monitor – FREE TRIAL
SolarWinds Server & Application Monitor (SAM) can monitor both cloud services as well as on-premises servers, and offers end-to-end monitoring virtually anywhere, making it a great choice if you have an even split between on-premises and cloud services.
Key features:
- Dependency monitoring
- Correlation tools
- 1200+ insight templates
For cloud services, simple agentless sensors can monitor containers or entire platforms like AWS, Rackspace, or Microsoft Azure. SAM does a particularly good job at tracking the performance of applications, even if they move through a hybrid cloud environment. With its ready-to-go correlation tools, you can create reports that allow you to not only see into your performance but allow you to compare and see which cloud services are performing better than another.
On a granular level, troubleshooting tools give the tech the ability to combine multiple data types and look at performance on an application or service level. With SAM comparing data side by side was purposefully made as intuitive as possible. You can drag and drop two widgets from your dashboard from different cloud environments over each other and SAM will automatically provide correlation and analysis of each platform.
The platform offers over 1200 templates for monitoring, reporting, and visualizing entire multi-cloud or hybrid cloud ecosystems. When it’s time to do a deep dive into a problem SAM can help provide critical context into complex problems with built-in cross-stack correlation and dependency monitoring that help shave critical hours off the troubleshooting process.
Pros:
- Designed with large and enterprise networks in mind
- Supports auto-discovery that builds network topology maps and inventory lists in real-time based on devices that enter the network
- Has some of the best alerting features that balance effectiveness with ease of use
- Supports both SNMP monitoring as well as packet analysis, giving you more control over monitoring than similar tools
- Uses drag and drop widgets to customize the look and feel of the dashboard
- Robust reporting system with pre-configured compliance templates
Cons:
- Designed for IT professionals, not the best option for non-technical users
SolarWinds Server & Application Monitor is designed to be an end-all solution for monitoring across the enterprise no matter where your app or services reside. Pricing for SAM starts at $1622 with both subscription and perpetual licensing available.
You can trial all of SAMs features through a 30-day free trial.
4. ManageEngine Applications Manager – FREE TRIAL
ManageEngine Applications Manager is able to monitor on-premises systems and cloud platforms. It will also track the activity of virtual environments, including virtualizations, hyperconverged systems, and containers. The Cloud monitoring services in the Applications Manager will monitor AWS, Azure, Google Cloud Platform, and Oracle Cloud Infrastructure.
Key features:
- Monitors cloud platforms
- Tracks services
- Maps applications
This system will track the software that you install on your cloud compute accounts and it will also monitor the performance of cloud storage systems. The Serverless Monitoring package in the Applications Manager is linked to a monitoring service for microservices and stored functions.
Applications Manager tracks through all of your software and services and maps them. The application dependency map links together the modules that compose Web applications and also identifies connections between applications and the services and platforms that support them.
The application dependency map provides predictive alerts because it can calculate the resource needs of each software system when it launches. Watching multiple applications simultaneously spots when all of them are likely to place stress on resource capacity. The map also provides instant root cause analysis when problems do arise.
Pros:
- Tracks compute and storage accounts on AWS, Azure, GCP, and Oracle Cloud Infrastructure
- Monitors Web applications with distributed tracing and code profiling
- Tracks middleware, services, and server resources
- Application dependency mapping for predictive alerts and root cause analysis
- Free edition available
Cons:
- Not a SaaS package
There are three editions of the Applications Manager. The first of these is Free, which will track five assets. The Professional edition is sized for small businesses. Its price starts at $395 per year. The Enterprise edition is intended for use by large, multi-site businesses and its starting price is $9,595 per year.
The software for Applications Manager installs on Windows Server or Linux. It is also available as a service on AWS Marketplace and Azure Marketplace. You can assess the package with a 30-day free trial.
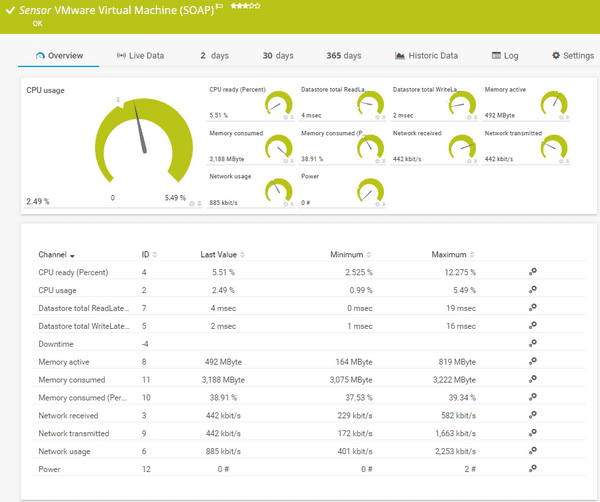
5. Site24x7 – FREE TRIAL
Site24x7 offers cloud, multi-cloud, and hybrid-cloud monitoring across platforms like AWS, GCP, and Microsoft Azure. AWS Site24x7 can analyze and monitor the performance across Amazon services like EC2, Lambda, S3, RDS, WorkSpaces, and CloudFront.
Key features:
- Multi-cloud monitoring
- AI-powered reporting and assistance
- 100 plus add-ons
The platform leverages machine learning and AI-powered services to provide on-the-fly optimizations and best practice recommendations for your cloud environment. This AI-fueled reporting helps dramatically reduce troubleshooting time, and assists help desks in achieving faster resolution times.
Site24x7 can utilize over 100 different plugin extensions which act as simple integrations into services such as MySQL, MongoDB, and Elasticsearch. With VM extensions, you can start porting over system-level metrics from virtual machines such as CPU usage, storage capacity, and network usage for any Windows or Linux virtual environments that may be hosted in the cloud as well. This gives you the unique ability to not only monitor cloud services as a whole but also keep tabs on the individual virtual machines you have deployed as well.
Pros:
- Flexible cloud-based monitoring option
- Offers a host of out-of-box monitoring options and dashboard templates for SQL server
- Allows administrators to view dependencies within the application stack, good for building SLAs and optimizing uptime
- Offers root cause analysis enhanced by AI to fix technical issues faster
- Can unify SQL monitoring across multi-cloud environments
Cons:
- Site24x7 is a feature-rich platform with options that extended beyond databases management, may require time to learn all options and features
The pricing model Site24x7 uses is simple to understand, and based on the number of services you use, wish to monitor, as well as the amount of log data you want to collect. Pricing starts at $9.00 per month and offers simple add-ons as your cloud monitoring needs increase.
You can test out Site24x7 cloud monitoring for free with its 30-day free trial.
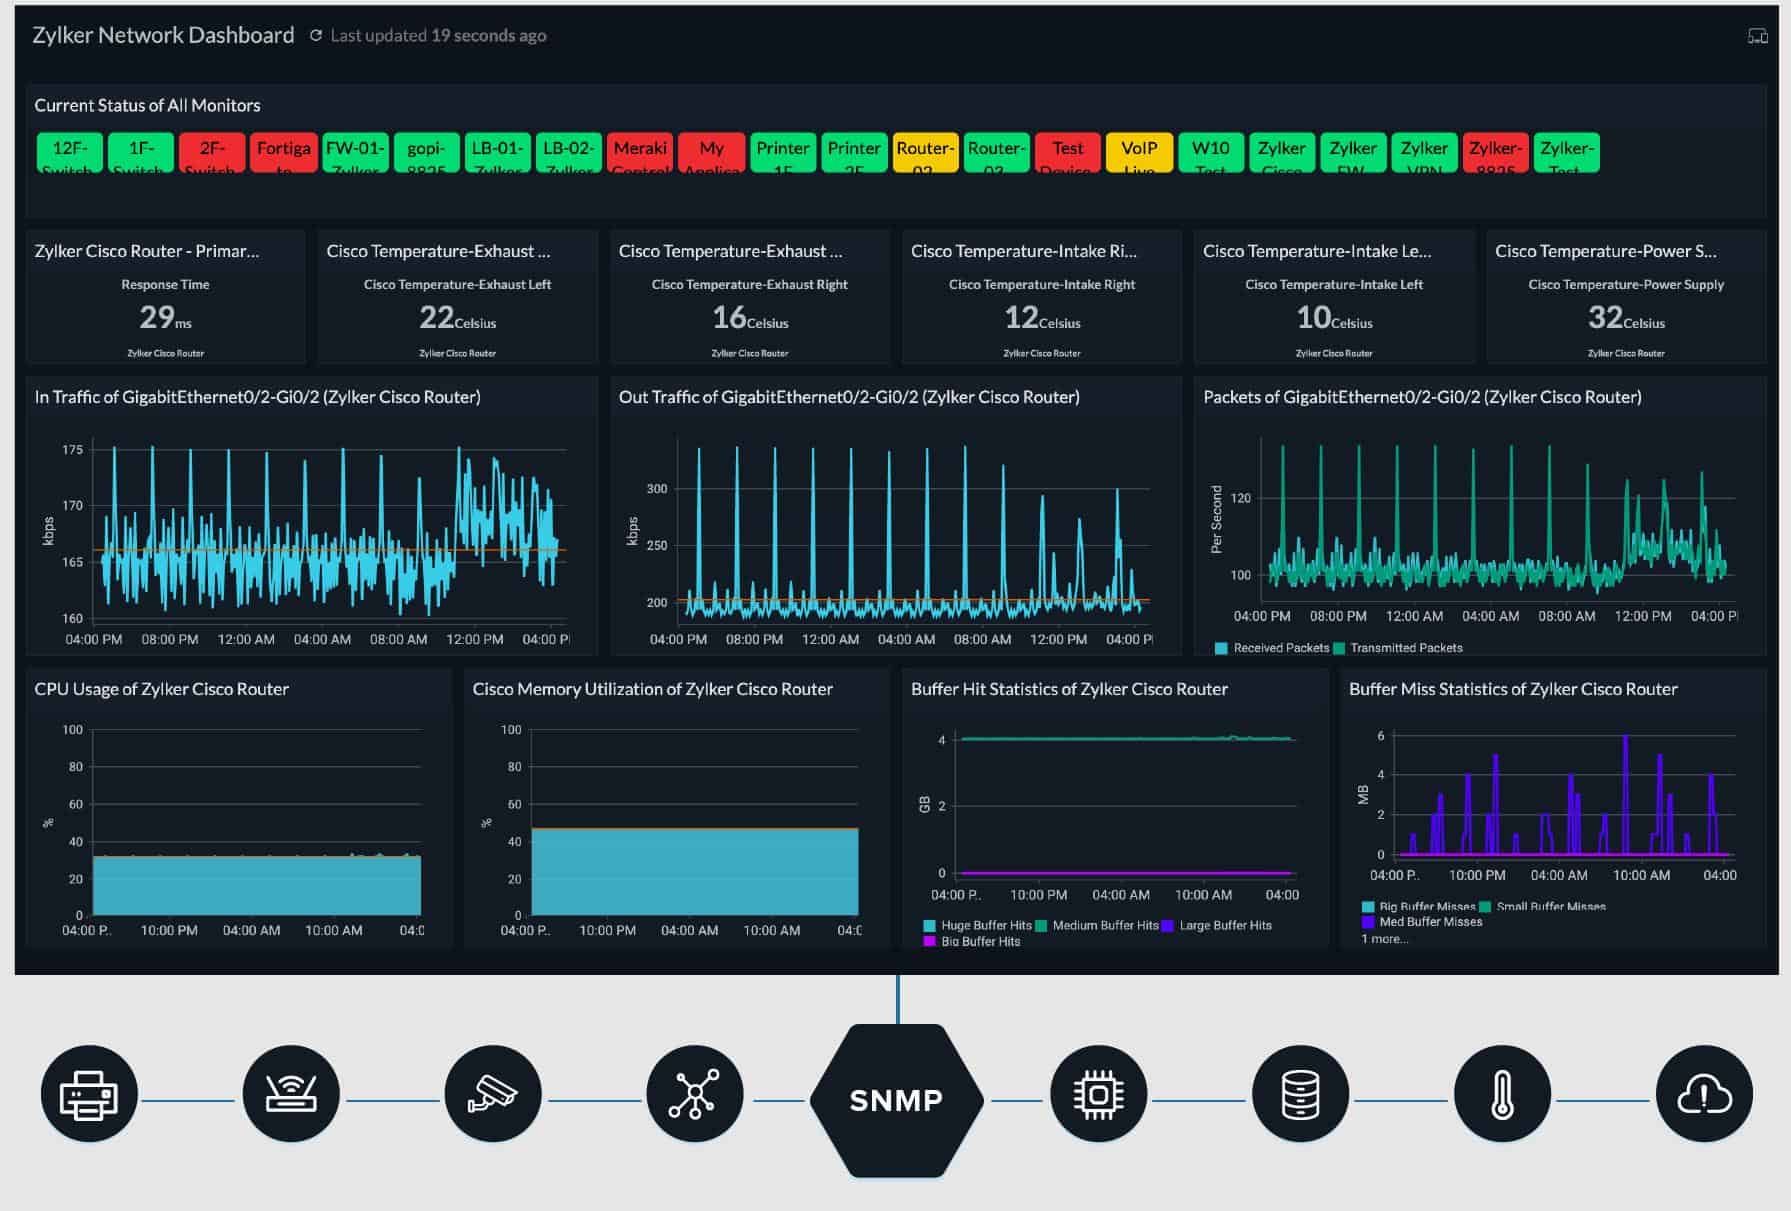
6. Paessler PRTG – FREE TRIAL
Paessler PRTG uses multiple sensors that are customized and designed to pull the most amount of data from each cloud platform, and centralized in a single dashboard for real-time analysis and reporting.
Supported cloud environments include Amazon CloudWatch, Microsoft OneDrive, Dropbox, GCP, and Microsoft Azure. Since every sensor is built specifically for each platform, you can actually configure your own custom sensor for whatever environment you need to be monitored.
Key features:
- Customizable sensors
- Multi-cloud monitoring
- Freeware version
PRTG can monitor EC2, SQS, RDS, ELB, and EBS via the CloudWatch integration. While CloudWatch is great for the AWS environment, many organizations now use multi-cloud services and tools. PRTG allows you to ‘drop’ these sensors on multiple cloud platforms and centralize all of your performance and health metrics without losing any visibility into your services.
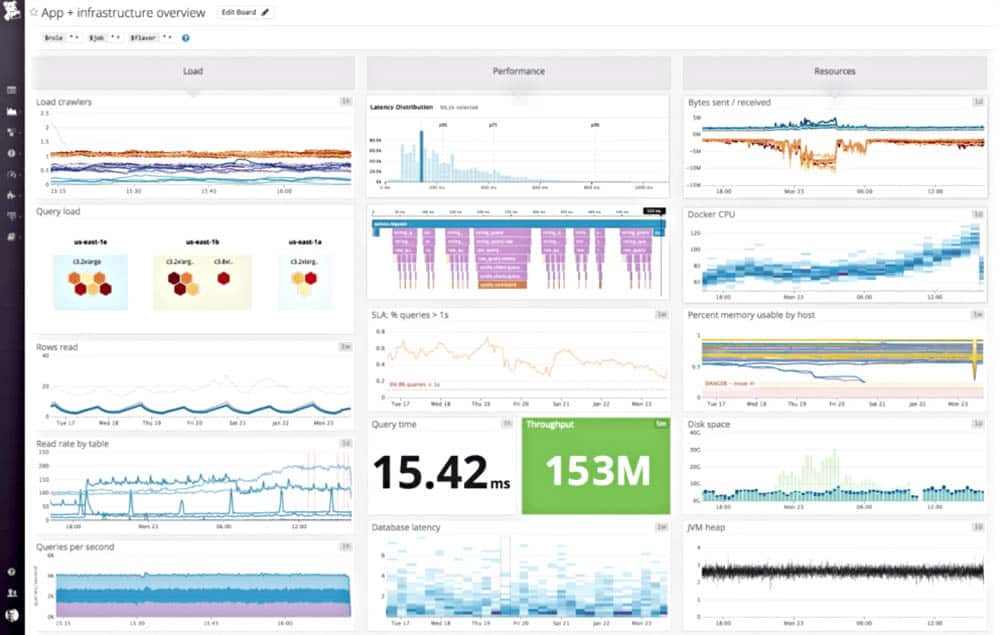
The front-end dashboard organizes this data through a clean and simple display, that can display your metrics through a number of different visualizations and elements. Outside of raw metrics, PRTG offers intelligent insights that can help teams outside the IT department. For example, the platform has a Unified Webshop dashboard that can display metrics like cart abandonment, time on page, and buy time.
These analytics along with the technical metrics can be either separated and displayed to different departments, or compared against each other to show how cloud performance directly impacts businesses operations and revenue.
Pros:
- Uses a combination of packet sniffing, WMI, and SNMP to report network performance as well as discover new devices
- Autodiscovery reflects the latest inventory changes almost instantaneously
- Drag and drop editor makes it easy to build custom views and reports
- Supports a wide range of alert mediums such as SMS, email, and third-party integration
- Supports a freeware version
Cons:
- Is a very comprehensive platform with many features and moving parts that require time to learn
Pricing for PRTG is tied to the number of sensors you wish to deploy. Each sensor can measure a particular metric. For example, a single sensor can measure uptime through a ping check, while another sensor can measure virtual disk space.
There are currently five different pricing packages available, starting with PRTG 500 that offers 500 sensors for $1750. With its flexible licensing you only pay for the sensors that you currently have in use, which makes growth for your cloud monitoring more predictable.
You can test out Paessler PRTG either through its freeware tier with 100 sensors, or try out the full version through a 30-day free trial.
7. Datadog Cloud Monitoring

Datadog Cloud Monitoring comes in at number one on our list for best cloud monitoring tools for quite a few reasons. First, Datadog has a knack for simplifying complex data points over large environments. This is done primarily through its advanced filtering and elegant interface, which makes centralizing the data from multiple different cloud services even easier.
Key features:
- Multi-cloud support
- 400+ integrations
- Easy to build dashboards
The platform features simple pre-configured integrations into some of the largest platforms like AWS, GCP, Alibaba Cloud, and Azure. There are over 400 additional integrations into other platforms and services like Slack or PagerDuty. For those needing to centralize data from custom-built applications, Datadog offers robust API access for developers as well.
Different data sources and cloud environments can be monitored from a single dashboard that allows you to filter your view to monitor not just environments on their own, but by contextual relationships as well. For instance, if you’re an MSP, you can create a custom view that allows you to see only the different cloud environments for that particular client.
The platform offers an easy way to not just monitor metrics of your cloud services, but also dive deep into issues by analyzing the full-stack data that's aggregated from all your cloud environments. Tagging keeps data organized no matter where it came from, and built-in orchestration tools keep new services and dynamic hosts enrolled in continuous monitoring.
For cloud migrations, Datadog offers unique features to help plan and evaluate the requirements for your cloud infrastructure prior to moving. While the migration is in progress, data collection and monitoring continue uninterrupted. Historical logs captured by the system can also be used to measure not only performance but the accuracy of migrations you perform.
Pros:
- Has an excellent interface, easy to use, and highly customizable
- Cloud-based SaaS product allows monitoring with no server deployments or onboarding costs
- Can monitor both internally and externally giving network admins a holistic view of network performance and accessibility
- Supports auto-discovery that builds network topology maps on the fly
- Changes made to the network are reflected in near real-time
- Allows businesses to scale their monitoring efforts reliably through flexible pricing options
Cons:
- The trial could be longer
Pricing for Datadog is separated into three tiers, starting with a completely free tier that offers limited capabilities but still offers basic data collection and visualization features. Paid services start at $15.00 per month when billed annually. Enterprise volume discounts are available for organizations monitoring more than 500 hosts per month.
You can test out all of the features in Datadog cloud monitoring through a free 30-day trial.
8. AppDynamics APM
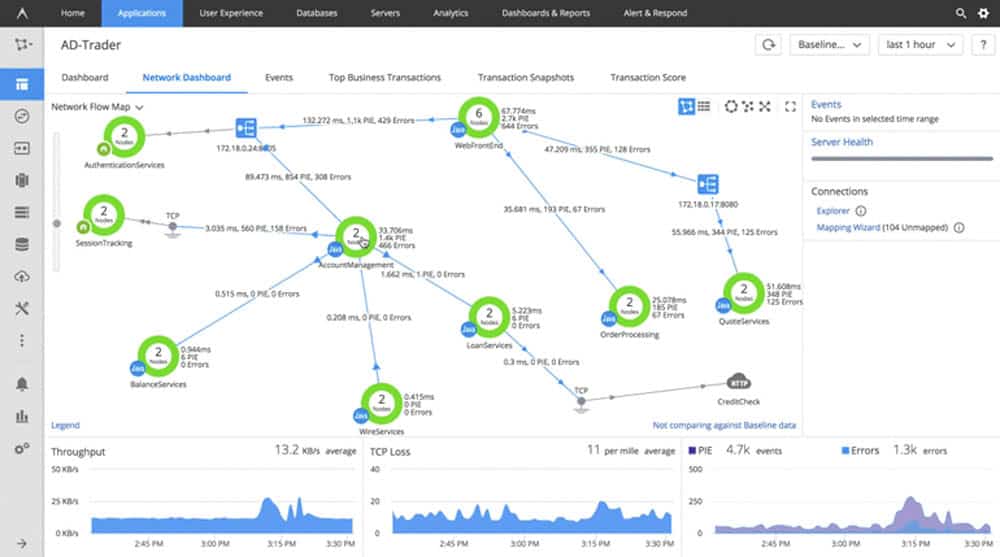
AppDynamics APM is a Cisco-backed tool that helps monitor multi-cloud services and infrastructure while comparing that performance against business metrics. A clean minimalistic UI helps calm the chaos of an enterprise-level multi-cloud environment and gives administrators a clear look at where performance is being impacted, and exactly what can be done to solve it.
Key features:
- AI-assisted root cause analysis
- Business analytics
- Infrastructure visibility.
Both metrics and visualization into the cloud come standard and out of the box with pre-made alerts that can assist you or help desk teams to prioritize what needs to be fixed first. AppDynamics uses AI-based root cause analysis to not just tell you what’s wrong, but give helpful insight as to where to look, and what the fix may be.
The platform does a great job of blending these technical performance insights with business metrics, making it a powerful tool for enterprises that could easily be used outside of the IT department. For instance, reports or dashboards can be built to directly compare and correlate care abandonments with page speed, or conversions with Apdex scores.
Pros:
- Tailored for large-scale enterprise use
- Excellent dependency mapping and visualizations to help troubleshoot complex application systems
- Includes a free version
Cons:
- Would like to see more templates for real user monitoring
Currently, AppDynamics APM supports platforms like AWS, Lambda, Microsoft Azure, plus Docker and Kubernetes monitoring. Pricing is divided into four tiers, with the Enterprise Edition offering APM, infrastructure monitoring, and business performance monitoring features at $90.00 per month per CPU core.
You can try out AppDynamics free with a 15-day trial.
Choosing the right Cloud Monitoring Tool
In this article, we’ve covered seven of the best cloud monitoring tools. But which one is right for you?
Any size cloud environment will benefit from the Datadog Cloud Monitoring suite. Its competitive pricing allows it to serve almost any sized organization while still providing some of the most detailed insights through an intuitive interface.
Companies looking to specifically monitor web servers will likely find Pingdom to be their best solution. Pingdom has numerous monitoring features that are tailored to web hosts and website monitoring.
Lastly, if business analytics is just as important as performance monitoring Dynatrace APM provides an AI-powered engine to aid both the IT department as well as management teams make data-backed decisions based on cloud performance.
What’s the biggest challenge you face when monitoring your cloud environment? Let us know in the comments below.

