
Our funding comes from our readers, and we may earn a commission if you make a purchase through the links on our website.
What is MTR & How to Use to Troubleshoot & Test your Connections
UPDATED: December 11, 2023
There are a couple of troubleshooting tools that every network administrator must be familiar with including Ping and Traceroute.
However, one tool that is not quite as popular as these two but provides extra functionality is MTR (formerly known as Matt’s Traceroute; now My Traceroute).
So What is MTR?
Matt’s TraceRoute (MTR) is one of the popular Traceroute tools in the market that helps measure how latency changes throughout time. This powerful tool further allows administrators to poll remote servers. The availability monitoring capabilities of Ping and the hop-to-hop analysis of Traceroute are combined in the MTR network monitor. To initiate MTR, use the mtr command and then the destination IP or hostname, just as you would with Ping and Traceroute.
When diagnosing network connectivity difficulties, such as erratic or slow connections, excessive packet loss, or routing issues, the MTR command is frequently used. With the help of MTR, one can measure the time it takes to travel between hops and the availability of devices using ICMP packets.
It is one of the best tools in the market to test the connectivity of your network and speed. MTR displays continuously updated data regarding latency and packet loss on the way to the destination apart from hops along the network path. This lets you see real-time information about what's happening along the line, which aids in debugging network difficulties.
When you use MTR by default, it continuously polls the destination and any devices along the way to provide you with up-to-date connectivity information. Using the CTRL+C key combination or simply clicking the Q key, you can halt it at any moment.
Another fact that makes it stand out from other constrained technologies is the ability to capture both packet loss and jitter. MTR also calculates the proportion of packets lost in transit as well as the quality of connection time required to finish a transfer.
Further, you can view performance data by running reports while using MTR. Your network's data is gathered by reports, which subsequently provide it to you as an onscreen table. Packet loss and delay details are displayed in the table.
How is MTR Useful?
Traceroute requires manual scan updates in order to track changes in a network's performance over time. On the other hand, if you use MTR, your data will remain connected until you instruct it to cease. MTR is a flexible and potent network diagnostic tool with various advantages, including:
- Path Analysis Data packets travel along the network path from a computer to a server, which is tracked by MTR. It provides a thorough overview of all the routers, or hops, and their IP addresses along the path that helps in locating and troubleshooting network problems.
- Measure Device Availability Through the device's reaction to MTR probes, it indirectly gathers information about network device availability, even if it doesn't measure device availability in the sense of whether a device is turned on or operating as intended.
- Latency Analysis MTR lets you see exactly where delays happen by showing you the round-trip time (RTT) for every hop. Excessive latency may indicate other performance problems or network congestion.
- Updates Output Continuously The MTR provides real-time information about network performance by updating its output continuously while it operates. One of the main benefits of MTR is its dynamic characteristic, which also makes it an effective tool for identifying network problems.
- Route Optimization MTR data may be utilized in certain situations to optimize network paths. For instance, you might be able to collaborate with your ISP or network administrator to enhance the routing if you discover a path that is frequently slower or less dependable to a specific server.
- Saves Historical Data MTR frequently keeps track of its measurements, which enables you to examine how network performance has changed over time. Finding patterns or trends in the behavior of networks can be greatly aided by this historical data.
Ping
Ping is probably the most common tool used to test network connectivity between devices. It works by sending ICMP echo request packets (ICMP type 8 code 0) from the sender to the receiver and if the receiver is available, it will reply with ICMP echo reply packets (ICMP type 0 code 0).
It should be noted that ping is not always accurate – a firewall may be in the path between the sender and the receiver and that firewall may be filtering ICMP packets. Therefore, just because a host does not reply to ICMP does not mean it is unavailable.
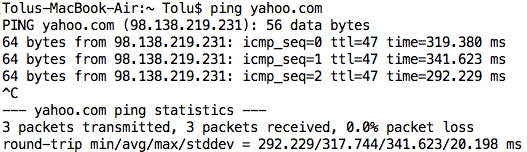
Let’s do a quick test. I will ping yahoo.com and see if I will get a response:
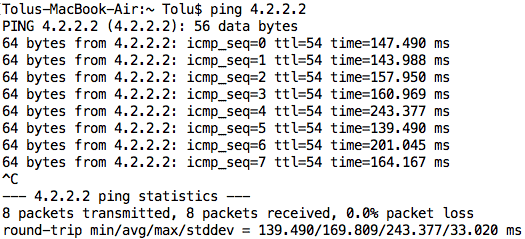
Note: Ping works differently depending on the operating system. On Windows OS, ping will send a default of 4 packets and end by itself. On Unix-based systems and also MacOS, the ping will run until you stop it (using the CTRL+C keyboard combination). You can also run a continuous ping on Windows OS using the -t option.
As you can see from the output above, 8 ICMP echo request packets were sent and 8 ICMP echo reply packets were received back i.e. 0% packet loss. Another useful information is the round-trip time (RTT) which tells you how long it took for the packet to go from the sender to the receiver and then back.
You can use this information to diagnose the quality of the link between the sender and receiver. In this case, the shortest RTT was 139.49ms, the longest 243.377ms and the average (of the 8 packets) was 169.809ms. Generally speaking, you should pay attention to the average RTT except in cases where the standard deviation (stddev) is really high.
If we were to use Wireshark to capture packets as the ping was running, we would see the ICMP echo request and reply packets:

Finally, you can also use ping to troubleshoot DNS connectivity. If you ping a hostname, ping will first try to resolve that hostname to an IP address.
If it is unable to, then you know there may be an issue with your DNS:
Traceroute
Traceroute works a bit differently from ping. While ping will tell you whether or not a device is available, traceroute will tell you the path between the sender and the receiver. This can be very useful especially in cases where the entire network is under your administrative control.
For example, if you have two connections to different ISPs and you think traffic should be flowing out of one ISP, you can use traceroute to confirm if this is true.
By default, when a router (or hop device) receives a packet, it decrements the time-to-live (TTL) and tries to forward the packet along.
However, if the TTL reaches zero, the device will drop the packet and send an ICMP Time Exceeded error packet (ICMP type 11 code 0) to the sender. Traceroute uses this behavior to determine hops between a sender and a receiver as follows:
- In the first packet, the TTL is set to 1. When it reaches the next hop, that device will decrement the TTL to zero, drop the packet, and return an ICMP time-exceeded error message to the sender. Therefore, traceroute on the sender knows the first device in the path.
- Traceroute will then send a second packet with a TTL value of 2. The next hop will receive this packet, decrease it by one and the TTL then becomes 1.
- The next hop will then forward the packet (now with TTL of 1) to the next device. That device will decrement the TTL to zero, drop the packet and return an ICMP time-exceeded error message to the sender. Now, traceroute knows the 2nd device in the path.
- Continue this process until it gets to the destination.
Just like ping, Traceroute also measures the RTT, but this is done between the sender and each device in the path.
Note: On Unix-based systems and also MacOS, Traceroute sends UDP packets from the sender to the destination. On Windows system, Traceroute uses ICMP echo requests packets. Also, the command to invoke traceroute on Windows OS is “tracert” while it is “traceroute” on most other systems.
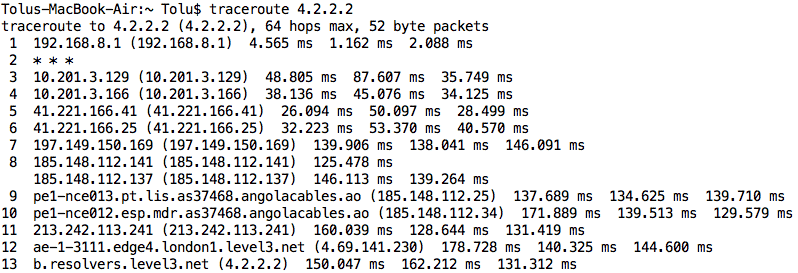
In the output above, notice that traceroute has discovered all the devices in the path between the sender and the receiver and also the RTT between the sender and those devices. By default, traceroute sends three (3) packets to each device and that is why we have three RTTs for each device.
Also, notice that one of the devices has three asterisks (*) – this is probably because the device is configured to filter such traffic. Finally, notice that some of the IP addresses have been resolved to hostnames. This is the work of reverse DNS and it is enabled by default when you run traceroute.
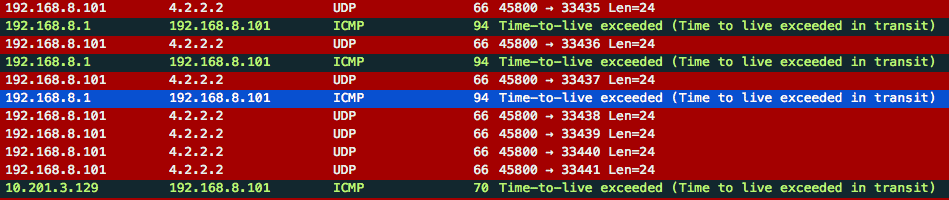
Part of the corresponding Wireshark capture for the traceroute above is as follows:
MTR
Now that we have seen the two utilities that make up MTR, let us now look at What MTR is. Unlike Ping and Traceroute which are enabled by default on most systems, MTR may need to be installed on the system you want to use.
Note: Installation guide for different operating systems can be found here.
Just like ping and Traceroute, you run MTR using the mtr command followed by the destination address/hostname.
Note: You may need to run the mtr command using root privileges (sudo) on MacOS and Linux systems.
By default, when you run MTR, it continually polls the destination (and devices in the path) giving you real-time information about connectivity. You can stop it anytime using the CTRL+C combination or just pressing the q key.:
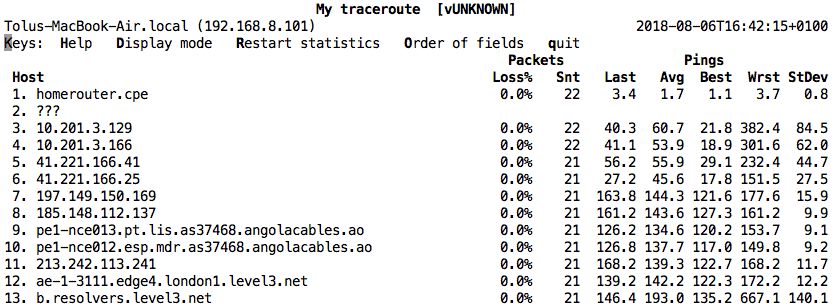
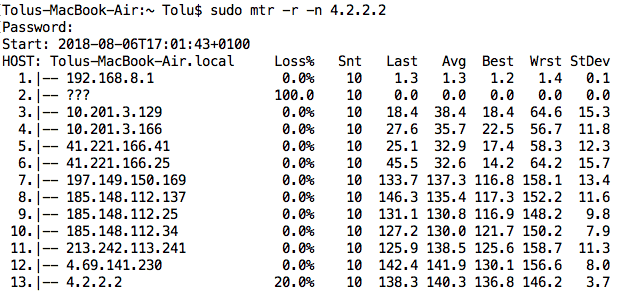
As you can see from the output above, MTR combines ping (RTT and packet loss) with traceroute (devices in the path between sender and receiver). Using this information, you can determine the following on your network:
- Connectivity to destination device If the MTR successfully gets to the destination, then you know there is connectivity between source and destination. However, if it is unable to reach the destination, it does NOT mean there is no connectivity – there could be something in the path blocking traceroute. We will talk about other options around this later.
- Packet loss The packet loss column tells you about the quality of the link between source and destination – too many packet losses and you may need to troubleshoot further. Sometimes, packet loss along the path between source and destination is common as some devices may be rate-limiting (or filtering) packets used by ping/traceroute/mtr.
- Round-Trip Time If it’s taking too long for packets to go from source to destination, there may be something wrong with the quality of your link. It could also be that the distance between source and destination is quite large. For example, between device 6 (41.221.166.25) and 7 (197.149.150.169), there is a big jump in the RTT. Upon research, I see that those IP addresses are in two different countries (Nigeria and Angola), which is why the RTT is that large, as packets are traveling far.
Related Post: How To Test For Packet Loss On Windows
Report Mode
Running MTR in the default interactive mode can result in a lot of packets being sent continuously which may affect network performance. Therefore, we can run MTR in the “report” mode where 10 packets are sent by default to each device, and the report of the network statistics is shown to us:
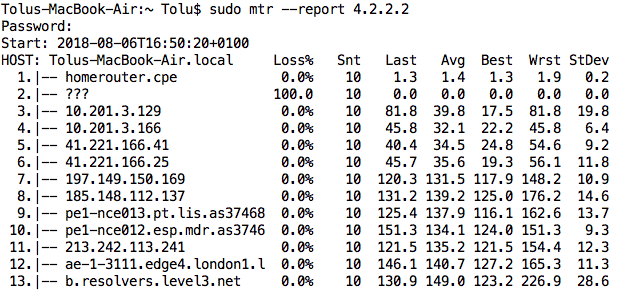
Note: You enable report mode using two hyphens (-) followed by report i.e. –report. Or you can simply use the -r option.
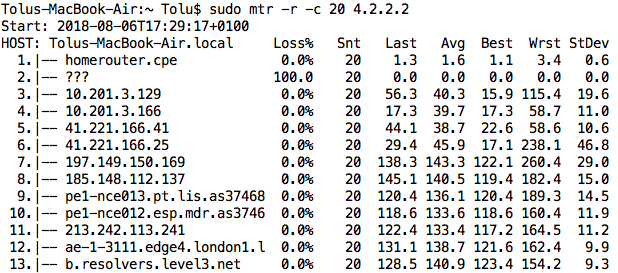
We can increase or decrease the number of packets that MTR sends in report mode using the -c option (or –report-cycles).
Increase test speed
By default, when you run MTR, it will try to use reverse DNS to resolve IP addresses to hostnames. This can slow down your troubleshooting process especially if you are not interested in DNS or using DNS on your network. We can disable the DNS resolution process using the -n or –no-dns option.
Also, MTR sends successive packets every 1 second. This may be fine when a network is operating normally. However, during network congestion, packets usually arrive at a faster rate. We can use the -i option (or –interval) to specify how often we want MTR to send packets, thus simulating a congested network:
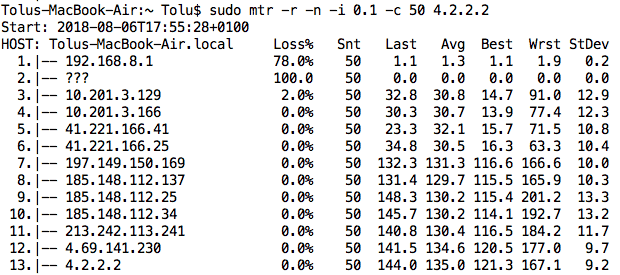
Notice that with a shorter interval between packets and sending 50 packets, I now see some packet loss between the source and some devices in the path.
Jitter
Some applications like Voice are sensitive to jitter and you can use MTR to view the jitter along the path between source and destination. This information is not displayed by default but we can use the -o option (or –order) to specify the order of the fields we want to see. The field options are as follows:
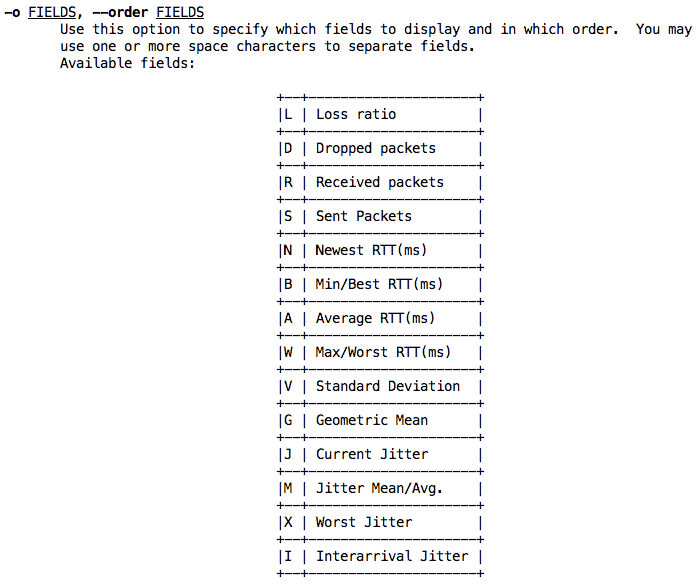
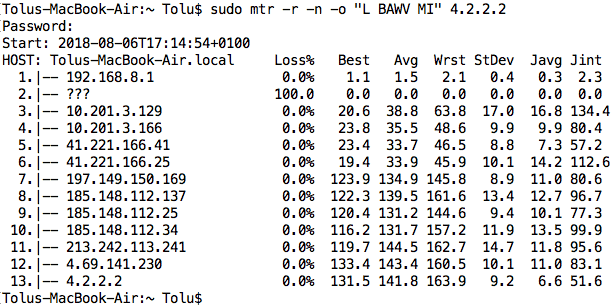
Let’s assume I want to view the average jitter and interarrival jitter along with the loss ratio, best/average/worst RTT, and standard deviation, the command will be: mtr -o “L BAWV MI”
Related Post: Network Jitter – What is it and How to Monitor it
AS Number
You can also ask MTR to attempt to lookup the AS number of the devices along the path between source and destination. This can be useful for several reasons like when troubleshooting BGP or if you would like to know which of the devices along the path belong in the same AS (i.e. under the same administrative control). We use the -z option (or –aslookup) to achieve this:
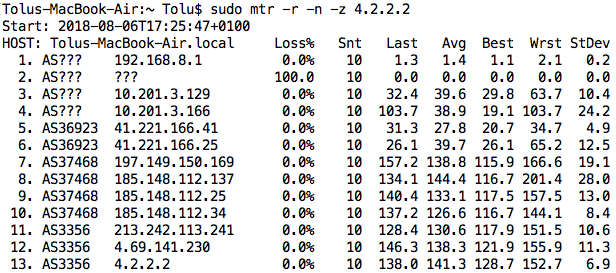
Note: You can also combine options together such as “-rnz” versus “-r -n -z”.
As you can see from the above output, I know devices 5 and 6 belong to the same AS (36923), devices 7 to 10 also belong to the same AS (37468) while devices 11 to 13 belong to the same AS (3356). You can do a Google search on these AS numbers for more information. For example, AS 3356 belongs to Level 3 Communications.
Use TCP/UDP/SCTP
By default, MTR sends ICMP echo request packets and uses the ICMP time exceeded error message to determine the devices in the path between source and destination. However, some devices filter ICMP packets causing MTR not to report properly. One way around this is to change the way MTR works. Instead of sending ICMP, you can configure MTR to send UDP, TCP, or even SCTP (Stream Control Transmission Protocol) packets. You can also specify the port you want it to send to.
As an example, I tried using MTR on google.com and I noticed that the destination device was filtering my ICMP packets:
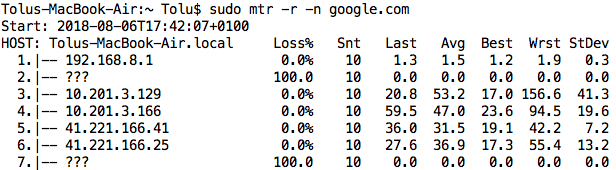
Since I know google.com will respond to TCP port 80 (HTTP), I can change my MTR options to use that instead. The option for UDP is -u (or –udp), TCP is -T (or –tcp), while SCTP is -S (or –sctp) and you can specify the port using -P (or –port).
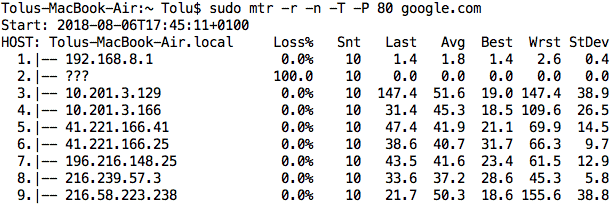
As you can see, I can now get all the way to my destination (google.com).
Conclusion
This brings us to the end of this article where we have discussed the MTR tool which is a network troubleshooting tool that combines both the ping and traceroute utilities. We have looked at several options that can be used with the MTR tool including the report mode, displaying packet jitter, and changing the default ICMP packets to TCP or UDP.
There are many other options on MTR that we have not considered in this article. On MacOS or Unix-based systems, you can use the “man mtr” command to view the various options. On WinMTR, just click on the Options button.
MTR Command FAQs
What is the MTR command?
The MTR command is a network diagnostic tool that combines the functionality of the "ping" and "traceroute" commands.
What is the purpose of the MTR command?
The purpose of the MTR command is to diagnose and troubleshoot network connectivity issues by showing the route that packets take from a source to a destination, identifying any network bottlenecks or failures along the way, and providing real-time statistics on packet loss and network latency.
How does the MTR command work?
The MTR command works by sending a series of packets to the destination and measuring the response time and packet loss at each hop along the route. The results are displayed in a continuously updated report that shows the route taken by packets and the performance of each hop along the way.
What are some common uses of the MTR command?
The MTR command is commonly used to diagnose network connectivity issues, such as slow or unreliable connections, high packet loss, or routing problems.
How does the MTR command differ from the "traceroute" command?
The MTR command is similar to the "traceroute" command, but provides additional information on packet loss and latency in real-time. Unlike "traceroute," MTR also allows you to continuously monitor the route and performance of packets over time.

