
Our funding comes from our readers, and we may earn a commission if you make a purchase through the links on our website.
VM Performance Monitoring Software & Tools for Maximizing & Optimizing Virtual Machine Performance!
UPDATED: October 27, 2023
Today, it is hard to see an enterprise that is not running some form of a virtual environment.
These enterprises are building hybrid environments running virtual, cloud, and on-premises infrastructure to run their workloads. And all of that without underutilized computing resources, additional data center space, or large energy bills. But no technology is great without proper management and monitoring.
Keeping a sharp eye on the entire performance and health of the virtual environment, from the workloads deployed on VMs to the underlying hardware of the host, is crucial.
In the following article, we will take a closer look at Top Tools and Software for Monitoring VM Performance.
Here is our list of the top VM performance monitoring software:
- SolarWinds Virtualization Manager – FREE TRIAL A more comprehensive paid VM monitor from SolarWinds that has great live data monitoring screens. Installs on Windows Server. Start a 30-day free trial.
- ManageEngine OpManager – FREE TRIAL This network and server monitoring package includes modules for monitoring VMWare, Hyper-V, Citrix, and Nutanix. Available for Windows Server and Linux. Access the 30-day free trial.
- Site24x7 VM Monitoring – FREE TRIAL A monitoring tool for networks, servers, and applications that includes the supervision of VMWare and Hyper-V hypervisors plus the physical servers that host them. This is a cloud-based solution. Get a 30-day free trial.
- Paessler PRTG – FREE TRIAL A network, server, and applications monitoring bundle that includes special sensors for Citrix Xen, VMWare vSphere, and Microsoft Hyper-V virtualizations. Runs on Windows Server. Start a 30-day free trial.
- SentryOne SQL Sentry – FREE TRIAL An SQL Server monitor that also watches over the performance of supporting Hyper-V and VMWare virtual machines. Available as an Azure service or for installation on Windows Server. Start a 14-day free trial.
- ManageEngine Applications Manager – FREE TRIAL Monitors Citrix, VMWare, Hyper-V, and Oracle hypervisors plus Docker and Kubernetes containers. Available for Windows Server and Linux. Start a 30-day free trial.
- IntelliMagic Vision This virtualization system monitor tracks the performance of VMWare and connects through to supervision of storage fabrics plus the underlying resources of all virtual systems. Available as a virtual appliance or as a cloud platform.
- Veeam One A monitoring tool for virtualizations and backup systems, this tool covers VMware vSphere, Microsoft Hyper-V, and Nutanix AHV. Runs on Windows and Windows Server.
- Opsview Virtualization Monitor This tool can monitor VMWare, Hyper-V, and KVM hypervisors plus Docker containers. Installs on Linux.
- eG Enterprise A cloud-based service that can monitor VMware vSphere, Citrix XenServer, Microsoft Hyper-V, Oracle VM Server, Red Hat Enterprise Virtualization, AIX LPARs, and Solaris Containers.
- LogicMonitor A cloud-based infrastructure monitor that will automatically discover and map Citrix, VMWare, and Hyper-V VM allocations.
Monitoring the Performance on your VMs
A performance issue on a machine hosting multiple VMs will not only affect the physical server, but it will also impact all the VMs and their applications.
So monitoring performance and health in the virtual environment becomes crucial for any business.
What Can Affect Performance in a Virtual Environment?
- Under- or over-allocation of resources. Over-allocation of resources to a VM leads to an unbalanced use and under-utilization of resources.
- Network traffic or overloaded interfaces. VMs also share the network. High utilization of network bandwidth or too much traffic on a single NIC can impact the performance on all VMs.
- Incorrect sizing and storage configuration. Poor storage can lead to performance bottlenecks.
Tracking resource usage metrics over time can help determine the right allocation of resources to each VM, save storage, and avoid network outages.
There are a couple of these metrics that can be monitored to stay on top of performance, like hardware health, network connectivity, VMs resource utilization, and Idle VMs.
Aside from tracking metrics, there are also some best practices to help you improve VM performance.
Making sure that your host OS is at top performance can help all your VMs.
For example, ensuring that your host disk is clean, defragmented, and that it is not running high-resource-consuming applications, can improve the performance of all VMs.
You can also optimize VMs, by running them on separate hard drive instances and by optimizing them for the specific task.
The Best VM Performance Monitoring Software & Tools
Our methodology for selecting VM monitoring tools and software
We reviewed the VM performance market and analyzed the options based on the following criteria:
- VM environment support
- Operating system support
- Ease of use and reporting features
- Graphical interpretation of data, such as charts and graphs
- A free trial period, a demo, or a money-back guarantee for no-risk assessment
- A good price that reflects value for money when compared to the functions offered
All the following VM monitoring tools and software are capable of at least keeping an eye on resources like CPU and memory and network stats, which are critical for virtual environments. All tools can at least send alerts based on a predefined threshold. Other advanced tools can monitor the entire virtual environment, perform predictive analysis, create reports, and more.
1. SolarWinds Virtualization Manager – FREE TRIAL
The SolarWinds Virtualization Manager is a VM monitoring system designed to optimize performance and fix problems.
Key Features
- Predictive Recommendations: The tool can deliver predictive recommendations so that you can fix VM performance issues before they happen.
- VM Sprawl Control: This feature helps you save resources, by turning off idle VMs, removing powered-off VMs, or removing old and large snapshots.
- Capacity Planning: Predict resource trends for metrics such as CPU, storage, network, etc.
- Complete visibility of the application stack: Manage the health of your infrastructure, from the network, server, OS, to the application.
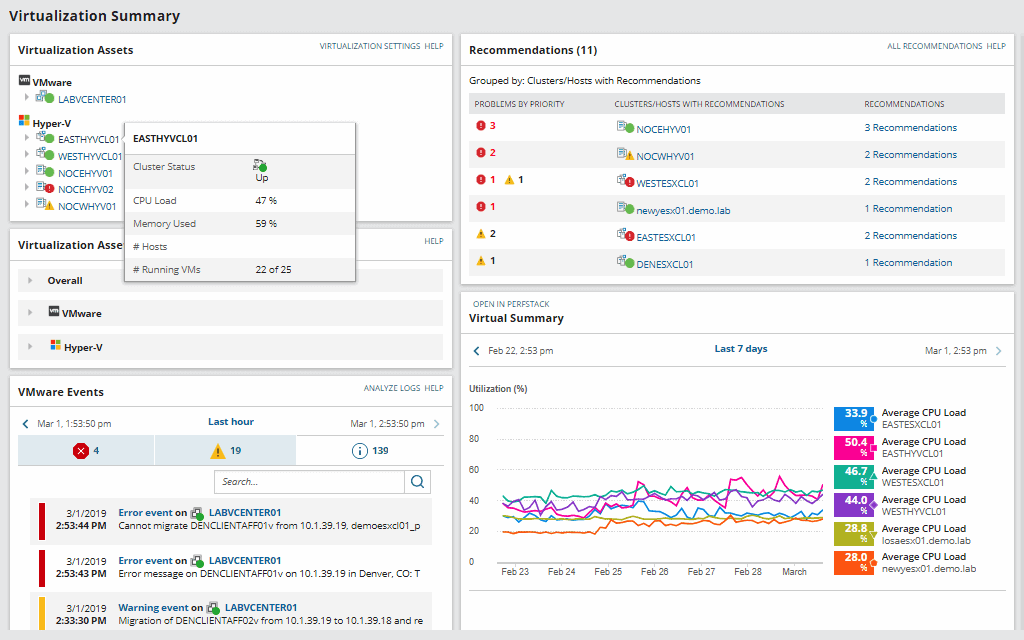
As mentioned before, the Virtualization Manager can monitor more than one server, and it also includes lots of more features compared to the free VM Monitor.
With this tool, you can keep track of the performance, capacity, and usage of your entire virtual environment.
It can monitor hosts, VMs, containers, clusters, vSANs, and a lot more. It can also attempt to fix VM issues with specific management actions.
With Virtualization Manager, you can also monitor and alert cloud infrastructures like Amazon and Azure located on-premises or in hybrid virtual environments.
Pros:
- Excellent dashboard that can scale to comfortably manage multiple hosts and VMs in an enterprise environment
- Supports monitoring individual VM resources
- Can integrate with cloud products like Azure and Amazon EC2
- Provides recommendations for improvements along with color-coded health metrics
- Offers capacity planning and detailed reporting options
Cons:
- Designed specifically for enterprise and business network environments
Get the fully-featured Free trial of SolarWinds Virtualization Manager for a 30-day limit.
2. ManageEngine OpManager – FREE TRIAL
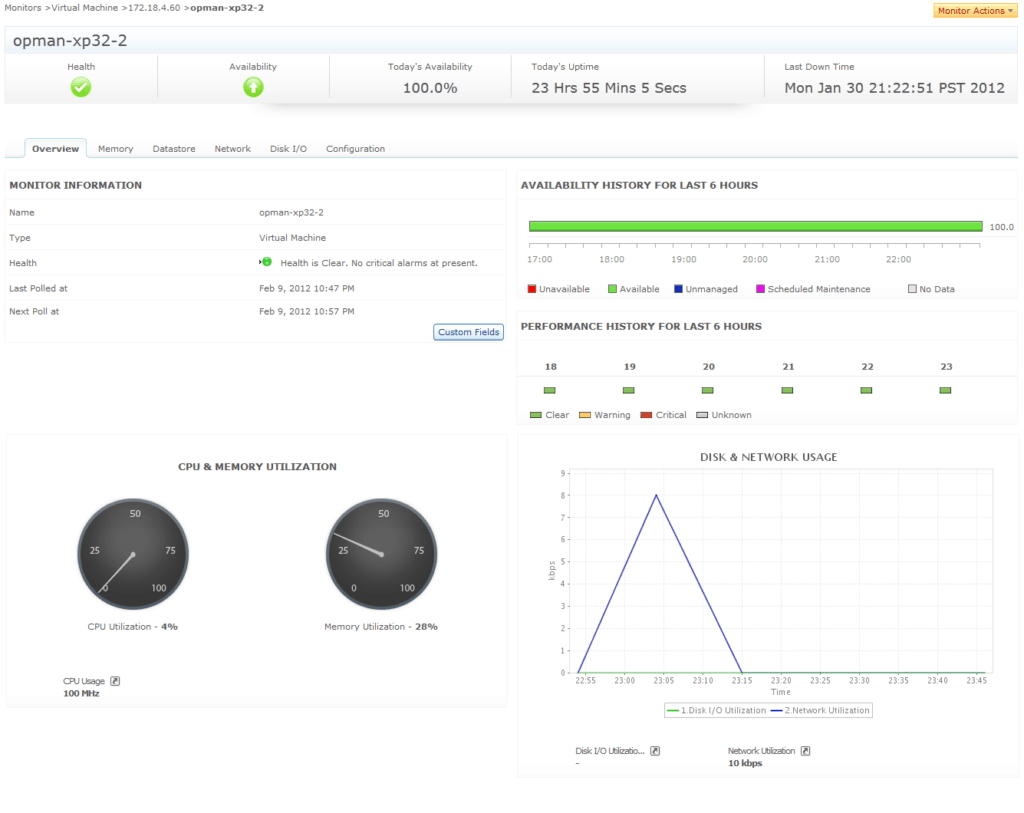
ManageEngine OpManager monitors networks and servers, and also some applications, such as Active Directory and web and email servers. Within this bundle of monitoring services are modules for supervising the performance of virtualization implementations.
The OpManager system watches the activities of virtualizations, examining resource usage within the virtual infrastructure and also beneath it – looking at the resource availability of the host.
The service begins with a system sweep that discovers all devices connected to the network, including servers. It will then scan each server and spot any virtual environments. You will be prompted for access credentials and then OpManager will search through, recording each virtual server, its dependent VMs, and the virtual infrastructure that connects them together.
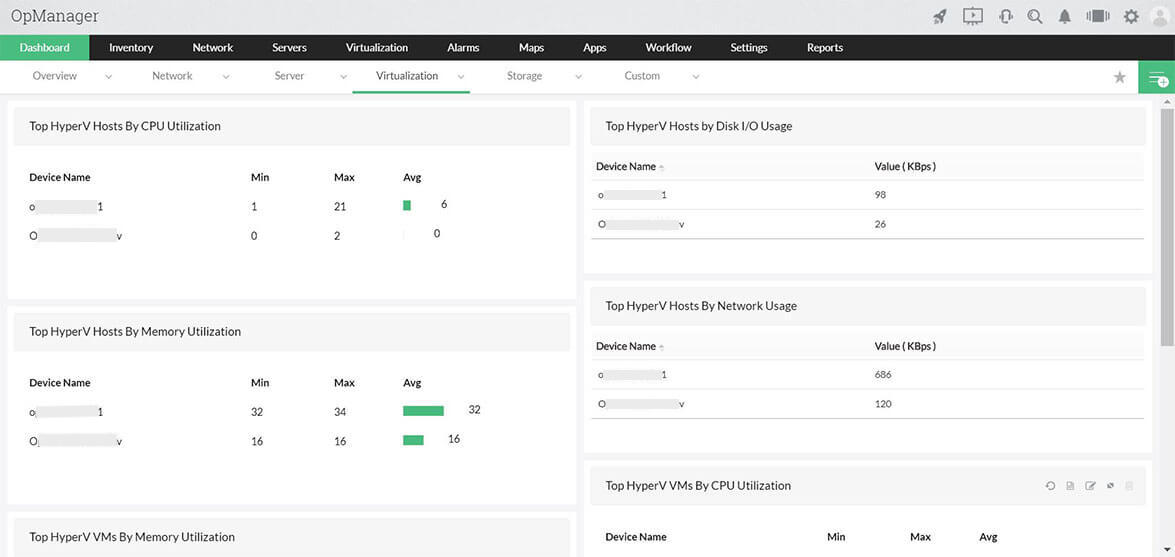
The service constantly monitors the allocation and availability of CPU, memory, and disk space within the virtual environment, logging the usage of these resources by each VM. It can aggregate reporting on all of your virtualizations, giving a path to click-through to each virtual server to see each of its VMs. This system displays the top resource users per virtual server and also system-wide.
The monitor also looks at server resource availability and how each virtualization interacts with them.
The virtualization systems that OpManager can monitor are:
- VMWare vShpere and ESXi
- Microsoft Hyper-V
- Citrix XenServer
- Nutanix HCI
The system places thresholds on each resource and will raise an alert if they are running low. These alerts can be forwarded to staff members by email or SMS.
Pros:
- Supports monitoring Hyper-V as well as bare metal environments
- Designed to work right away, features over 200 customizable widgets to build unique dashboards and reports
- Leverages autodiscover to find, inventory, and map new devices
- Integrates well with NOC or helpdesk products
- Supports email, SMS, and webhook for numerous alerting channels
Cons:
- Is a feature-rich tool that will require a time investment to properly learn
OpManager is available in four editions:
- Free for up to three devices — $0
- Standard starting at a price to monitor 10 devices — $245
- Professional starting at a price to monitor 10 devices — $345
- Enterprise starting at a price to monitor 250 devices — $11,545
ManageEngine OpManager installs on Windows Server or Linux. Get a 30-day free trial.
3. Site24x7 VM Monitoring – FREE TRIAL
Site24x7 Infrastructure covers networks, servers, and applications and it is a cloud-based monitoring service. The ethos of the infrastructure system is to work out the interdependencies between applications and the server resources that underpin each application stack. The system applies that same approach to VM monitoring.
The Site24x7 Infrastructure VM monitoring service watches over the mapping between VMs and servers and then looks beneath the hypervisor to work out how much system resources the virtualization is occupying.
This monitor watches over VMWare and Hyper-V hypervisors and Docker containers. It is also able to monitor the Nutanix hyper-converged infrastructure system.
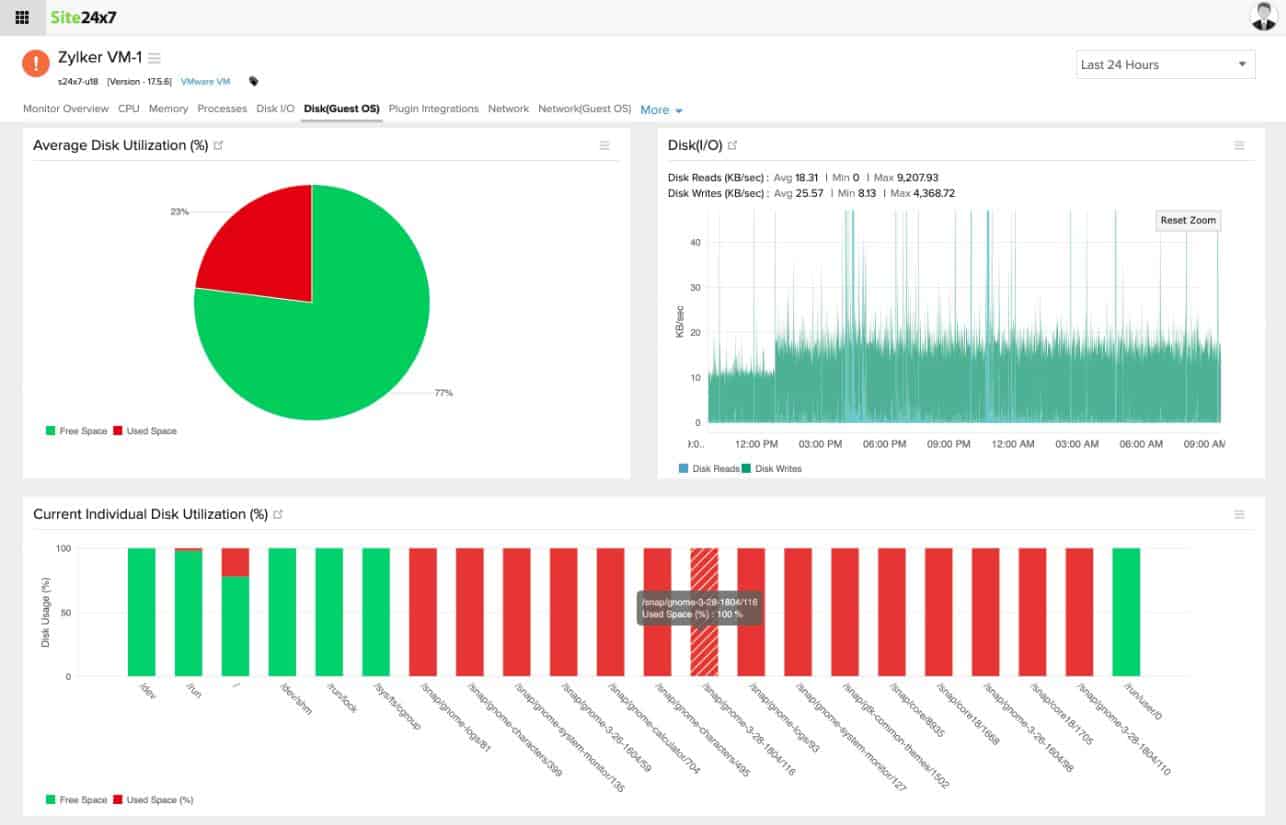
The activities of all of these elements are shown live in the dashboard. The console for Site24x7 is resident in the Cloud and can be accessed through any standard browser. The screens for the VM monitoring service can all be customized by the user.
Some metrics that the tool can keep an eye on are:
- Hypervisor server activity
- CPU and disk utilization on the server
- Memory allocation and usage
- Disk access and usage
- Network and virtual network activity
Pros:
- Offers out-of-the-box dashboards and monitors for Hyper-V environments
- Uses real-time data to discover devices and build charts, network maps, and inventory reports
- Supports monitoring clusters, VMs, and host hardware for complete visibility into your operations
- Supports a freeware version – great for in-depth testing and small businesses
Cons:
- Is a very detailed platform that will require time to fully learn all of its features and options
The base package of Site24x7 Infrastructure costs $9 per month when paid for annually. Get a 30-day free trial.
4. Paessler PRTG Network Monitor – FREE TRIAL
Paessler PRTG Network Monitor is a complete network, server, and application monitoring solution.
Some of the PRTG sensors that can keep track of the VM performance:
- Virtual Servers Sensors
- Citrix XenServer Virtual Machine sensor
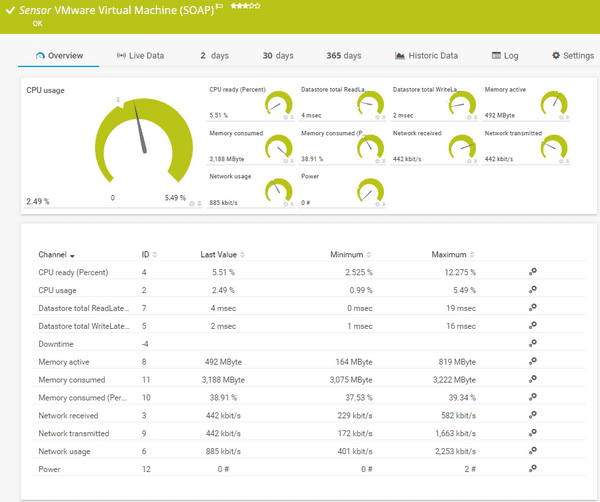
- VMware Virtual Machine (SOAP) sensor
- Citrix XenServer Virtual Machine sensor
- Hyper-V Virtual Machine sensor
- VMware Virtual Machine (SOAP) sensor
- And more.
This tool can monitor your entire IT infrastructure, from virtual, network, servers, storage, cloud, to traffic analysis, and more.
PRTG works based on sensors, which are a single monitoring unit that can keep track of a single component in a device or the entire
With PRTG sensors, you can monitor VMs from inside and outside.
- From outside: PRTG can monitor performance counters for multiple VMs running in a host server. Monitoring VMs that are impacting the network can help improve the overall performance. When a particular VM reaches its capacity, PRTG will send you an alert. Out of the box, you can monitor different VM platforms such as VMware, Hyper-V, and Citrix XenServer.
- From Inside: With PRTG, you can also monitor a single VM with sensors like WMI, SSH, SNMP, etc. You can keep track of the operating systems within a single VM, but PRTG advice not to overdo inside monitoring, because sensors like WMI can produce high loads and traffic.
Since PRTG is a comprehensive monitoring tool, you can also keep track of the performance on the network, the host, and even VMs deployed in the cloud.
With PRTG, you can set your performance threshold values that activate the alarms.
You can see the alerts as warnings on the dashboard, or configure them to be sent to your email, SMS, or API.
Pros:
- Designed specifically for Windows Server and Hyper-V environments
- Drag and drop editor makes it easy to build custom views and reports
- Numerous pre-built and custom sensor templates for monitoring beyond Hyper-V platforms
- Supports a robust freeware version
Cons:
- Is a very comprehensive platform with many features and moving parts that require time to learn
The price for PRTG depends on the number of sensors. The basic license starts at $1,330 for PRTG500, which allows up to 500 monitoring sensors. Free PRTG100 for 100 sensors for unlimited time and start monitoring VM performance today.
5. SentryOne SQL Sentry – FREE TRIAL
SentryOne SQL Sentry is a performance monitor for SQL Server and it also monitors the activity of the underlying services, including virtualizations. This system provides full monitoring services for Hyper-V and VMWare. It is also able to monitor Amazon and Azure platform performance where they support your SQL Server instances.
This monitoring system records activity in virtual machines, their virtual hosts, and the interactions between them. The service also monitors the operating system and the activities of the supporting physical server.
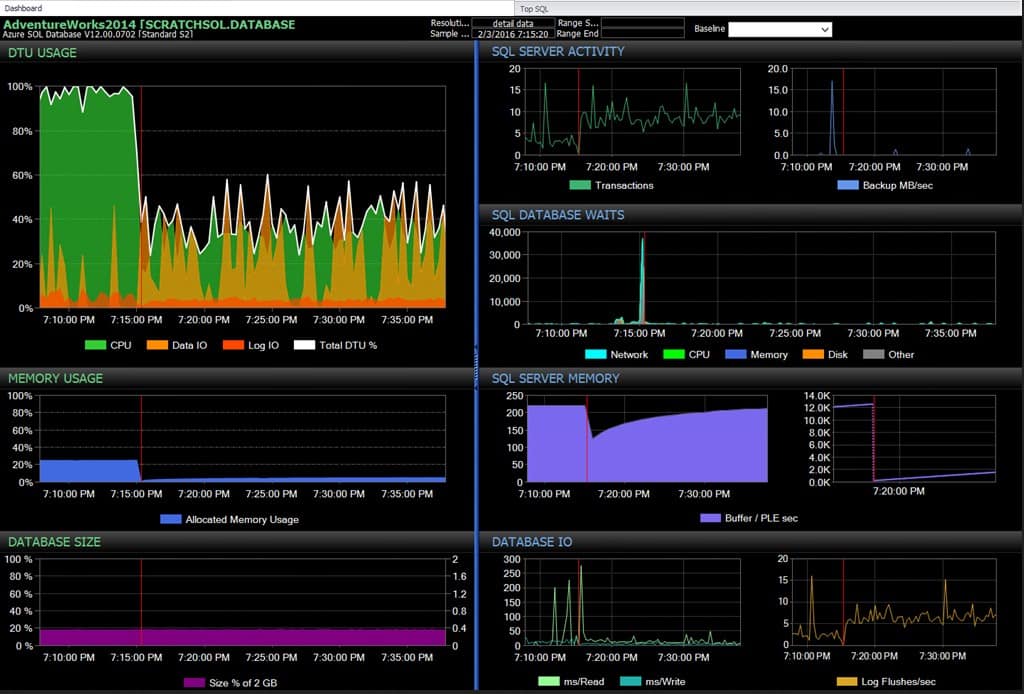
The dashboard for SQL Sentry has a special screen for VM monitoring. This shows a collection of graphs, each tracking a specific performance metric for a VM. The live statistics that these graphs show relate to the CPU, memory, and disk I/O access for that VM.
As well as providing live performance tracking, the SQL Sentry package includes analytical functions. You can access stored performance data in two ways. These are Sample mode and History mode. The Sample mode service lets you pick a point in time and see a snapshot of operations at that moment. The History mode offers a time series view that is very similar to the live dashboard, except that the data shown in the graphs relate to a period that you chose.
SentryOne SQL Sentry is offered in two versions. The first of these is a software package for installation on Windows Server. The other is as an Azure service.
Pros:
- Great fit for those looking to monitor Hyper-V systems and databases performance in one solution
- 100+ alerts and templates customized around SQL server health monitoring
- Supports root cause analysis for faster resolution times
- Supports a wide range of integrations for logging and PSA
Cons:
- Those who don’t need database monitoring may not use all features SentryOne has to offer
Contact the SentryOne sales team for a quote. You can get a 14-day free trial of the on-premises version of SQL Sentry.
6. ManageEngine Applications Manager – FREE TRIAL
ManageEngine Applications Manager is a server and application monitoring platform. The software provides full visibility of the entire application stack and helps you fix issues caused by hardware, OS, applications, or services. It also keeps an eye on the performance of the whole underlying infrastructure, whether it is located on-premises, cloud, virtual, or in hybrid environments.
Applications Manager provides end-to-end monitoring of the following virtual platforms:
- VMware ESX/Esxi, vCenter, and Horizon View
- Citrix XenApp and XenServer
- Microsoft Hyper-V
With Applications Manager, you can also get resource utilization of your virtual environment and some insights into capacity planning.
Some metrics that the tool can keep an eye on:
- Hypervisor CPU Usage.
- CPU and disk utilization on the server.
- Memory Usage.
- Datastore.
- Networking and Virtual Network Statistics.
Pros:
- Offers on-premise and cloud deployment options, giving companies more choices for install
- Can highlight interdependencies between applications to map out how performance issues can impact businesses operations
- Offers log monitoring to track metrics like memory usage, disk IO, and cache status, providing a holistic view into your database health
- Can automatically detect databases, server hardware, and devices for real-time asset management
Cons:
- Can take time to fully explore all features and options available
The software comes in three priced versions, Enterprise, Professional, and Free. The starting price for an annual subscription to the Professional License (for 25 monitors), starts at $945. Enterprise/Professional Application Manager has a Free trial 30-day Trial!
7. IntelliMagic Vision
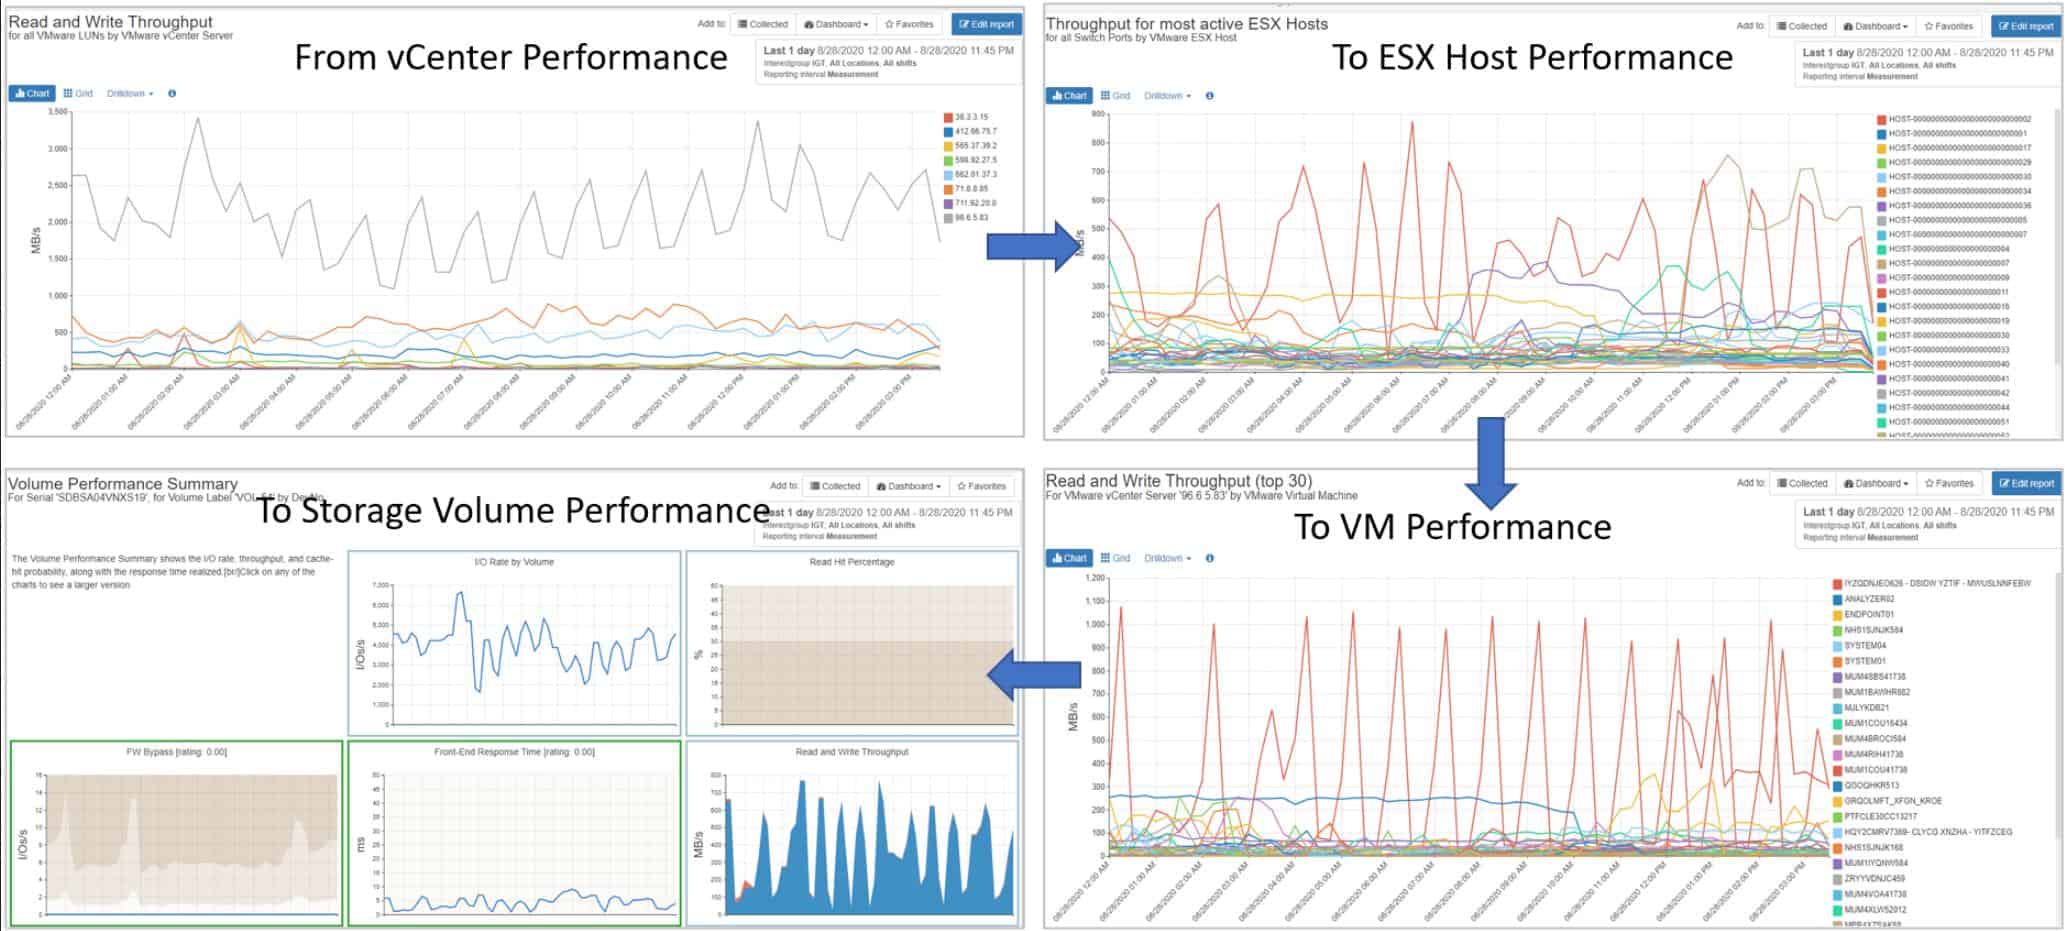
IntelliMagic Vision offers a unified monitoring system for VMWare virtualizations through to virtual storage systems, such as NAS and SAN configurations. This AI-based monitoring service solves the issue of monitoring different services that are supplied by different vendors. You will have no more problems in seeing through the connections between VMWare virtualizations and storage fabrics.
This monitoring solution examines all of the virtual stack of the VMWare implementation and skates through ton the virtual systems imposing a structure on your storage landscape. Both virtual systems are also supported by physical resources and IntelliMagic Vision can drill through to that substructure as well.
The monitor maps all VMs to hosts and then assesses their resource usage. The service keeps hold of the VMs as automated allocation processes in your VMWare implementation resizes them or remaps them to other virtual servers. The link through to your storage fabric also constantly assesses resource usage. The monitor watches the virtual storage representation as seen by VMWare. You can then dive underneath to look at how the SAN or NAS is implemented.
All of the virtualizations for processors and storage float on top of physical resources. IntelliMagic Vision watches those assets as well. You can get assessments on virtualization configurations to fine-tune your setup and the monitor will also raise an alert if resources look as though they are running out.
The virtualization systems that IntelliMagic Vision can monitor are:
- IBM Spectrum Virtualize, SVC, and Storwize
- VMware
- Pure FlashArray
- HPE 3PAR StoreServ Storage
- Hitachi Enterprise Storage Performance (VSP, G-Series, F-Series, HUSVM)
- Infinidat Storage
- NetApp FAS
- Any SAN fabric
IntelliMagic offers its Vision system in two formats. One is a SaaS platform and the other is an on-premises software package that installs on top of a hypervisor as a virtual appliance.
Pros:
- Highly customizable admin dashboard
- Can coordinate storage activities across your environment
- Leverages AI to aid in capacity planning
- Great for tracking and monitoring VMs at scale
Cons:
- Better suited for enterprises and data centers
Contact the Sales Department to get a quote. Request a free demo of IntelliMagic Vision.
8. Veeam One
Veeam One is a unified monitoring and analytics platform for cloud, virtual, and physical infrastructure.
The Veeam One software is also a robust platform on Backup & Recovery, cloud mobility, and data management.
For virtualization, Veeam One can provide intelligent monitoring, reporting, and automation for VMware vSphere and Microsoft Hyper-V.
The software can keep track of the entire virtual infrastructure, from the host, VM, local storage, SMB share, to the cluster shared.
It can show you outside and inside VM information.
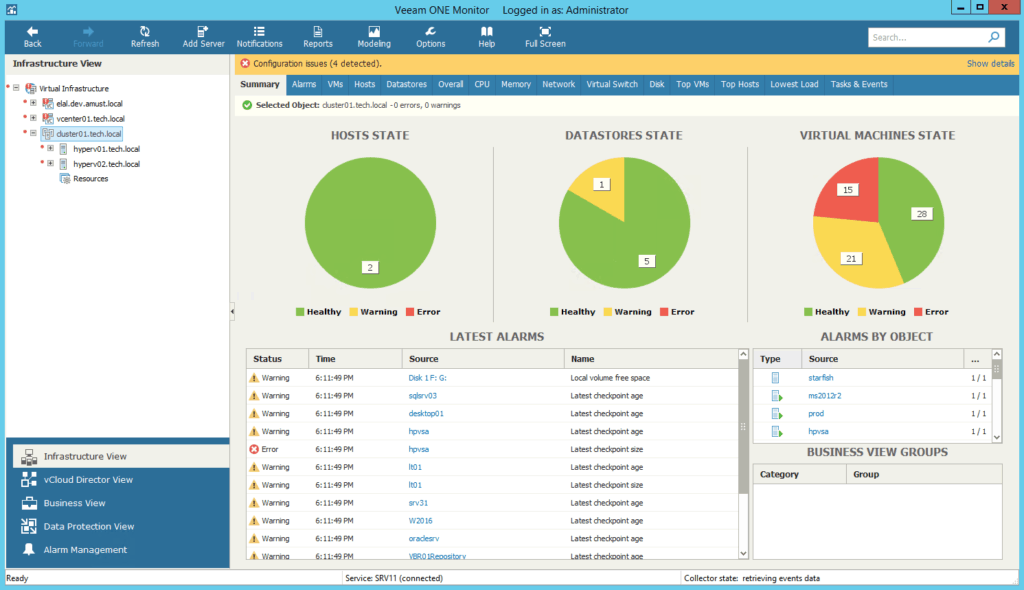
- Outside Information: The host dashboard shows the health and performance of your host and VMs. It displays the information from the datastore and the VMs state. It also shows system utilization and network resources of the VM host and related alarms. Other useful dashboards are local and external storage.
- Inside Information: The VM dashboard shows the health and performance of each VM. It can also show local CPU and memory usage and display warnings and errors.
VeeamOne comes with a comprehensive alarm and reporting system. With its timely notifications, you can avoid downtime and failures from business-critical applications running on VMs.
Pros:
- Easy to use for both technical and non-technical users
- Supports system-level recovery and backups
- Can run on Windows or Linux operating systems
- Ideal for small businesses and home users
Cons:
- Would like more integrations into more hardware storage and NAS solutions
The product comes in three different versions, Standard ($470), Enterprise($928), and Enterprise Plus ($1,390). The Veeam Availability Suite license includes a 3-year subscription in bundles of 10 instances. Download a fully-functional 30-day free Veeam One trial.
9. Opsview Virtualization Monitor
OpsView Monitor is a monitoring tool for IT infrastructure located on-premises, cloud, virtual, or in hybrid environments.
OpsView offers an integrated VMWare monitoring solution and host templates called Opspacks for monitoring Hyper-V, vSphere Guest and Host, and Docker monitoring.
For hypervisor performance monitoring, OpsView can keep track of VMware, Hyper-V, and KVM.
The software can also help establish the relationship between the hypervisor and the VM.
OpsView Monitor can be configured to collect metrics only from the hypervisor and get alerts when it finds a failure.
The automatic discovery feature can help you find VMs without human intervention, proceed to monitor them, and trigger alarms based on predefined thresholds.
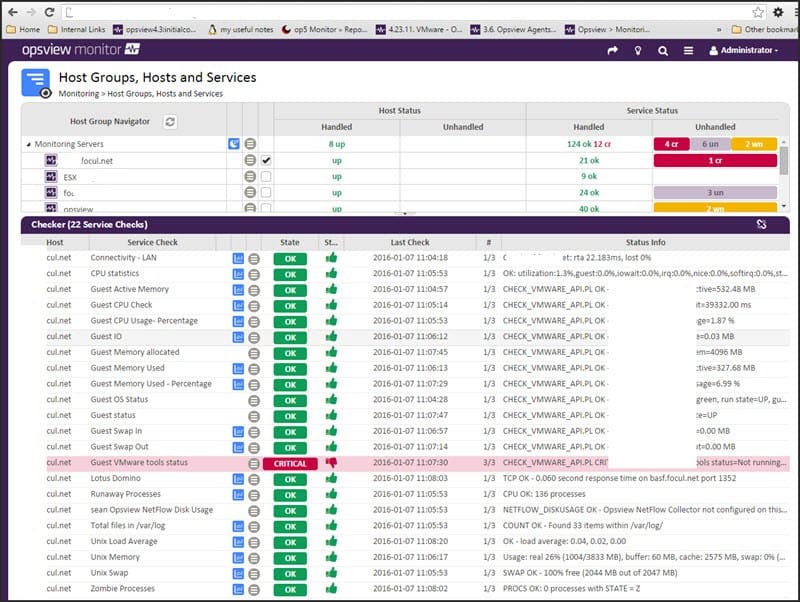
OpsView VMware monitoring and the Opspacks integrations allow you to monitor different performance metrics in the host, hypervisor, and VMs, such as:
- Host CPU, memory, and interface status.
- Datastore free space
- The VM guest status
- The R/W storage, including errors.
- And more.
Pros:
- Supports server, application, and cloud monitoring
- Monitors VMware, Hyper-V, and KVM hypervisors
- Supports a free and paid version
Cons:
- Only installs on Linux
OpsView Monitor is available in three different versions, Free, SMB, and Enterprise. The Free version allows you to monitor up to 25 hosts for free. The SMB software edition allows you to monitor up to 300 hosts. For more information on prices, get a quote. Get the free version of Opsview Monitor for unlimited time and monitor up to 25 hosts.
10. eG Enterprise
eG Enterprise is an IT infrastructure performance monitoring and management software.
With eG Enterprise, you can monitor your entire infrastructure located on-premises, cloud, virtual, and hybrid environments.
The software can automatically monitor, diagnose, and report so that you can troubleshoot application and virtualization bottlenecks.
eG Enterprise can monitor and manage your entire virtual environment, from the hardware resources, VM, to the applications.
The tool can keep an eye on more than ten virtualization platforms.
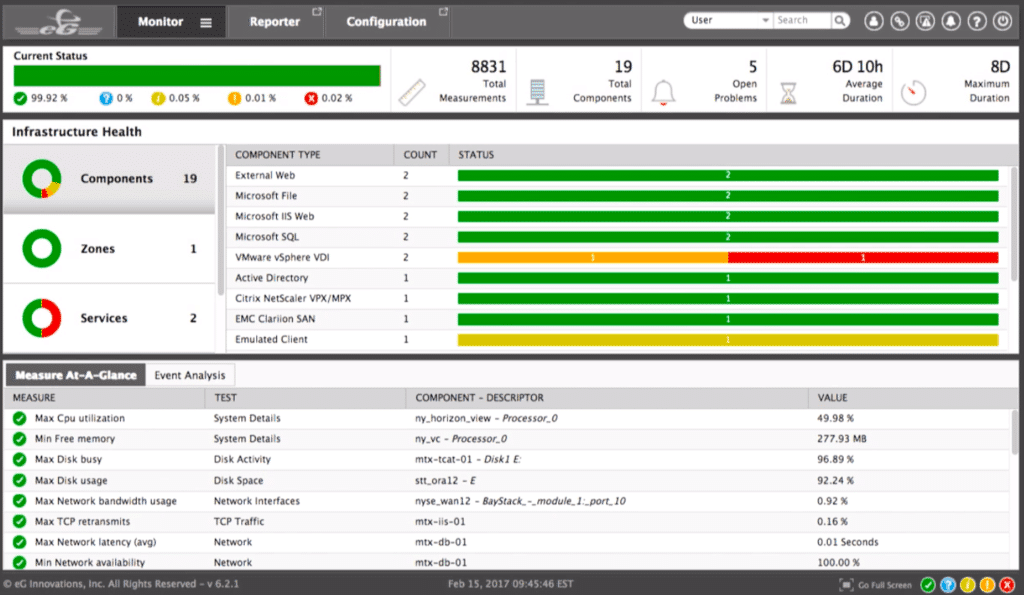
- Monitoring Servers: Watch for metrics like network status, CPU and memory utilization, disk space, and hardware health.
- Monitoring Hypervisors: Keep track of hypervisors like Citrix XenServer, VMware vSphere, and Oracle VM Server. eG Enterprise can monitor the performance and health of the hypervisor, the underlying hardware, and the status of each VM.
- Monitoring VMs and virtual Desktops: Watch desktops such as Citrix XenDesktop and VMware Horizon without the need of an agent. You can monitor resource utilization, top consuming processes, and user experience information.
Pros:
- Can monitor a wide range of virtual host environments, making this truly suited for larger enterprises or MSPs
- Threshold-based altering can notify when VMs go offline, or become slow due to resource-related issues
- Offers root-cause analysis to help technicans solve issues faster, resulting in more uptime
Cons:
- No freeware version
- The interface could be updated to be more modern
eG Enterprise comes in five different versions, Easy Evaluation, Perpetual License, Subscription, SaaS, and Audit Service. The licenses are based on the number of servers. For more information on pricing, request a quote. Free trial of eG Enterprise available.
11. LogicMonitor
LogicMonitor is a hybrid infrastructure monitoring and analytics software.
It can help you monitor the performance and health of your entire IT infrastructure located on-premises, cloud, virtual, or in hybrid environments.
The tool is capable of automatically collecting performance data from more than 1500 integrations, from network, server, virtualization, storage, cloud, and more.
LogicMonitor can help you monitor the following virtual platforms:
- Citrix XenServer.
- Hyper-V.
- V-Center.
- VMware.
The software uses an auto-discovery feature to scan the network, add devices, and start monitoring performance metrics.
Just enter the hostname or IP of the VM server, and LogicMonitor will discover all VM infrastructure.
LogicMonitor can keep track of different performance metrics on these virtual platforms.
When it detects a failure, an alert will be triggered based on the predefined threshold.
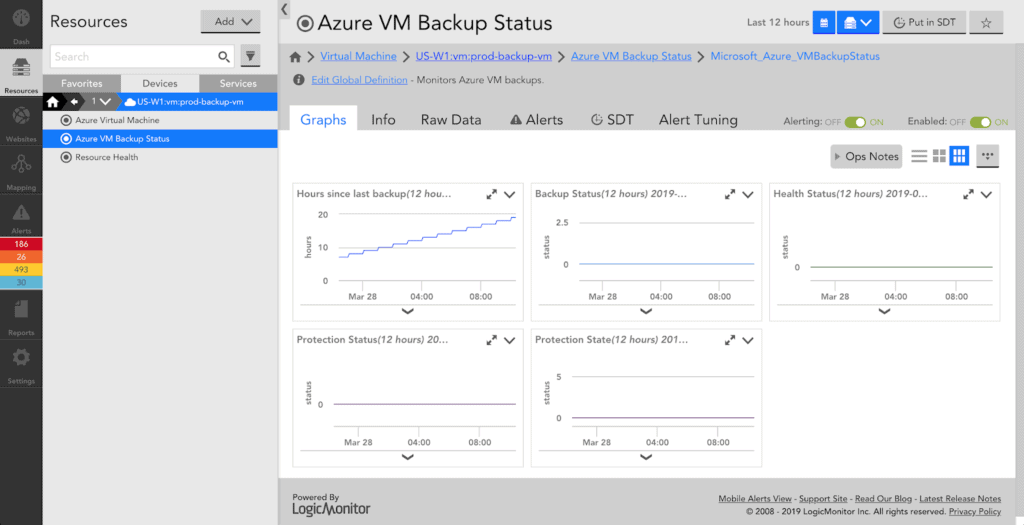
The software allows you to monitor:
- VMs (including interfaces, disks, and memory)
- VM Configuration
- Servers (including interfaces, CPUs, and memory)
- Hypervisors.
- Storage: Datastore, Clusters, NAS, etc.
- State of the resource pool.
- Virtual network adapters
- Snapshot operations
Pros:
- Highly visual interface, great for NOCs and big screen monitoring
- Supports multiple host environments such as ESX, ESXi, and vCenter
- Pricing is flexible, and available in three versions
Cons:
- Would like to see a longer 30-day trial
There are three different pricing plans, Starter (starting at $15 per device/month), Pro (starting at $18 per device/month), and Enterprise (starting at $20 per device/month). For more information on pricing, get a quote. A 14-day Free trial of LogicMonitor available.
Summary
There are lots of VM monitoring tools out there. In this product review, we only highlighted the best. Some are all-in-one monitoring tools, that can provide a wide range of information of the entire infrastructure. These tools can help you connect the dots and fix issues that might be indirectly affecting the performance of your VMs.
Some other tools are dedicated to VM performance monitoring. These can be helpful, as most of them are simple to use and can provide quick and accurate information. But which one do you need? The answer will depend on your current infrastructure and your monitoring scope.
The good thing is that you can start testing some of these products today. All of these tools offer freeware or at least free trials.
VM Performance Monitoring FAQs
What are some common metrics used in VM performance monitoring?
Some common metrics used in VM performance monitoring include CPU utilization, memory usage, disk I/O, network traffic, and response time.
How does VM performance monitoring differ from physical server monitoring?
VM performance monitoring is similar to physical server monitoring, but it also includes the monitoring of virtualized components, such as virtual switches and storage, in addition to the underlying physical resources.
What are some best practices for VM performance monitoring?
Some best practices for VM performance monitoring include regular monitoring of key performance metrics, using baselines to identify performance anomalies, setting up alerts for critical performance thresholds, and regularly reviewing performance reports.

