
Our funding comes from our readers, and we may earn a commission if you make a purchase through the links on our website.
SolarWinds ipMonitor Review
UPDATED: July 7, 2023
Get greater insight into this robust and reliable infrastructure monitoring tool with this in-depth review.
Monitoring the various aspects of your network becomes increasingly important as you add more critical components to your infrastructure. While remediation systems, ticketing tools, and all manner of admin support tools are vital—all of them rely upon one simple truth: you cannot support something that you cannot observe. This is where networking and application monitoring tools come into play.
SolarWinds are renowned for producing reliable, functional, and highly supported net admin tools for a gargantuan number of different specifics IT needs. One of their products is the ipMonitor, an agentless monitoring tool designed to sit in the background of your network and simply do its job: let you observe your network in action.
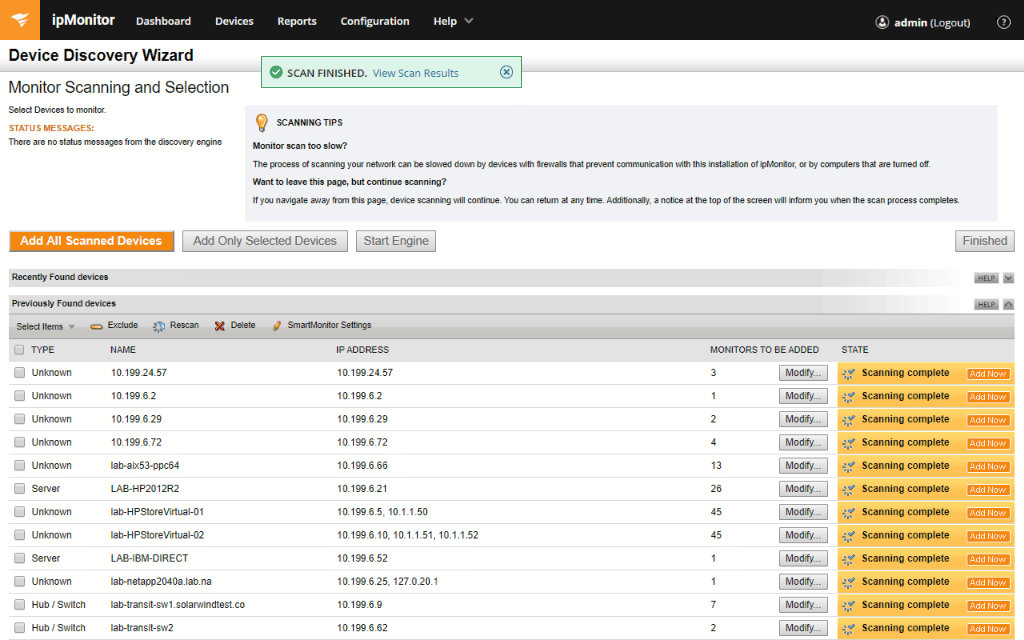
The agentless Discovery Wizard in SolarWinds ipMonitor allows you to quickly identify the services you want to monitor. Simply enter or modify the service's hostname or IP address to add a new device. Then, using your ipMonitor dashboard's Devices page, you may add discoverable devices to your list of active monitors.
In addition to network monitoring, the tool allows you to collect data on various Windows-based products. Windows programs and services are the foundation of your end-user experience for organizations that run on a Windows operating system. Services are available 24 hours a day, seven days a week to maintain effective web-layer performance and to avoid downtime. Although your users may never engage with these services, their health is critical to a productive IT environment. All of this means that windows application monitoring is a vital tool for providing the best possible user experience.
Network Monitoring
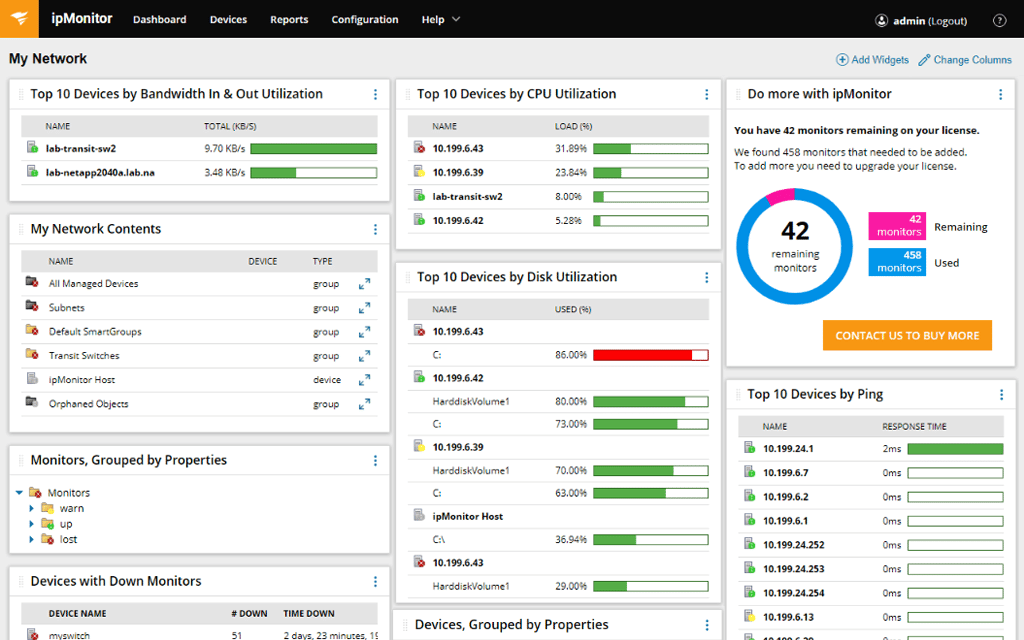
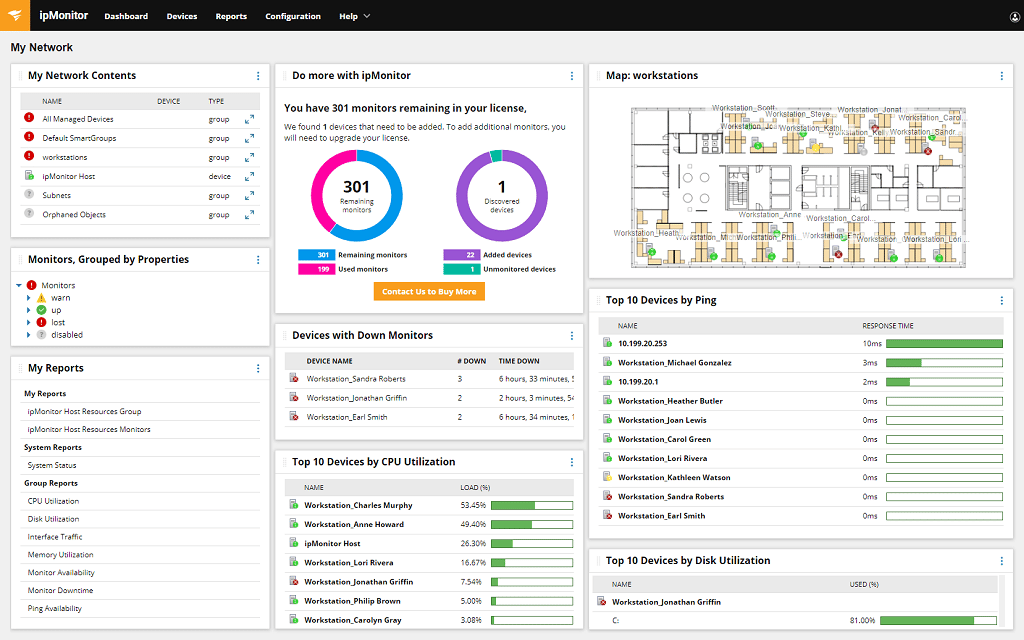
ipMonitor provides a completely agentless monitoring solution that enables you to keep a check on traffic and endpoint data throughout your networks, servers, virtual environments, and even applications. Setup is facilitated through a very straightforward web-server installation and database integration, it can also be configured to intelligently auto-detect new devices on the network, and responsively update data maps and other monitoring keys with newly identified endpoints. The lightweight nature of ipMonitor means it is always a suitable option for your monitoring demands, regardless of the scale of your business requirements.
You can use SolarWinds ipMonitor using SNMP to track the performance of your SNMP-connected devices. The SNMP Trap Monitor does not poll resources at regular intervals, but instead listens for incoming SNMP traps and tests the data it gets. This means you may examine real-time SNMP performance measurements from your central dashboard using the solution, while also being able to test an SNMP agent's capacity to react to an information request and level of responsiveness using the lightweight SNMP Monitor.
The solution also comes equipped with several integrative hardware monitors. These include the Battery Monitor, which checks the charge remaining in a battery to provide an accurate view of battery health and current operational conditions. The Fan Monitor, which retrieves a fan's current state, allows you to confirm that fans are functioning within safe limits. The Humidity Monitor, which retrieves and analyzes the response from a humidity sensor to measure humidity levels in a given area, is critical since high humidity causes corrosion and low humidity generates static electricity. Finally, the Temperature Monitor is designed to collect and analyze the response from a temperature sensor to measure temperature levels in a specified region, which has safety and performance consequences.
The Bandwidth Monitor measures the quantity of inbound and outbound traffic as well as the link state of a specified network interface, whether it be a local or remote machine or another SNMP-enabled device, using RPC or SNMP. This is handy for identifying high bandwidth usage or alerting when usage exceeds predefined thresholds.
Performance & User Metric Monitoring
SolarWinds ipMonitor goes beyond monitoring the simple network fundamentals and provides you with the ability to dig deep into your data and extrapolate a variety of other helpful metrics. This includes a variety of user-based graphs, such as performance impact, and abstracted data that indicates the quality of the overall user experience. You can easily set up monitors in ipMonitor to provide performance insight into web servers and email servers, increasing visibility into elements critical to user experience.
Monitoring specifications include the DNS User Experience, which allows you to test a primary and/or secondary DNS server's ability to reply to a record query. Other user experience-based monitors include the FTP User Experience, which can be used to evaluate an FTP server's capacity to accept incoming connections, process user logins, and finally, send the requested file. Alternatively, the HTTP User Experience can be monitored to evaluate a web server's capacity to accept incoming sessions and send a requested resource, such as a web page or the output of a CGI script.
By using database availability monitoring, you can verify your databases regularly to guarantee that programs and webpages have uninterrupted access to the data they require. Manually executing strict testing with rigorous checks can take a significant amount of time, which is where ipMonitor can drastically cut down on your testing demands. The solution includes many database availability monitors to assist you in ensuring continuous database availability. These database availability monitors may run queries, collect data, and evaluate the results from SQL Servers to ensure that everything is functioning properly.
Additionally, the SQL Query user experience monitor connects to a SQL Server or other supported sources, runs a query, obtains data, and validates the results. This monitor can be created using a wizard designed to test parameters along the way to verify the monitor works as expected in a production environment. Meanwhile, the SQL Server Monitor connects to any specified Microsoft SQL Server and performs subsystem performance tests to determine the server's overall health. This provides you with the ability to quickly identify the worst-performing subsystem, pinpoint failure points, and intervene before an outage happens.
Application & Service Monitoring
ipMonitor also includes comprehensive tools to integrate the service with a variety of applications and services. The product provides round-the-clock Windows application monitoring to help you uncover performance issues in critical services and save downtime and covers the following Windows application and service monitoring parameters: Active Directory, File Directory, Drive Space, Event Log, File Property, and Watching, Kerberos 5, MAPI User Experience, SQL Server, and Windows WMI.
SolarWinds ipMonitor offers a Downtime Simulator for testing monitors before implementing them, which allows you to thoroughly understand how to use each monitor to develop an efficient Windows service monitoring strategy. The Downtime Simulator can simulate service failures and issue test alerts based on your own setup. Navigating a synthetic failure will assist guarantee you know what to do if a service has performance issues. Custom templates may be quickly created for everything you need to monitor and alert on, from custom apps and infrastructure components to IoT devices and modern web-based applications. Get support for multi-vendor applications right out of the box.
Unfortunately, while SolarWinds ipMonitor does come with an included API to allow you to integrate your own bespoke applications and services into the system— the system wasn’t truly designed for this level of monitoring. You can employ robust SAM API pollers, to use a range of protocols and techniques, including PowerShell, WMI, SNMP, and REST APIs, and now with 10X the metrics per poller. However, something like the SolarWinds Server and Application Monitor may be a better choice if this is a feature you are looking for. Instead, application and service monitoring comes as more of a bonus feature that uplifts an otherwise network-focused product with other functionality.
Customizability
SolarWinds ipMonitor is designed from the ground up to be intended for straightforward implementation and use. The product is built to be a self-contained solution, with a built-in database and web server to assist deliver the functionality and data integrity you require, while also avoiding the headache and expense of third-party acquisitions. Furthermore, the secure, web-based interface allows you to check on your network, adjust monitors, and resolve issues from any location with an internet connection.
The dashboard is where the true customizability of the solution shines through. Each widget of the dashboard can be completely changed, with new graphs swapped in for shifting network monitors. As a lightweight network monitor built for rapid insight, the centralized NOC dashboard means you can customize the view by dragging and dropping elements. Use this feature to see which devices, servers, or apps are experiencing issues with availability or performance, and rapidly drill down on problems. Notification alerts and automated remediation parameters (discussed later) take this level of customizability even further, with expansive options for both.
The SolarWinds ipMonitor guided configuration process is intended to make configuring a new monitor easier. To begin, the Startup Wizard can guide you through agentless discovery for a variety of on-premises and virtual services. Using specialized configuration wizards for your various services, you may also configure your new monitor with minimal input. You can add and edit monitors, as well as attach multiple monitors to the same device, from the configuration tab on your ipMonitor dashboard.
Each of your monitors can also be enhanced with directly clickable widgets, allowing your team to immediately drill down into the information for better insight on additional metrics. From the Add Widgets tab on your main dashboard, you can organize your widgets into categories and get updated data reports for each service, and you can simply select a monitor from your Edit Monitor menu to check color-coded service status. These features go a long way towards expanding on personalizing the action workflow of your response teams, optimizing your service for your bespoke business needs.
Alerts & Remediation
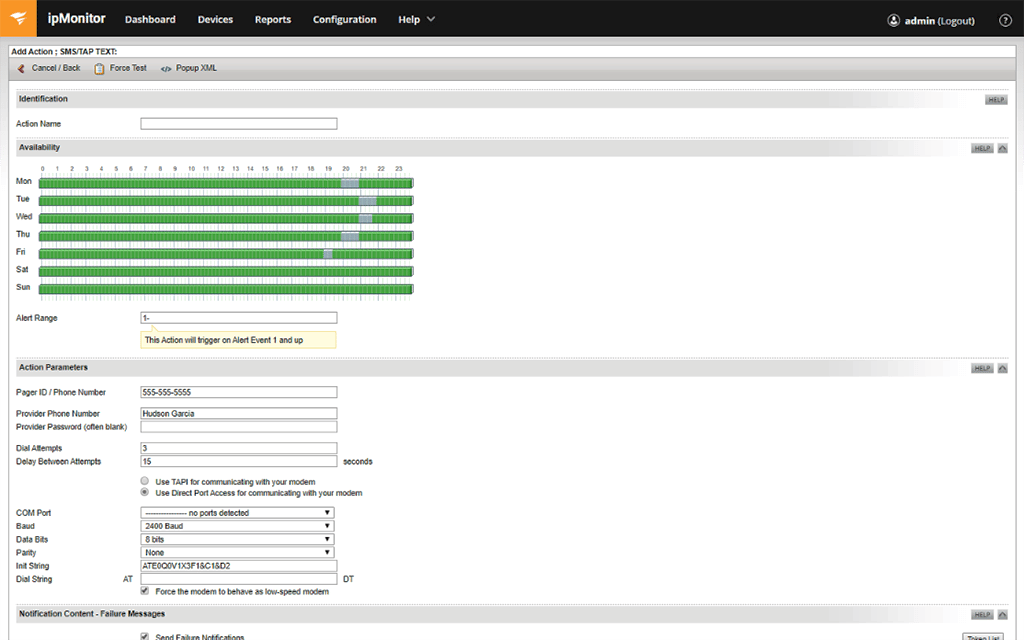
Establishing real-time alerting is critical for an efficient reaction to outages. You can receive highly customizable notifications sent straight to the inbox of your choosing with SolarWinds ipMonitor, whether it's a brief alarm by text message or email, or a thorough report via a Windows Event Log file.
You can easily identify the monitor reporting performance issues and address downtime before it affects your end-user experience with over 14 distinct sorts of notifications. ipMonitor contains a smart notification system that is designed to keep you informed on both important and non-threatening concerns. Alerts are also extremely customizable, with the ability to designate the essential performance criteria that generate notifications. You can choose whether to send notifications by SMS, email, or event log files, as well as which team members should be notified based on the issue category.
The solution also comes equipped with a variety of automated remediation systems. While these automated responses aren’t incredibly in-depth compared to other more specialized auto-remediation products, the ones that ipMonitor comes equipped with are especially useful for rapid response fixes. With ipMonitor, you can reduce downtime by automating remediation activities such as rebooting servers or restarting failed applications and Windows services. The product can also be used to quickly and automatically backup files, and run customized scripts. By automating remedial procedures to restore services if a breakdown occurs, you may avoid late-night calls and handle issues without your assistance.
The auto-remediation systems you configure are dependent on the metrics you assign during monitor configuration, which are the same parameters used to define alerts. Because the monitor passes the recovery parameters to the recovery alert, the alert can service many monitors using a credential that you establish when you configure the monitor. This effectively means a greater level of customizability when defining your monitoring metrics, and determining exactly how you want the system to automatically respond to anomalous, alarming, or generally unexpected data.
Reporting
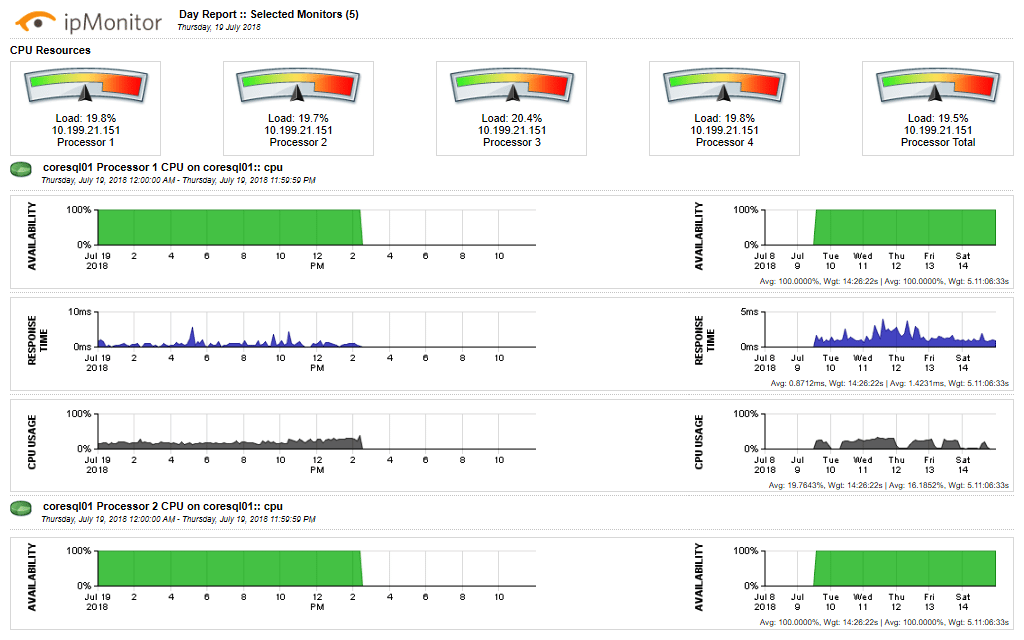
SolarWinds ipMonitor features the capability for creating customized reports that tie directly into the monitoring systems, with an equally in-depth level of customization available within your reported data. You can generate a customized report that leverages historical data to examine long-term and short-term performance patterns, identify problems, and report operational efficiency for each monitor and monitor group, in addition to presenting response time, uptime, and downtime for specified periods.
You can even drill down your reports for a specific device. Device reports show monitoring results for a single device (such as a router, server, or switch). It is worth noting that monitoring results for all devices in a group are displayed in group reports. When you run a device report, ipMonitor asks the device for the information you've specified and presents the findings in the application. Meanwhile, reports can also be used to extrapolate information about ipMonitor directly—this System Status report provides information about ipMonitor and the server that hosts the application for use in technical diagnosis and support.
Primarily, this means you can improve IT monitoring by utilizing built-in reports and dashboards. These systems allow you to monitor past performance data on customizable reports, with included scheduled email delivery. Another level of reporting provided are zoomable point-and-shoot reports, designed to allow you to view data for a specific period or event. Overall, comprehensive reporting tools are valuable for a variety of reasons, including determining the root cause of errors, providing long-term context for data trends, showing evidence of performance (good or bad), and even proving compliance for certification.
Trials & Pricing
SolarWinds provides a full 30-day free trial of the service, which is easily plenty of time to familiarize yourself with its features and integrate it with your services. This might not be enough time to write, test, and implement an API-driven connection with any of your bespoke services or applications. However, this is likely enough time to connect the service with your network infrastructure and perform testing—perhaps with simulated downtimes that have configured automated alerting and remediation.
ipMonitor is covered under a single-purchase license, the cost of which varies depending on the precise number of monitors that you need for your services. For 500 monitors, costs start at approximately $1570, increasing to $2620 for 1000 monitors, and $5770 for 2500 monitors. The rigorous nature of the pricing can be considered a downside when compared to many other products, particularly those that provide subscription-based services, where licensing costs are more exact to your flexible demands.
Conclusion
SolarWinds ipMonitor has a substantial amount of competition when it comes to monitoring and infrastructure monitoring, but it sticks true to its guns, which means the services are undoubtedly reliable. While most monitoring platforms have shifted to an SaaS model, ipMonitor remains a single purchase license—and while many monitoring solutions have frankly burdened their services with a slew of add-ons, ipMonitor sticks to the fundamentals. If you are looking for a solution that you can reliably integrate with your services, and then probably forget about while it does all the necessary work in the background, then ipMonitor is perfect for your needs.
It is also worth discussing SolarWinds themselves. ipMonitor can broadly integrate with several other SolarWinds products, meaning the viability of the product increases if you also happen to use other SolarWinds products. The company produces some of the most robust and widely-used products in basically all fields of IT/network administration, and this reputation is unquestionably well-earned. SolarWinds might not produce the most feature-rich, or modernized products in their respective markets, but you can always trust a SolarWinds product to do its job well and without issue.
When compared to a solution like LogicMonitor, it is evident that both products offer a plethora of capabilities. SolarWinds ipMonitor is available as a single license purchase with a 30-day free trial, therefore it is likely to be more expensive in the short term. Additionally, LogicMonitor outperforms ipMonitor in terms of the breadth of in-depth analysis tools available for gaining a deeper understanding of the acquired data. However, such an advantage comes at a higher cost in the long term. Because LogicMonitor is a cloud-based and mostly online service, it has a more extensive set of security measures, whereas SolarWinds ipMonitor is primarily concerned with the customizability of the core features. LogicMonitor's expenditures will likely outpace those of ipMonitor in the long run, owing to its SaaS business model.
The best thing to do is fairly obvious: Download the free trial, test it on your network, integrate it with some commonly used services, and give it a full try-out before any kind of commitment. Instead of purchasing the product straight through the website, consider contacting SolarWinds directly, as you may be able to negotiate a better deal that properly suits your business requirements. Before doing so, make sure you take the time to analyze your existing network infrastructure and make a rough list of the expected number of monitors you might need. Then, depending on how much you plan and scale upwards in the future, plan your final monitors total accordingly.

