
Our funding comes from our readers, and we may earn a commission if you make a purchase through the links on our website.
Operations Bridge vs Datadog
UPDATED: October 19, 2022
Performance Monitoring tools are one of the hot topics today, seeing that myriads of companies across the globe are heavily inclining towards them to monitor their tech stack and derive KPIs.
When it comes to monitoring your IT infrastructure, there are numerous tools in the market with various features and functionalities. Two such popular tools are Operations Bridge and Datadog.
This post will compare Operations Bridge vs. Datadog, so it will be easier for you to decide which one suits your business needs best.
What do Operations Bridge and Datadog do?
Operations Bridge monitors hybrid IT resources such as applications, services, OS, devices, VMs, or databases, and it applies AIOps to all types of data. As a result, it can proactively detect issues, reduce data noise and automate remediation faster before affecting customers. Plus, tool silos and collaboration between teams get easier with OpsBridge.
OpsBridge provides a single pane of glass for the health and performance of your IT resources, offering better visibility to Operations and Monitoring teams.
On the other hand, Datadog is a SaaS-based monitoring tool for your entire IT stack. It provides metrics, alerting, and visualizations to optimize the performance of your hybrid or multi-cloud environments.
Operations Bridge Product Highlights
Operations Bridge is an enterprise-ready hybrid IT monitoring tool that offers advanced multi-mode correlation to reduce events, improves RCA (Root Cause Analysis), and automatically executes remediation to reduce MTTR. It can monitor your entire IT environment and consolidate metrics, topology, and events from Micro Focus and other third-party data collectors. After this, it will leverage a dynamically advanced IT service model to employ advanced correlation across these metrics.
Key Features of Operations Bridge
- Automate Discovery and Monitoring allows Operations and Monitoring teams to see the impact and current health of various IT resources across On-Prem, public and private environments.
- Real-time visibility – With Business Value Dashboards (BVD), Operations Bridge provides a clear, bird’s eye view into real-time business KPIs. Business leaders can seamlessly collaborate and visualize with IT teams to get things done faster with these intuitive BVDs. In these tablet-ready dashboards, you can also get real-time monitoring and performance analytics to qualify trends by SMEs more quickly.
- Reporting – Reporting gets faster with the lightweight reporting functionality based on the BVD. OpsBridge also offers a detailed OBR (Operations Bridge Reporter) tool that generates reports and manages publication.
- AI-based Analytics – OpsBridge employs continuous real-time multi-mode correlation, multiple forms of analytics, automated event, log, and predictive analytics. What makes it the best is its common data management approach. OpsBridge uses Vertica-based COSO (collect once store once) technology which acts as a single data store for data ingestion and processing.
- Automated and Continuous Delivery – OpsBridge makes continuous discovery more precise and faster for your IT stack. It provides agents or lightweight/agentless sensors along with a few third-party collectors for automated discovery of topology information from your existing legacy systems. This discovered topology information is used to continuously build and update an IT model that supports your business services. RtSM- a dynamically updated IT model of OpsBridge is one of its unique functionalities.
- Automated Monitoring – It automatically drives infrastructure monitoring. It automatically detects any new composite application implementation or a new instance of an IT component and further automatically activates the best infrastructure management policies over it.
- Quick remediation – OpsBridge automates remediation with scripts or automating powerful runbooks with the help of Micro Focus® Operations Orchestration and its 8000 runbooks.
- AIOps – OpsBridge not only offers log, event, and metrics analytics but also comes with excellent AIOps analytics capabilities. It reduces events by leveraging topology-based, stream-based automatic ML correlation of event streams over time. You don’t need to write any rules as it is automated. Anomaly detection will proactively alert the teams of suspicious activity and derive critical insights from millions of records. It also proposes optimized recipes which you can use to visualize resources and dynamic workloads and forecast their allocation impact and costs to build the right services.
OpsBridge employs monitoring, log intelligence, predictive analytics, automated discovery, and remediation to business data across your multi-cloud, hybrid, private, public, and container-based environments. It automates ML-based AIOps with analytics to reduce events and accelerate remediation. In addition, key stakeholders can derive key insights on the mobile phones with custom dashboards depicting business and IT KPIs with key status.
Pros:
- Provides live visibility into your network, infrastructure, and assets
- Leverages AI to improve analytics and reduce false positives alerts
- Built for fast remediation – features over 8000 runbooks
- Best for MSPs and enterprise networks
Cons:
- Smaller organizations won’t use some of the multi-tenant features in the product
Operations Bridge is also called HPE Operations Bridge, HPE Ops Bridge, and Micro Focus Operations Bridge.
Datadog Product Highlights
Datadog is a SaaS-based infrastructure monitoring tool that offers robust metrics, visualizations, and alerting capabilities. It helps your IT teams optimize and maintain your hybrid or cloud environments.
Key Features of Datadog
- Hybrid Monitoring – Datadog can be deployed anywhere, including IoT, hybrid, On-Prem, and multi-cloud environments. Users get access to over 450+ vendor-supported integrations such as Kubernetes and other server-less platforms. In addition, with tag-based search and analytics, it gets easier to scrutinize complex infrastructures.
- ML-based alerting uses machine learning and tags to detect problems in your services, applications, and infrastructure. Thus, it reduces alert fatigue and automatically surfaces real issues from the noise. Every alert generated is contextual and actionable, no matter how complex the environment is. With native SLO and SLA tracking, you can prioritize and resolve more critical problems for your business.
- Unified visibility – Datadog unifies metrics into a single pane of glass for better visibility. It consolidates metrics from application traces, processes, or logs for visualization and alerting across your entire IT stack. In addition, it offers a fast one-click correlation of related logs, metrics, and traces across the environments, reducing miscommunications.
- Interactive Dashboards – With Datadog, you can build real-time interactive dashboards with high-resolution events and metrics for better graphing. Users can slice and dice data using tags, see real-time graphs across sources and easily customize views.
- Live Process Monitoring – This feature allows you to track the impact of every process running in the tech stack
- It offers HTTP REST API, which you can use to access the Datadog platform programmatically.
- Consolidates hundreds and thousands of infrastructure metrics right out of the box.
- With 15 months of metric retention, you can execute RCA (Root Cause Analysis) and post-mortems with historical records, even if the infrastructure doesn’t exist anymore.
Datadog supports an extensive range of modern technologies and has an easy UI to help you troubleshoot and collaborate more effectively.
Pros:
- Leverages machine learning to improve alerting, reporting, and queue management
- Excellent dashboards – great for solo admins or NOC teams
- Can easily see historic metrics as well as a live view of your IT assets
- Highly flexible – scales well across various environments
Cons:
- Would like to see a longer trial period for in depth testing
Feature Comparison of Operations Bridge vs. Datadog
| Features | Operations Bridge | Datadog |
|---|---|---|
| What is it | Automated Hybrid IT Discovery and Monitoring tool | SaaS-based Monitoring, Alerting and Data visualization tool |
| Platforms Supported | SaaS | SaaS |
| Dashboards | BVD (Business Value Dashboards) | Interactive out-of-the-box dashboards |
| Built-in Integrations | 200+ | 450+ |
| Alerting | Yes | Yes |
| Reporting | Yes | Yes |
| API access | Yes | Yes |
| Automated Remediation | Yes | - |
| AIOps Anomaly Detection | Yes | - |
| Event correlation | Yes | Yes |
| Support | - Business Hours - Call | - Chat - Phone only for Enterprise package |
| Training | - Webinars - On-demand training - Knowledge Base - Community - Use cases | - Documentation - Webinars - Training through Slack channel |
Operations Bridge vs Datadog Head-to-Head
User Interface
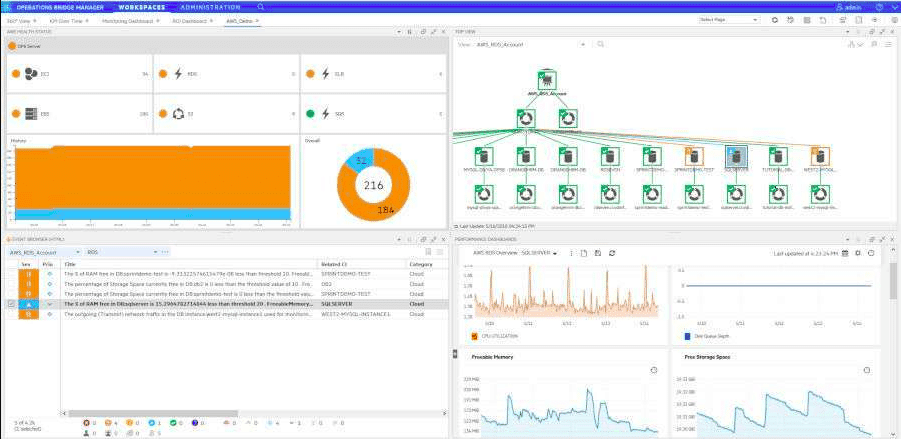
Operations Bridge is comparatively more complex than Datadog, making it less desirable for amateurs with no experience. It features Business Value Dashboards (BVD) that display KPI data and critical status from OpsBridge and other sources. It looks very TV-like, where BVD acts as a live channel that shows business and IT news. You can stream the BVDs on a tablet or any other popular device via a browser.
Datadog, on the other hand, has an intuitive user interface that can be used by anyone and does not need query language. Moreover, it has interactive, out-of-the-box dashboards with graphs that depict hundreds of real-time data sources such as EC2, Kubernetes, and so on. Besides, you can also create your custom dashboards. The user interface could still improve, though.
Monitoring Capabilities
Operations Bridge offers On-Prem and multi-cloud monitoring capabilities, which you can use to monitor traditional PaaS, IaaS, private and Kubernetes environments. It supports agent, agentless, and cloud API technologies to consolidate log data, metrics, events, and topology information from your hybrid stack. Apart from this, OpsBridge also offers application performance analytics monitoring to measure user experiences and get alerts on performance issues. In addition, it provides complete visibility into your applications across mobile devices, On-Prem, or cloud platforms.
OpsBridge employs automated discovery and monitoring of your entire tech stack, collecting all data types within a dynamically updated IT model. In addition, it will display the impact of events to make sure no service is overlooked.
Datadog offers SaaS-based infrastructure monitoring that features metrics, visualizations, and alerting capabilities to help you maintain your IT stack. It has over 450+ inbuilt integrations to enhance troubleshooting and collaboration abilities. You can deploy it anywhere, be it multi-cloud, hybrid, IoT, or On-Prem environment. Simply deploy and start monitoring your entire IT infrastructure without the need for comprehensive training. In addition, it features an ML-based tool to automatically detect real issues from the noise and reduce alert fatigue.
Datadog provides in-depth visibility into your IT infrastructure performance and tracks thousands of metrics out-of-the-box.
Installation
Micro Focus keeps releasing upgrades of their OpsBridge Suite frequently in the ITOM Practitioner portfolio, as the newer DevOps technologies keep evolving. Installing Operations Bridge is extremely easy using containerized technologies, as long as you follow the installation guide published in the ITOM portfolio. The installation process is divided into three steps viz. Plan, Prepare, and Install.
- The planning phase decides which OS you will be using to install your Operations Bridge software, and the choices are amongst a few Linux distributions. Besides, you will also have to plan for high availability techniques and decide on deployment mode.
- The preparation phase is the process of validating whether your systems meet the software and hardware requirements and are in sync with the deployment size. Then, use the systems created in the planning phase and configure the required resources to install containerized components.
- The installation phase will guide you through various steps to install, deploy and configure containerized components in your environment to deploy the OpsBridge suite.
Which Operations Bridge components are available to you entirely depends upon your license edition. Some components can be installed only in containerized mode, while others in non-containerized mode only.
More than one person must complete the installation process, and their respective roles are comprehensively explained in the guide.
Datadog installation is also very straightforward as it gets you up and running fast. First, you need to create a Datadog account and install the Agent on your desired OS platform, viz. CentOS, Ubuntu, Windows, and so on. If you run the Agent’s status command, the installation will begin. As Agent is deployed, it will automatically consolidate metrics, logs, and events from your IT stack and direct them towards Datadog.
Reports
Operations Bridge features unique BVD (Business Value Dashboards) that provide a TV-like view of your KPI data and IT status from all data sources. Moreover, OpsBridge offers design-driven reporting with which you can flexibly adjust the design of the out-of-the-box dashboards. Users can also tap into more than 1000 machine learning functions based on Micro Focus Vertica technology to change reports as per a well-defined public data schema.
As for Datadog, you can quickly use the Log Analytics API to create custom reports and dashboards unique to your team. This can be done by consolidating data from your business services along with log data. Plus, you can use the Datadog Reporter integration to schedule reports and email them out at specific intervals.
Plugins
Operations Bridge offers comprehensive visibility into your hybrid IT environment with over 200+ inbuilt tool integrations such as Oracle Enterprise Manager, AppDynamics, Microsoft SCOM, SAP Solution Manager, etc., without any rip and replacements approach. In addition, event and performance metrics can be viewed through a single pane of glass.
With over 450+ turn-key integrations, Datadog allows you to see right through the metrics and events of your apps, services, and systems.
OS Support
Operations Bridge supports Linux distributions viz. RedHat Enterprise Linux, Oracle Enterprise Linux, and CentOS platforms.
Datadog supports Windows and Linux distributions such as CentOS, Debian, Ubuntu, RedHat, etc.
Support
Operations Bridge provides call support and complete documentation, community support, Knowledge Base, and use cases.
Datadog offers support through Live Chat, email, and In-app Event Stream Messaging. It also has a comprehensive set of support resources such as documentation and guides.
Training
Operations Bridge offers training through on-demand webinars, certification programs, and instructor-led training.
Datadog offers training through webinars. It also has a Datadog Learning Center where you can find multiple training courses to avail. If you want to contact the Datadog team for an issue, you can get in touch with their Learning team via learn@datadoghq.com.
Cost
Operations Bridge Suite does not disclose the pricing details. Instead, you need to contact the Micro Focus Support Team for a pricing quotation.
Datadog Pricing is as follows:
- Free: $0 per host per month
- Pro: $15 per host per month
- Enterprise: $23 per host per month
Operations Bridge vs. Datadog: The Verdict
What makes Operations Bridge unique is its COSO approach, centralized Data Lake based on Micro Focus Vertica technology, hybrid IT monitoring capabilities, and AIOps technology that companies can leverage to handle complex hybrid IT stacks. Further, it also features exceptional automated discovery, monitoring, and remediation capabilities.
OpsBridge is the flagship product of Micro Focus for ITOM (IT Operations Management). It is a powerful solution for large enterprises that have complex monitoring and service quality demands. Its ML-based functionalities provide a solid foundation to gain complete visibility into the vulnerabilities and health across all your On-prem and cloud IT estate.
Datadog, on the other hand, has a comparatively simple user interface and easy-to-use functionalities. It serves as a perfect SaaS-based performance monitoring solution for companies looking for low-level investment software. Businesses can flexibly scale with Datadog as it offers numerous ML-based technologies for advanced monitoring capabilities. Most DevOps teams who work with dynamic or hybrid cloud IT estate prefer Datadog for its easy-to-use yet advanced functionalities.

