
Our funding comes from our readers, and we may earn a commission if you make a purchase through the links on our website.
NetApp Monitoring Software and Tools for the Best Management of your Devices
UPDATED: October 23, 2023
NetApp is strongly focused on storage hardware, its management software, and on data services for the clouds – we're going to cover NetApp Monitoring and see which programs can assist with monitor this critical infrastructure device. The storage devices are commonly used by large businesses to store and transfer large quantities of data across hybrid clouds.
The main types of hardware include hybrid cloud infrastructure and flash storage. Its storage systems can integrate with all leading cloud providers, and can also natively support VMware VSphere.
Here is our list of the top NetApp Monitoring tools:
- IntelliMagic Vision for SAN – EDITOR’S CHOICE This flexible SAN monitoring tool can monitor all major storage hardware arrays, including NetApp FAS system. This system provides AI-based performance analysis and alerting. Available as a cloud service. Request a free demo.
- SolarWinds NetApp Storage Performance Monitoring – FREE TRIAL This NetApp monitoring solution is part of the SolarWinds Resource Monitor and it covers an overview and detailed analysts of storage solution performance. Runs on Windows Server. Start a 30-day free trial.
- Site24x7 Network Monitoring – FREE TRIAL This cloud-based service provides device health checks plus traffic flow data for live monitoring and historic analysis. Start a 30-day free trial.
- ManageEngine ADAudit Plus – FREE TRIAL A file integrity monitoring tool that includes logging for NetApp files and CIFS. Available for Windows Server, Azure, and AWS. Start a 30-day free trial.
- PRTG NetApp Health Sensor – FREE TRIAL A collection of monitors for networks, servers, and applications that includes a sensor for NetApp environment monitoring. Runs on Windows Server. Start a 30-day free trial.
- NetApp Active IQ Unified Manager A monitoring solution for hybrid environments that can summarize and unify the monitoring of resources based on both the cloud and on premises. Available for Windows Server and Linux.
- Nagios Netapp Monitoring A monitoring system that is available in free and paid versions that has plugins to add on NetApp monitoring capabilities. Installs on Linux or over a hypervisor for Windows.
- LogicMonitor NetApp Monitoring A cloud-based service that can monitor physical and virtual resources no matter where they are located.
- Netwrix Auditor for NetApp A system monitor that is available in free and paid versions and is able to cover combinations of physical and virtual systems, including NetApp environments. Runs on Windows Server.
- OpsView Monitor An extensible monitoring system for applications and servers that includes a NetApp service monitoring extension. Available for Linux or as a cloud service.
The Best NetApp Monitoring Software and Tools
Our methodology for selecting NetApp monitoring tools
We reviewed the market for NetApp storage monitoring software and analyzed the options based on the following criteria:
- A package that can track the performance of the different NetApp storage configurations
- A solution that is able to coordinate the monitoring of clusters
- A system of alerts that track both demand and capacity availability
- Integration with the NetApp device operating system
- The ability to monitor storage devices on multiple sites plus cloud platforms
- A free trial or a demo package that lets you try before you buy
- Value for money from a monitoring package that squeezes cost savings from storage
In this post, we will review the following tools which will help you keep track of those NetApp resources.
1. IntelliMagic Vision for SAN – GET DEMO
IntelliMagic Vision for SAN includes the monitoring of NetApp environments in its SAN monitoring service. This monitoring system is able to unify the monitoring of services provided by many different vendors and make them manageable from one interface. This system can identify performance and resource issues and then analyze the causes of the problem and suggest solutions.
The system includes AI routines to calculate how complicated application and resource inter-dependencies can impact on resources, spotting when issues are probably going to arise, rather than waiting for the problem to occur. This buys you time to adjust resource allocations before they impact on performance.
Features and Capabilities
- Identifies all of the services contributing to a NetApp environment.
- Predicts resource requirements.
- Offers overview statistics plus drill down details for each service.
- Shows live statuses.
- Performance statistics per protocol.
- Space requirements forecasting.
- Analysis of SAN fabric paths.
IntelligMagic Vision is available as a virtual appliance over VMWare or as a cloud service.
Pros:
- Highly customizable admin dashboard
- Can coordinate storage activities across your environment
- Leverages AI to aid in capacity planning
Cons:
- Better suited for enterprises and data centers
Price: Contact the Sales Department to get a quote.
Register for the demo: You can request a free demo of IntelliMagic Vision for SAN.
EDITOR'S CHOICE
IntelliMagic Vision for SAN is our top pick for a NetApp monitoring tool because it has an integration for NetApp’s proprietary operating software that organizes its FAS package. The analysis of storage arrays is complicated because it requires the tracking and correlating of each component of the I/O stack including the VMware servers and guests, the storage fabric, and the storage components themselves. IntelliMagic is able to identify the interplay between all of these components and raise intelligent alerts that identify the exact cause of a problem rather than just warning about the NetApp FAS in its entirety. The alerting mechanism uses AI to automatically adjust thresholds to the standard behavior of your enterprise and thus reduce the incidences of false positive reporting.
Download: Get a DEMO
Official Site: https://www.intellimagic.com/contact/request-demo-zos/
OS: Delivered as a SaaS solution
2. SolarWinds NetApp Storage Performance Monitoring – FREE TRIAL
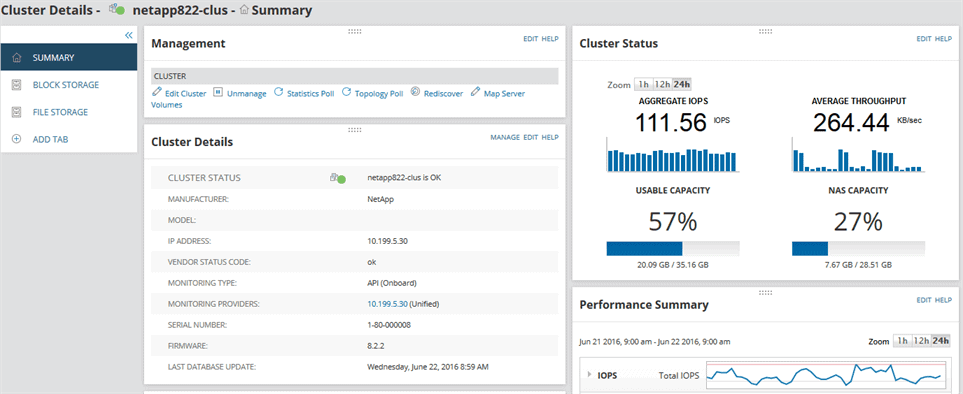
The NetApp Storage Performance Monitoring software developed by SolarWinds, helps you gain deep insights on the performance of all your NetApp arrays and get storage views. The software comes within the Storage Resource Monitor SRM, which is a storage management tool that supports multi-vendor devices.
With the NetApp monitor, you can perform health checks and identify possible bottlenecks on your NetApp storage. You can also check the cluster at different levels, from the filer, the RAID groups, to the volume.
The software comes with the main dashboard or “Summary” that shows you all details about the cluster and its current status. From the same page, you can also manage the cluster and get a performance summary.
The SolarWinds NetApp Storage Performance Monitoring will:
- Monitor your performance metrics, including, IOPS, average throughput, NAS capacity, usable capacity, and latency.
- Provide proactive capacity planning, by tracking historical storage consumption data and predicting when the storage will be finished.
- Provide insightful reports and alerts to help you troubleshoot faster.
Pros:
- Easy to use – get started right away
- Highly visual and interactive admin console
- Easily manage multiple RAID arrays and complex storage setups
- Built with administrators in mind
Cons:
- Can take time to fully explore all tools and features
Price: 30-Day Free Trial – Download Below to Get Started!
Download: Fully-functional free trial of SolarWinds NetApp Storage Performance Monitoring for 30 days.
3. Site24x7 Network Monitoring – FREE TRIAL
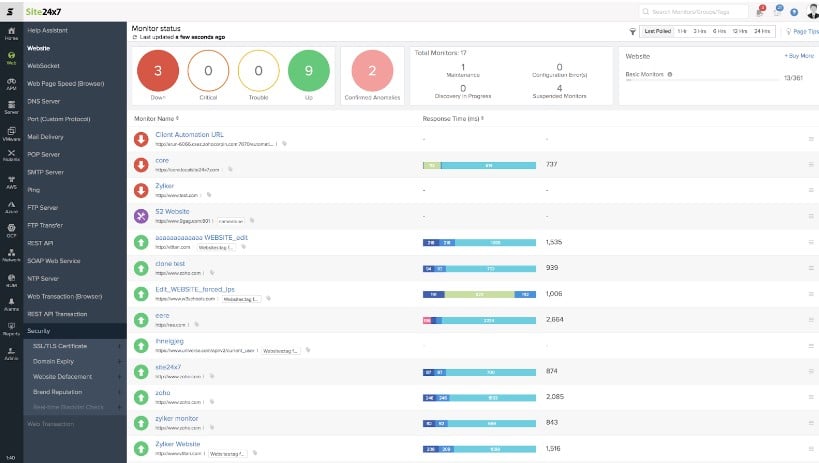
Site24x7 Network Monitoring is part of a suite of system monitoring services that are delivered from a cloud platform. This package provides both network performance monitoring and bandwidth analysis. The Network Monitoring system is bundled in with monitors for applications, servers, and Web assets, so you get full stack monitoring services with this deal.
Features and Capabilities
- End-to-end path analysis
- Root cause analysis
- Alerts for device issues
- Alerts for capacity exhaustion
- Notifications forwarded by email, SMS, push notifications, voice call, or RSS
- Integrates with Jira, Teams, and ManageEngine ServiceDesk Plus for task management
- Web server uptime monitoring
The package uses the Simple Network Management Protocol (SNMP) to constantly poll device agents for status reports. These responses provide details of component statuses and activity data. The other strand of this network supervision system communicates with switches using the NetFlow, J-Flow, sFlow, CFlow, IPFIX, NetStream, and AppFlow protocols to compile bandwidth capacity and utilization statistics.
Pros:
- Flexible cloud-based monitoring option
- Offers a host of out-of-box monitoring options and dashboard templates
- Allows administrators to view dependencies within the application stack, good for building SLAs and optimizing uptime
- Offers root cause analysis enhanced by AI to fix technical issues faster
Cons:
- Site24x7 is a feature-rich platform with options that extended beyond server monitoring, may require time to learn all options and features
Site24x7 is a cloud service and so you sign up for the system on its website rather than downloading a file. You can get the service on a 30-day free trial.
Price: The Infrastructure monitoring package, which includes the Network Monitoring modules starts at $9 per month.
Get access: https://www.site24x7.com/signup.html
4. ManageEngine ADAudit Plus – FREE TRIAL
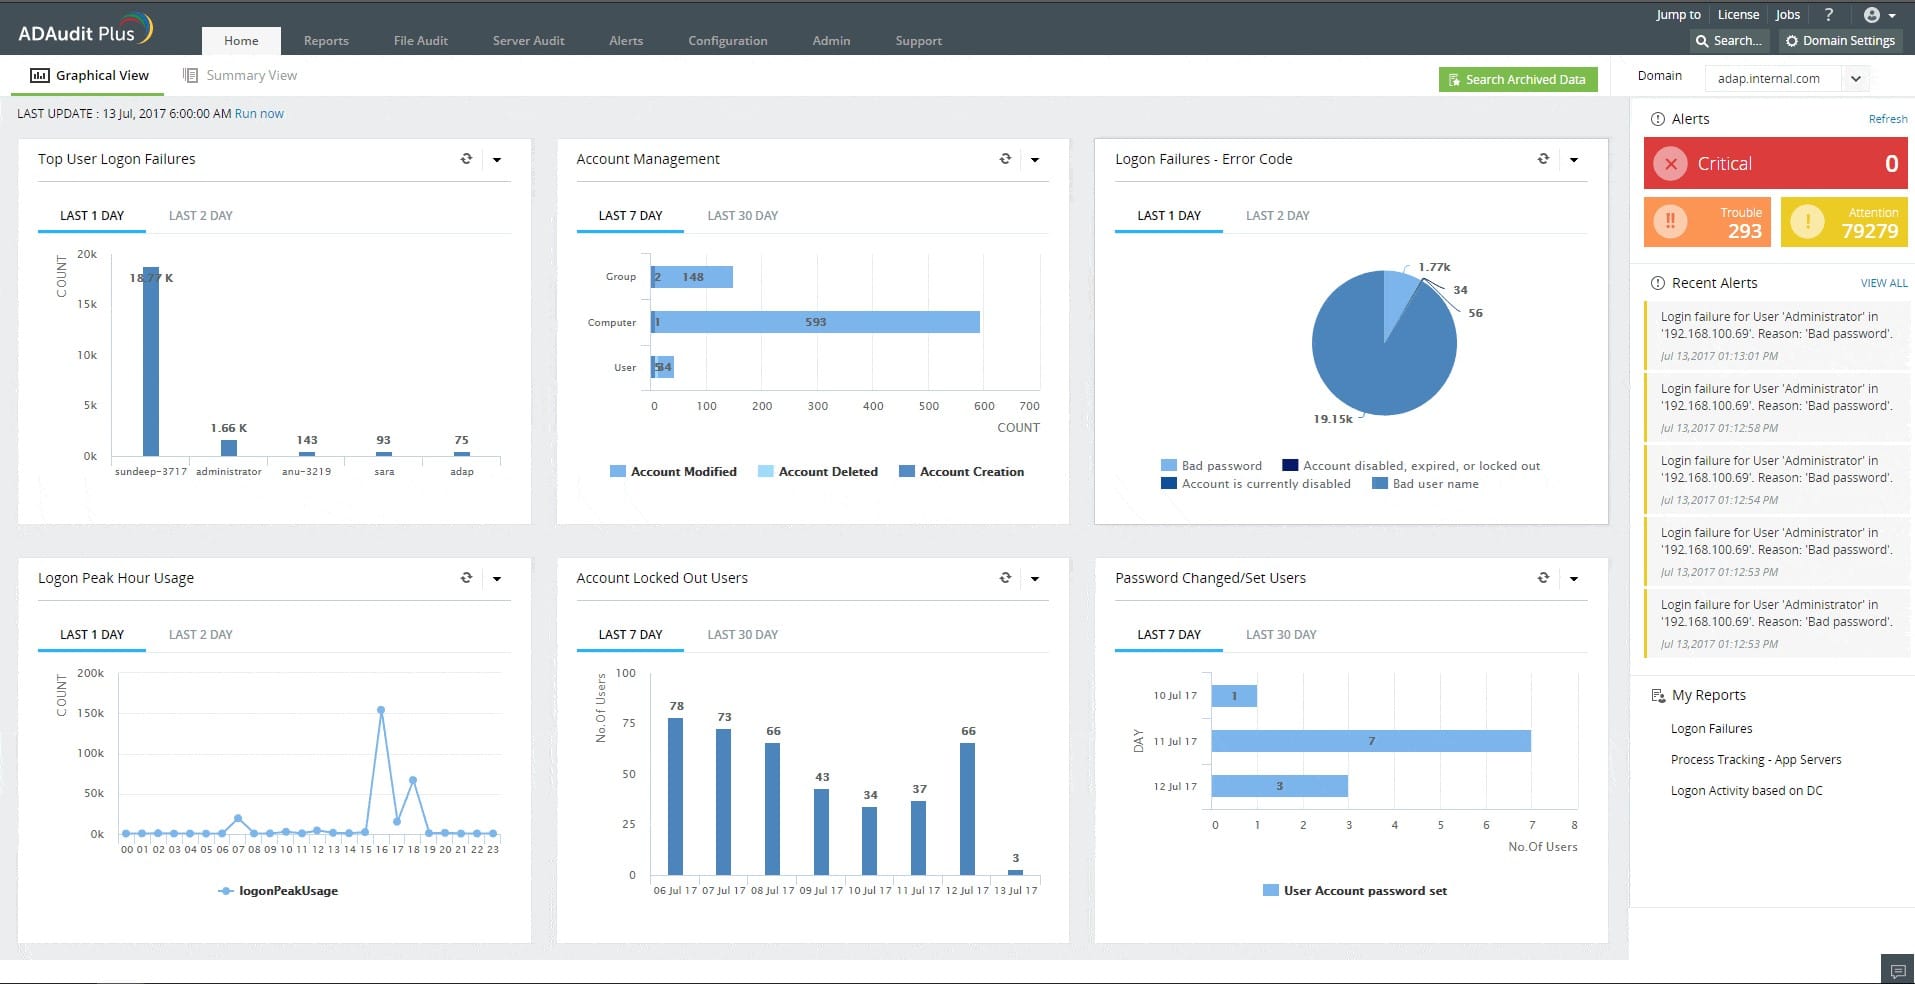
ManageEngine ADAudit Plus logs file-related activity on servers and workstations. The capabilities of the tool include special procedures for tracking activity with NetApp filer and CIFS shares. The tool also alerts for unauthorized changes in Active Directory.
Features and Capabilities
- NetApp filer activity tracking
- Real-time NetApp CIFS auditing
- Alerts for NetApp configuration changes
- File integrity monitoring
- Email and SMS notifications for alerts
- User behavior analysis (UBA)
- Activity auditing templates
- Compliance auditing for SOX, HIPAA, PCI-DSS, FISMA, and GLBA
Although tracking file activity is important, you should really focus on Active Directory entries to ensure that only authorized users are getting into your files. You need to make sure that hackers haven’t tricked your valid users into giving away their credentials, which is why the user behavior analysis module in ADAudit Plus is important.
Pros:
- Let you watch over Active Directory to look out for unauthorized changes
- Tracks user activities looking for account takeover
- Logs file access
- Produces compliance reports
Cons:
- Not a SaaS package
Pricing: There is a Free edition for monitoring up to 25 workstations. Two paid versions are:
- Standard: Implements file integrity monitoring from $595
- Professional: Adds on Active Directory DC protection from $945
Download: Get a 30-day free trial.
5. PRTG NetApp Health Sensor – FREE TRIAL
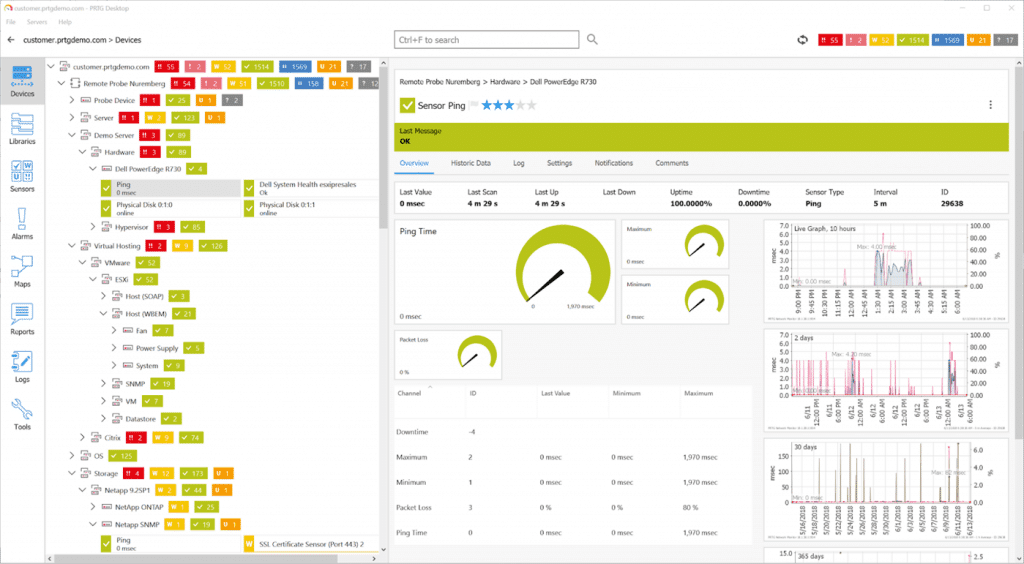
PRTG Network Monitor is a popular software among IT and network admins. It can help monitor every component in an IT infrastructure, form the network, the systems, applications, storage, traffic, databases, security, virtual, hardware, and a lot more.
The magic of PRTG Network Monitor is its sensors, which are monitored elements within a device. With these sensors, you can keep track of a single element, for example, IOPS, physical disk, or system health. You can run from one PRTG sensor to up to hundreds of sensors in a single device.
An excellent sensor to monitor NetApp is the SNMP NetApp System Health. It uses the Simple Network Management Protocol (SNMP) to keep track of your NetApp storage. It can monitor information such as:
- CPU load
- Used disk space
- Active restores
- Active disks
- Failed disks
- Spare disks
- Failed fans
- Failed power supplies
- Temperature
- And more.
Pros:
- Built for professionals and enterprise use
- Supports both heat mapping as well as wireless network performance monitoring
- Makes great use of visualizations to map out more complex wireless networks
- Includes pre-made sensors and the ability to build custom
Cons:
- Takes time to fully explore all features available in PRTG
PRTG's pricing is based on the number of sensors, starting at $1,330 for PRTG500, allowing up to 500 sensors monitoring. Download PRTG100 for free to test the NetApp Health Sensor indefinitely, or apply for a fully functional 30-day free trial to test the product with more than 100 sensors.
6. NetApp’s Active IQ Unified Manager
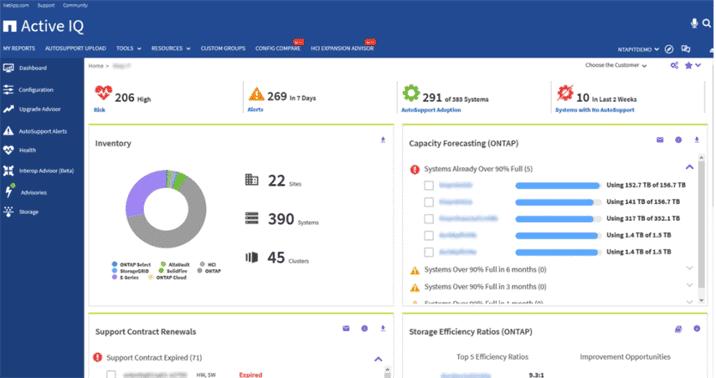
The active NetApp IQ Unified Manager is a management and analytics tool for the NetApp ONTAP systems. The software allows you to monitor, manage, and improve the FAS and AFF storage performance and capacity. With the IQ Unified Manager, you’ll be able to keep your storage infrastructure under control and improve security, scalability, and supportability.
Features and Capabilities
- Discovers and monitors storage.
- Notifications system.
- Manage and monitor petabytes of data.
- Advanced analytics.
- Multi-cluster.
- Auto-remediation.
- Create and share reports.
The software allows you to keep track of your storage resources by sending regular health checks and alerting accordingly. You can view all unified details from a single pane of glass and react to any alarm with the recommended steps.
You can install the Active IQ Unified manager in a Linux or Windows server or as a VMware host.
Pros:
- Simple yet intuitive interface and admin dashboard
- Supports both FAS and AFF storage options
- Offers a single view for all your NetApp monitors
- Includes auto-remediation
Cons:
- Best suited for SMBs
Price: Request a quote.
Download: There is no free trial.
7. Nagios Netapp Monitoring
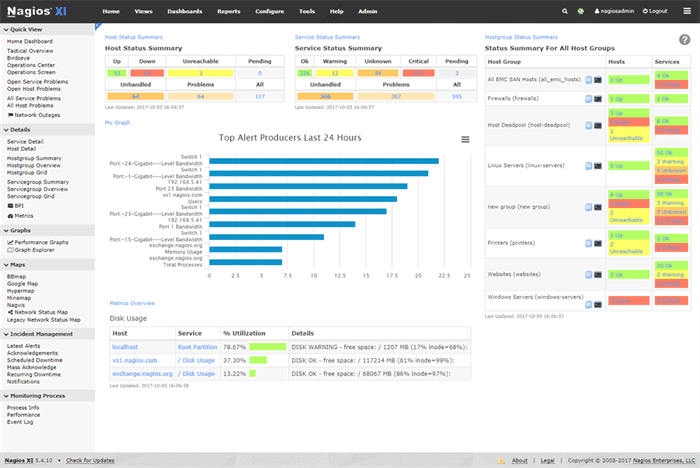
Nagios develops two distinct but powerful infrastructure monitoring tools, the Nagios Core and Nagios IX. The Nagios Core is the free and open-source version of the enterprise monitoring tool, the Nagios IX. Both tools can monitor storage, filesystem, files, directories, NAS, DAS, RAID Arrays, EMC, NetApp, and a lot more.
The Nagios Software can keep track of NetApp appliances, their filesystem usage, and free space. It can also monitor the essential elements from a NetApp ONTAP cluster, such as volumes, snapshots, quotas, fillers, and overall disk health.
The Nagios software comes with amazing alerting features to keep you informed when there’s a problem with a disk or a volume. You can see alerts in the single dashboard or get the software to send them to your email, or text you. You can also take advantage of the reporting system, to get all your Netapp clusters information into an organized report generated by the software.
Pros:
- Open-source transparent tool
- Simple, yet informative interface
- Flexible alerting options support SMS and email
- Robust API backend makes it a great option for developers who want to integrate their own custom applications
Cons:
- The open-source version lacks quality support found in paid products
- Installation can be technical and complex
Price: Nagios Core is free and open-source, and Core XI starts at $1,995 for a standard license.
Download: Fully-featured and free Nagios Core, or get a 60-days-trial version of the Nagios XI.
8. LogicMonitor NetApp Monitoring
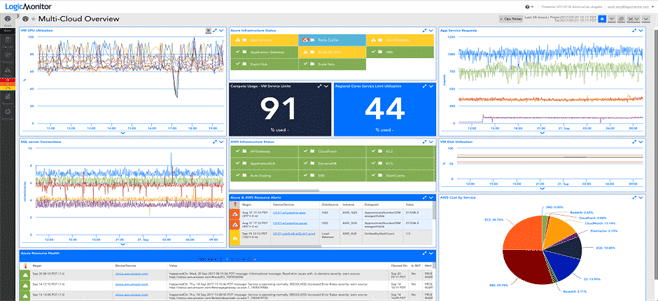
LogicMonitor is a SaaS-based performance and health monitoring platform for all kinds of IT infrastructure. It comes with over +1500 integrations so you can monitor any server, cloud, VMs, network, applications, websites, storage, websites.
The NetApp monitoring comes as one of those integrations. It is already pre-configured, and you can also customize it to your needs. With it, you can keep track of your NetApp performance, trends, and alerts.
LogicMonitor can keep track of a variety of metrics, such as:
- Active Interfaces.
- CPU Usage.
- Disk Activity.
- IOPS (IO per second)
- Per volume space.
- Inode and snapshot utilization.
- LUN queue depth.
- And a lot more.
Logic Monitor comes with a highly visual dashboard, which shows you the information in real-time. The dashboard also shows you the alarms, from critical to low importance, and the recommended actions to take.
Pros:
- Monitors application performance via the cloud
- Can monitor assets in hybrid cloud environments
- The dashboard can be customized and saved, great for different NOC teams or individual users
Cons:
- The trial is only 14 days, would like to see a longer testing period
Price: There are three different licenses, the Starter, Pro, and Enterprise. To know the price, request a quote.
Download: To get a 14-days free trial, sign up to LogicMonitor.
9. Netwrix Auditor for NetApp
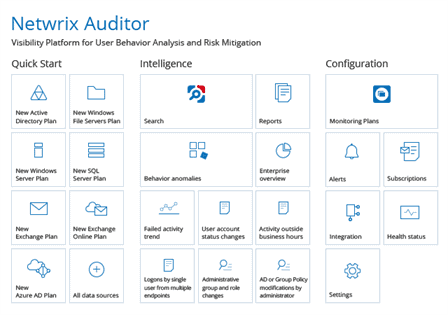
Netwrix Auditor is an agentless data security platform that provides visibility for user behavior analysis and risk mitigation. Netwrix helps protect your Netapp filers by monitoring their health, access events, sensitive files, user activity, etc. The software will also discover IT risks that may put data or users in danger.
The Netwrix Auditor for NetApp collects all filers event logs, analyzes them, and shows them in a readable format. The dashboard displays the results, including success or attempted access, violation in a set of permissions, and more.
You can get the Netwrix NetApp monitor through the free edition, which includes many of the features discussed above except, the “State-in-time reports on NetApp filer configuration,” which comes with the commercial license.
Pros:
- Offers detailed auditing and reporting that helps maintain chain of custody for sensitive files
- Offers hardware and device monitoring to track device health alongside security
- Allows sysadmin to implement automated remediation via scripts
- Integrates with popular help desk platforms for automatic ticket creation
Cons:
- The trial could be a bit longer for testing
Price: The get information for commercial licenses, request a quote from Netwrix official site.
Download: You can get a fully-functional for free for 20 days, after that time you’ll have to either activate the Free Community Edition or apply for a commercial license.
10. OpsView Monitor NetApp
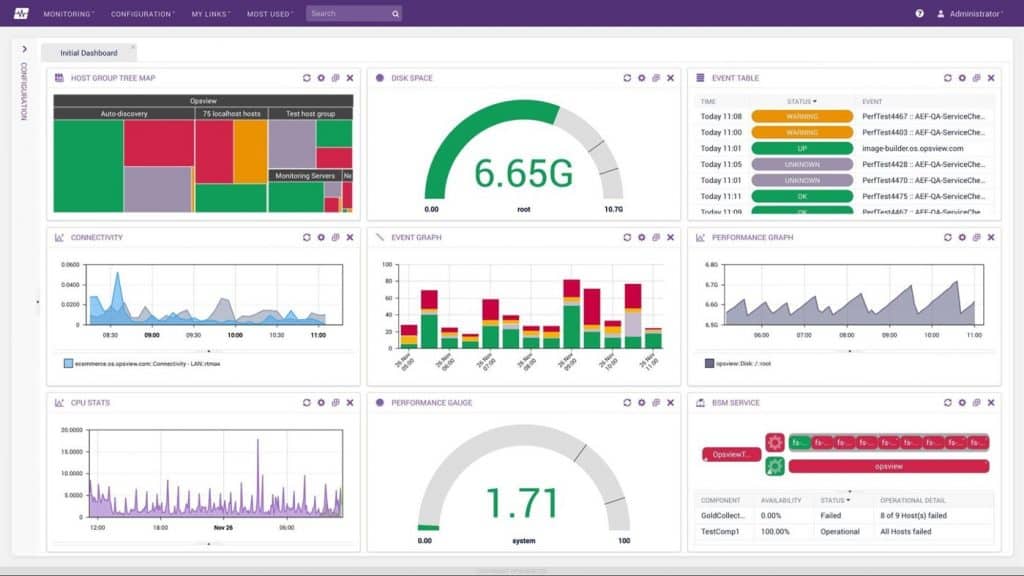
OpsView is a unified cloud and infrastructure monitoring software. It can run anywhere, on bare metal, on VMs, on the cloud, or on-premises. It supports thousands of plugins and can integrate, out-of-the-box with popular applications like VMWare vSphere, Docker, AWS, Azure, Cisco, Office 365, Jira, NetApp, and more.
OpsView supports NetApp monitoring as part of its Systems Monitoring Opspacks. With the Opsview Monitor’s NetApp you can keep track of the following metrics on a NetApp server:
- Uptime status.
- CPU load
- Disk read and write usage.
- State of hard disk, fans, and PSU.
- Free vs. the used space.
- Temperature and voltage.
- And a lot more.
The OpsView Monitor will display your NetApp data in real-time in its interactive dashboard. It will also display alarms or send them to your email or via text. And what is best is that it can also create visual reports, such as performance reports, SLA reports, and events reports.
Pros:
- Supports various sources including J-Flow, NetFlow, and sFlow monitoring
- Clean, easy-to-use interface
- Supports a free and paid version
- Highly customizable platform
Cons:
- Requires Opsview Monitor to monitor J-Flow, not a standalone tool
Price: OpsView has three different pricing plans, Free, SMB, and Enterprise. Free plan for up to 25 hosts. The SMB plan for 50 hosts for $95.00/month (includes all standard features). And Enterprise for over 300 hosts and comes fully featured, for more information, schedule a demo.
Download: free OpsView monitoring for up to 25 hosts for an unlimited time.
Summary
NetApp is the king when it comes to storing and managing your data. They have everything in line, from software, hardware, to systems and services to manage and store data.
Although Netapp has great monitoring solutions, you can always get leverage with other tools to check the health and performance of your storage.
The monitoring tools mentioned above are pretty complete. The good thing is that you’ll be able not only to keep those NetApp resources in good shape, but you’ll also have access to monitoring other aspects of your infrastructure.

