
Our funding comes from our readers, and we may earn a commission if you make a purchase through the links on our website.
Nagios VS Datadog
UPDATED: October 13, 2022
Both Nagios and Datadog are big names in the network monitoring world. Deciding which of these two titans to use is a big decision for any company. Datadog subscribes to a SaaS model which makes it the best pick for larger organizations that prefer to avoid the hindrances that come with a demanding on-prem solution. Today, we’ll be looking at both of these tools in detail so that you can make the right call for your business.
For fairness’ sake, we’ll mostly be looking at Nagios XI rather than Nagios’ free version in this comparison.
Nagios Product Highlights
Nagios comes in two different editions:
- Nagios XI Α paid monitoring solution, and
- Nagios Core Α free, open-source monitoring tool.
Nagios XI has two additional versions:
- Standard The Standard Edition is enough for most SMBs, and offers all of its core features.
- Enterprise The Enterprise Edition is packed to the brim with enterprise-focused features that allow you to have easier time scheduling reports, forecasting, and configuring your monitoring experience in a large-scale business.
Nagios XI is pretty much just a straight upgrade to Nagios Core. It uses Nagios Core as its back-end, alongside other technologies, and has a variety of features on top of the free version. Nagios XI offers excellent coverage, monitoring servers, applications, network protocols, as well as all other devices hooked up to your network. It also monitors a variety of network protocols including SMTP, HTTP, ICMP, SNMP, SSH, FTP, and others.
The tool also looks at a variety of different metrics like disk usage, system logs, available space, and processor load. In addition to this, Nagios XI overlooks your hardware temperature to make sure your devices don’t overhead. The tool is mainly run on Linux OSs and will give you alerts when a problem appears through multiple avenues.
Main Features
- A comprehensive monitoring solution capable of monitoring all of your network’s critical components.
- The tool helps you remediate when a network component, app, or service faces an issue.
- Nagios XI provides a variety of planning utilities to help you plan your upgrades proactively.
- Multi-user access and user-specific view support.
- Easily integrates with a variety of different APIs, as well as hundreds of community-made add-ons
- Features a free version in Nagios Core.
- Robust alerting system that supports email and SMS messaging.
- Excellent reporting features.
Pros:
- Open-source transparent tool
- Simple, yet informative interface
- Flexible alerting options support SMS and email
- Robust API backend makes it a great option for developers who want to integrate their own custom applications
- Very generous two-month trial period
Cons:
- Open-source version lacks quality support found in paid products
- Installation can be technical and complex
Datadog Product Highlights
Datadog is an agent-based monitoring tool that monitors both on-premises and cloud infrastructures. The tool was named the Leader in the 2021 Gartner Magic Quadrant for Application Performance Monitoring. Datadog boasts excellent autodiscovery features, as well as a very user-friendly UI given the scope of the tool.
Once Datadog has discovered the entire network, you can look at an overview of all network activity from its Dashboard. This functionality also helps Datadog set up a topology map that provides you with deeper insights into the inner machinations and reliances of your network.
In recent years, Datadog has started to purchase a variety of companies in the network monitoring space, leading them to expand the range of services they offer. Another of Datadog’s upsides is how easy it is to integrate the tool with a variety of service stacks. At the moment, Datadog supports over 450 integrations.
When it comes to pricing, Datadog is priced based on tiers, each of which gives you a particular set of its features, the three most popular ones are:
- Network Performance Tier This tier is aimed at SMBs, and is priced at $5 per function. Oftentimes, this is the most money-efficient way to use Datadog for an SMB.
- Infrastructure Tier Owners of a medium-sized network will get the most use out of this tier, with it offering a centralized, network-wide solution.
- APM Tier Priced at $31 per host, this tier is made with enterprises in mind. It has multiple highly specialized features like service and device layer fixing that ensure your enterprise gets the most out of the tool.
Main Features
- The UI is slick, responsive, modern, and easy to use.
- Easily integrates with a variety of common peripheral applications like Slack, email, and PagerDuty.
- Highly customizable, Datadog can be set up to do exactly what you want it to.
- Recently, the tool has included a variety of data analytics features, letting it work as a good data analytics tool by itself.
- Autodiscovery features.
- Extremely flexible pricing.
Pros:
- Offers numerous real user monitors via templates and widgets
- Can monitor both internally and externally giving network admins a holistic view of network performance and accessibility
- Changes made to the network are reflected in near real-time
- Allows businesses to scale their monitoring efforts reliably through flexible pricing options
Cons:
- Would like to see a longer trial period for testing
Nagios XI vs Datadog: Head to Head
Installation and System Requirements
Nagios XI has minimal resource requirements and runs on most Linux distros. As an agentless system, its installation process is extremely simple. It can also be installed manually on a physical server, which lets you immediately start adding devices for it to monitor. Datadog, on the other hand, needs you to install multiple agents after it's set up.
For most common application stacks, Nagios XI gives you a wizard to quickly integrate it. Since both tools feature autodiscovery features, they’re both quick with finding new devices.
As a SaaS application, Datadog has no on-prem system requirements and is simple to install. With that being said, most devices will need an agent to be monitored. The setup process with VMware vSphere is also complicated, while with Nagios XI, it’s extremely quick.
In this regard, Nagios XI is the clear victor.
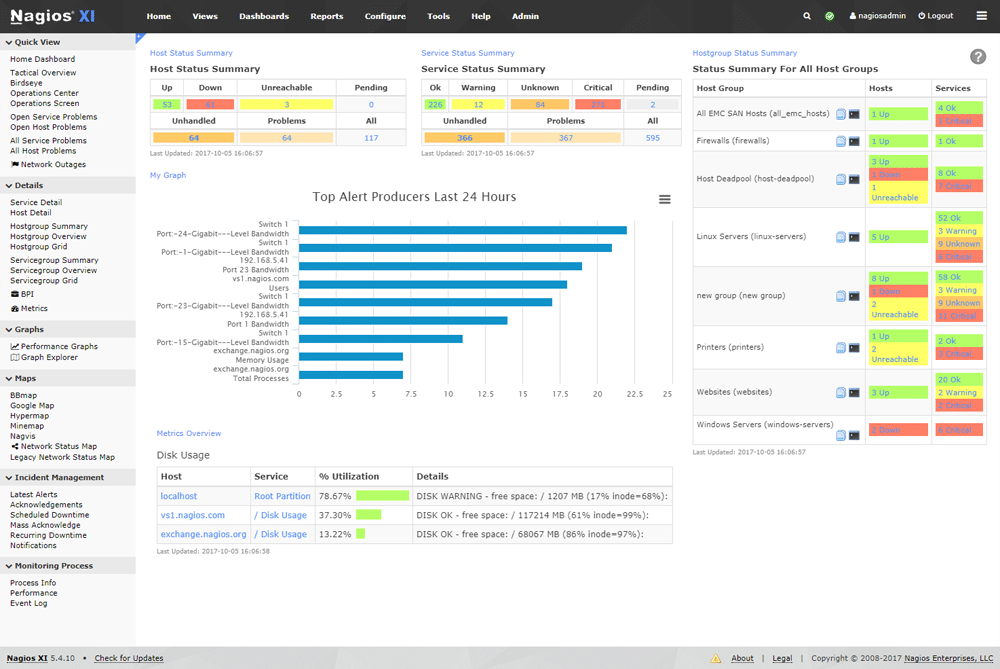
UI And Visualizations
Nagios XI has individual dashboards for each user which can be customized. It’s a well-rounded, organized UI, however, it’s quite dated and can be a pain to use sometimes. While Nagios lets admins deploy dashboards to other users, there’s no way to manage all dashboards from one screen.
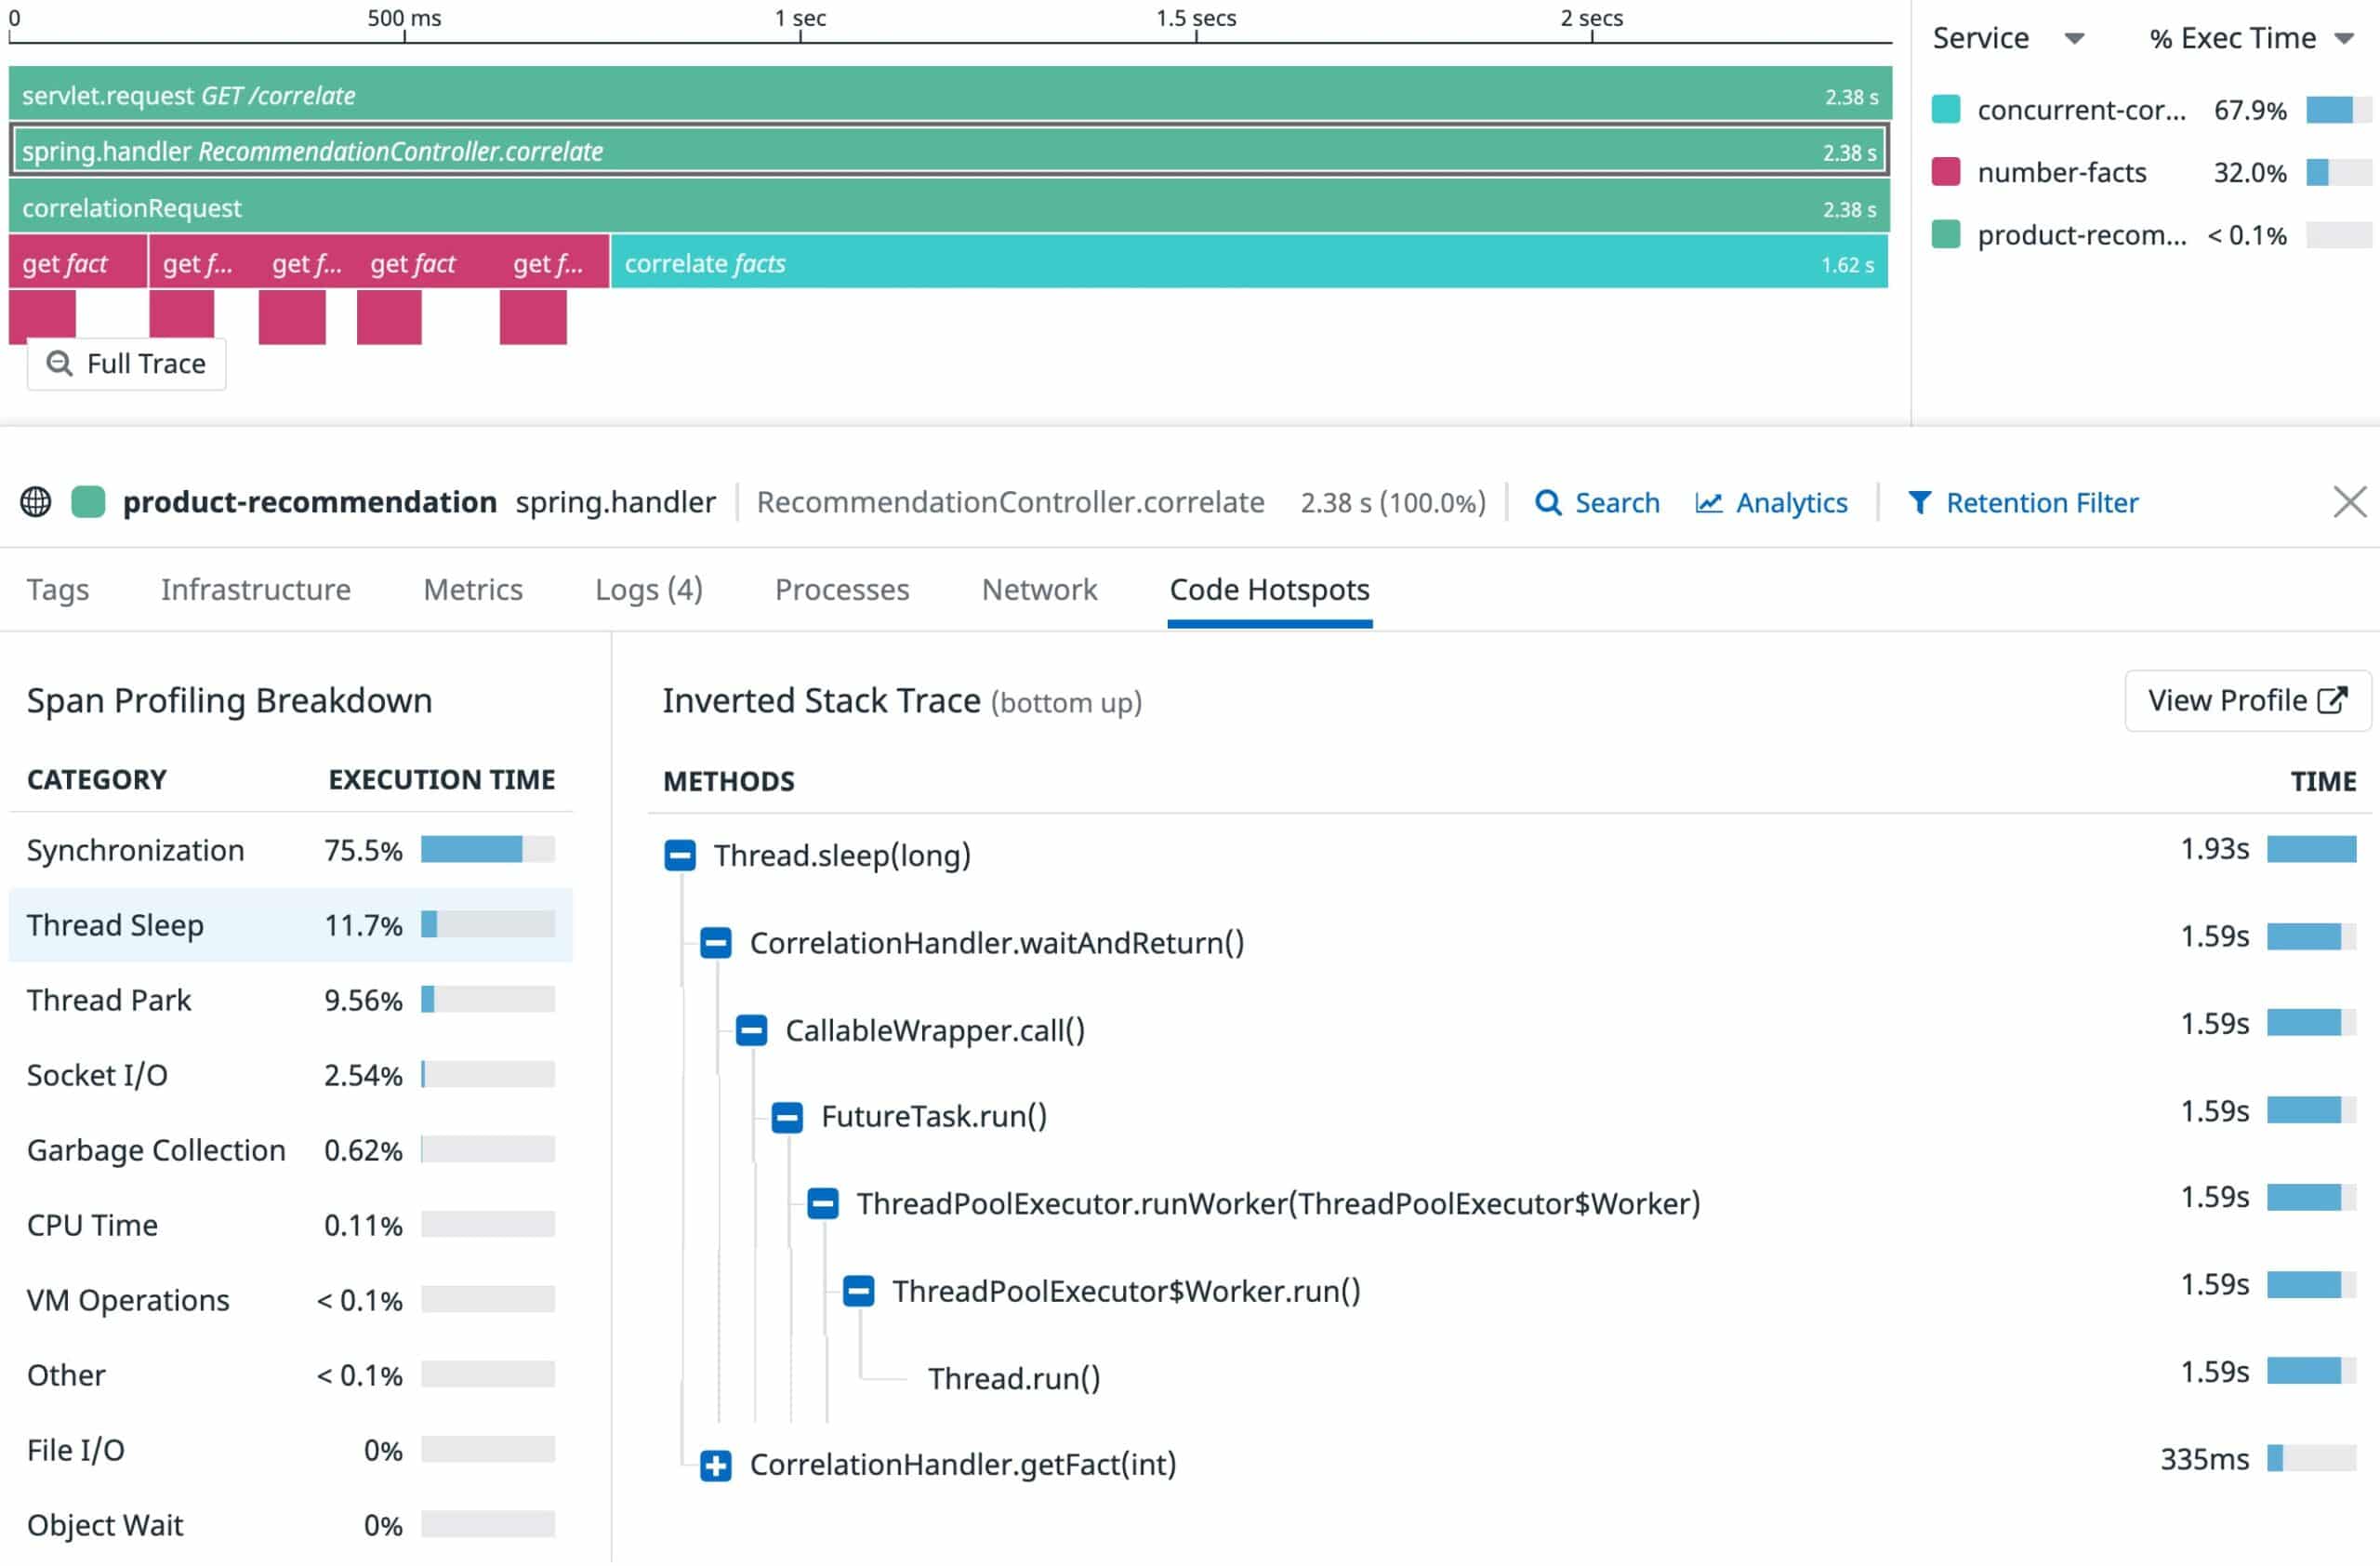
Datadog has an excellent UI, from its sleek and modern presentation to its intuitive usage with minimal hassle. The dashboards are extremely customizable, with a variety of visualization tools available, as well as drag-and-drop widgets. Although it takes a bit of setup, once Datadog has been set up, it offers you two different ways to visualize data:
- Screenboards Screenboards are grid-based dashboards with free-form layouts. You can put images, host maps, graphs, logs, or tables on them. These are most useful when you want to quickly assess your network and look at the most important metrics. Screenboards are updated in real-time, you can even view past data through them.
- Timeboards Timeboards show you a single point in time, whether fixed or real-time, across the entire dashboard. They’re usually used for data exploration and troubleshooting. You can also plot metrics that you’ve gathered from your devices on a graph.
All in all, while it’s a bit more difficult to set up, Datadog takes the cake on this one.
Alerts and Notifications
Nagios is relatively difficult to set up alerts for outside of email. You need to configure a gateway to any service outside of the email you intend to use. It's also possible to send alerts to contact groups, which doesn’t require you to make a user account. You can define who gets notified of problems from the notifications page.
Datadog, on the other hand, takes a different approach. It uses a machine-learning software they call Watchdog. It uses machine learning in order to find issues within your infrastructure, app efficiency, and services. You can then receive alerts by Slack, email, PagerDuty, and other avenues. You can customize your alerts to be based on any metric Datadog can monitor. This leads to specific, actionable, and contextualized alerts, making it much easier to act upon them.
While Nagios has a good approach to alerts, it doesn’t compare to Datadog’s innovative, easily integrated approach.
Reporting and APIs
Nagios XI lets you create and export out-of-the-box reports like availability and historical reports right away. This is easily done from the dashboard’s Reports link. You can then customize all of the report options from the settings. Nagios’ backend REST API also lets you read, write, update, and delete data from the Nagios XI system. With that being said, the biggest draw Nagios has here is in its vast array of plugins. This provides Nagios with insurmountable flexibility.
Rather than using regular, out-of-the-box reporting, Datadog looks to make metrics easily searchable, and it has done this flawlessly. While some managers will prefer PDF-based reports, they’re not always needed. Datadog also has a very easy-to-use API to make extending its capabilities easier.
All in all, Nagios slightly edges out here due to its superior flexibility.
Licensing and Price Plans
Nagios XI has an indefinitely valid, one-time licensing structure where you can use its renewable annual maintenance plan for a fee if you need it. The tool is priced based on the number of nodes(anything with an IP address) you intend to monitor. The tool is free for up to 7 nodes, and the initial license comes with one-year maintenance and technical support, which will help you for up to 10 incidents. After this, you need to renew your maintenance plan. This also allows you access to a Customer-Only forum, as well as direct tickets. This one-time pricing can be very good for smaller businesses. It’s priced between $1,995 for 100 nodes and $19,995 for unlimited nodes.
Datadog’s pricing is based on tiers, each of which gives you a particular set of its features, the three most popular ones are:
- Network Performance Tier This tier is aimed at SMBs, and is priced at $5 per function. Oftentimes, this is the most money-efficient way to use Datadog for an SMB.
- Infrastructure Tier Owners of a medium-sized network will get the most use out of this tier, with it offering a centralized, network-wide solution.
- APM Tier Priced at $31 per host, this tier is made with enterprises in mind. It has multiple highly specialized features like service and device layer fixing that ensure your enterprise gets the most out of the tool.
There are also more specialized tiers such as the log management tier that provide specific features in case they’re all you need.
Due to its higher flexibility, Datadog pulls slightly ahead in this category.
Nagios VS Datadog Verdict
These tools are both excellent choices for a solution that can match any organization’s needs. Regardless of whether you’re an SMB or a large enterprise.
However, we believe that Datadog’s intuitiveness and flexibility when it comes to alerts and pricing let it pull slightly ahead of Nagios for most users.
If you’re a large business or enterprise with a love for plugins and integrations, Nagios XI might be a better choice for you. However, Datadog serves a much wider swath of businesses and provides an intuitive and effective monitoring experience.
Which one of these tools do you prefer?
What two tools would you like us to compare next?
Let us know in the comments below!

