
Our funding comes from our readers, and we may earn a commission if you make a purchase through the links on our website.
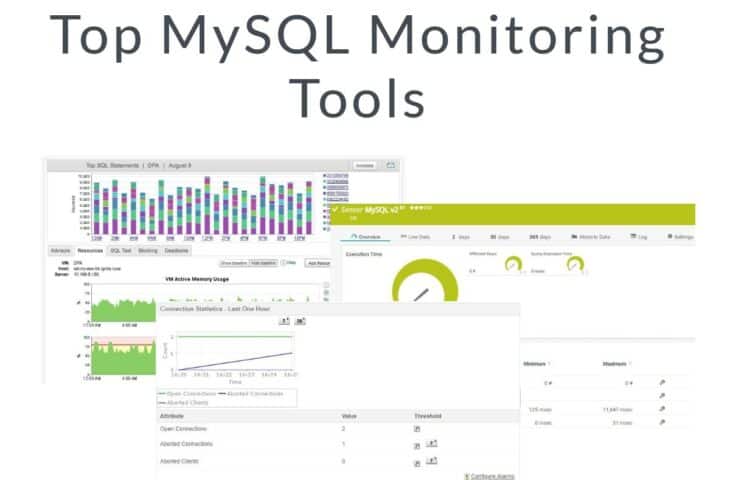
The Best MySQL Monitoring Tools
UPDATED: January 8, 2024
MySQL is the second most popular relational database management system (RDBMS) after Oracle. It is endearing facts like being a free and open-source database platform – while still offering advanced data management features and a robustness few others can match – that have contributed to its being favored as such.
This popularity also means there will always be a market for MySQL monitoring tools that database administrators (DBAs) can use to get the maximum performance out of their databases.
Here is a summary list of the best MySQL monitoring tools:
- SolarWinds Server & Application Monitor – EDITOR’S CHOICE This monitoring system tracks issues with more than 1,200 applications, including MySQL and other DBMSs. Link server capacity to application performance issues and get alerts to spot growing problems with this on-premises package for Windows Server. Get a 30-day free trial.
- Idera SQL Diagnostic Manager for MySQL – FREE TRIAL A package of database monitoring analysis that includes optimization for MySQL queries and the databases that they run on. Available for Windows, Windows Server, and Linux.
- Datadog Infrastructure – FREE TRIAL This cloud-based system monitoring platform offers application monitoring for services that include databases, such as MySQL instances.
- Site24x7 – FREE TRIAL Excels in MySQL monitoring, offering a specialized solution that ensures database administrators can maintain optimal performance and reliability of MySQL databases. Its in-depth monitoring capabilities, combined with customizable alerts, comprehensive reporting, and integration with wider IT infrastructure monitoring, make it an ideal choice for complex systems where MySQL is a critical component. Start a 30-day free trial.
- Paessler PRTG MySQL Monitoring – FREE TRIAL This is a cloud-based network infrastructure monitoring tool that uses numerous sensors to help administer MySQL databases as well as the hardware and software solutions that support them.
- ManageEngine Application Manager Here we have a popular suite of software and hardware monitoring tools for enterprise database solutions like Oracle, MS SQL, and MySQL which makes it a great choice for businesses with hybrid data storage systems.
- Percona Monitoring and Management Tool This is a free and open-sourced database monitoring, management, and security solution for all flavors of MySQL.
- AppDynamics MySQL Performance Monitoring A comprehensive database monitoring tool that works round-the-clock and gives in-depth insights into their performances as well as dependable forecasts.
What are the main metrics MySQL monitoring tools keep track of?
A good MySQL monitoring tool reads the pulse of a MySQL database and server system by tracking four main metrics:
- Queries: it is important to keep an eye on the performance of every single query to ensure there is an optimal performance in execution time. On the other hand, databases need to be monitored for inefficient joins between tables, insufficient indexes, and unnecessarily complex SQL statements which should trigger alerts.
- Capacity issues: database performance can be affected by issues with the hardware it sits on like low processing power, slow hard disk read-write times, hardware misconfiguration, low disk space, and low memory.
- Conflicts among users: when there are many users on a database they could run queries that interfere with one another's' activities. If one user's database query takes too long, it could cause a page or row lock. Transactional locks or deadlocks could also keep other users out until they are released. These tools help identify such conflicts.
- Configuration issues: improper hard disk configurations can cause issues. To avoid such performance issues, a tool can monitor for issues like insufficient buffer sizes or the absence of a query cache.
Armed with input from monitoring tools, a DBA can quickly resolve issues and get things back on track.
The best MySQL monitoring tools
Our methodology for selecting MySQL monitoring tools
We reviewed the market for MySQL monitoring software and analyzed the options based on the following criteria:
- A tool that can extract transaction data from MySQL
- A system that can assess My SQL objects for efficiency
- A package that will identify the cause of performance problems
- The ability to correlate server resource usage with database activity
- Recommendations for performance improvements
- A free trial or a demo of the system to allow an assessment before buying
- Value for money from a database monitor that also provides system and dependant application monitoring
1. SolarWinds Server & Application Monitor – FREE TRIAL
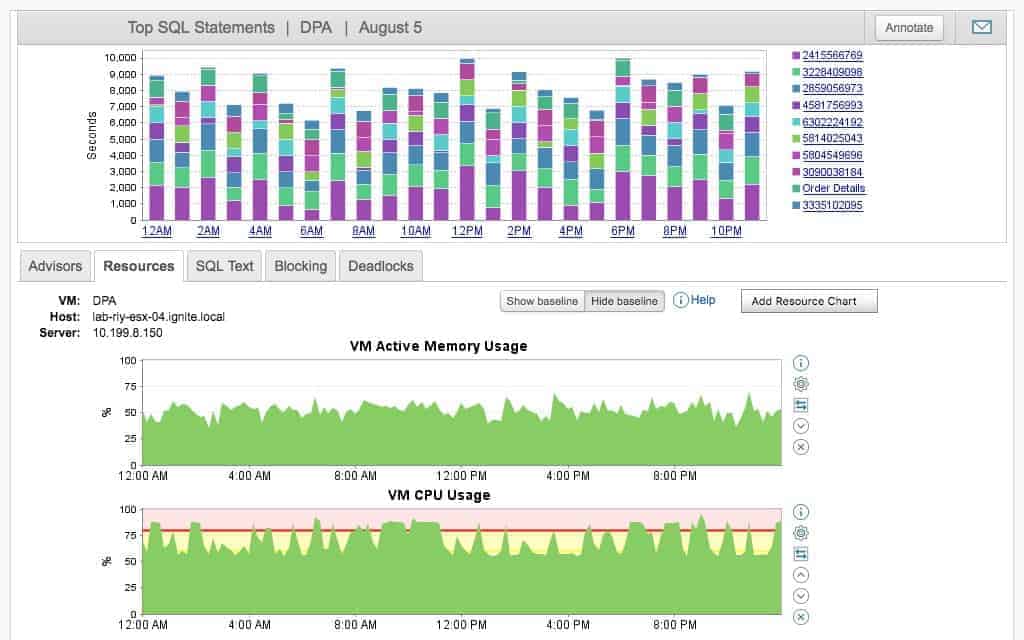
SolarWinds Server & Application Monitor (SAM) is a software-as-a-service (SaaS) platform with a web-based user interface; it deploys lightweight agents for specific tasks via multiple configurations. This makes it easy to install and use. It can be used to monitor MySQL databases in the cloud, local, or hybrid networking architecture environments.
Some more features include:
- This is a tool that monitors ALL servers but it can be made even more detailed and powerful with the Database Performance Monitor extension which can also work with MySQL databases. Meanwhile, SolarWinds Database Performance Analyzer for MySQL and MySQL Performance Monitoring integration tools specifically manage MySQL databases.
- With the MySQL performance monitoring tool, DBAs can measure latency and throughput times and receive warnings for errors in index usage and execution plans.
- It offers 24/7 real-time monitoring to help attain Key Performance Indicators (KPIs) goals for availability, deployment frequency, reduced failed deploys, and short change lead times.
- The tool makes instant recommendations on which server configurations to tweak and finds queries with potentially erratic behavior.
- The Query Analyzer is a root cause analysis tool that shows a master-detail view of all servers and has the capability of drilling-down into queries, EXPLAIN plans, and cross-correlating it with other metrics like I/O and CPU. Alternatively, it can drill down from a global view to a single problem query on a single server.
- The tool can monitor and classify data on MySQL queries, users, databases, processes, hard disks, and processors, among many other system components. It can also dissect these queries, users, and databases to compare them for trend and delta reports.
SAM stores both real-time and historical data that can be used to pinpoint, analyze, and resolve current performance issues as well as make forecasts. It also uses multiple methods to protect sensitive data which helps with achieving GDPR and SOC 2 compliance.
Pros:
- Designed with large and enterprise networks in mind
- Supports auto-discovery that builds network topology maps and inventory lists in real-time based on devices that enter the network
- Has some of the best alerting features that balance effectiveness with ease of use
- Supports both SNMP monitoring as well as packet analysis, giving you more control over monitoring than similar tools
- Uses drag and drop widgets to customize the look and feel of the dashboard
- Robust reporting system with pre-configured compliance templates
Cons:
- Designed for IT professionals, not the best option for non-technical users
Download a fully functional 14-day free trial of SolarWinds Database Performance Analyzer for MySQL.
EDITOR'S CHOICE
SolarWinds Server & Application Monitor (SAM) is our top pick for a MySQL monitoring tool because it is able to extract activity data from within each MySQL instance and analyze how each query executes. This service includes an alerting system that will draw your attention to slow, hanging, or abandoned database processes and will also tell you why that problem arose. The monitor watches how each query executes and recommends optimization to improve data delivery times. It can also indicate which objects need to be improved through issues such as normalization and indexing. The SAM gives you value for money because it will watch over all of your applications simultaneously, not just MySQL databases.
Download: Get a 30-day free trial
Official Site: https://www.solarwinds.com/server-application-monitor/registration
OS: Windows Server
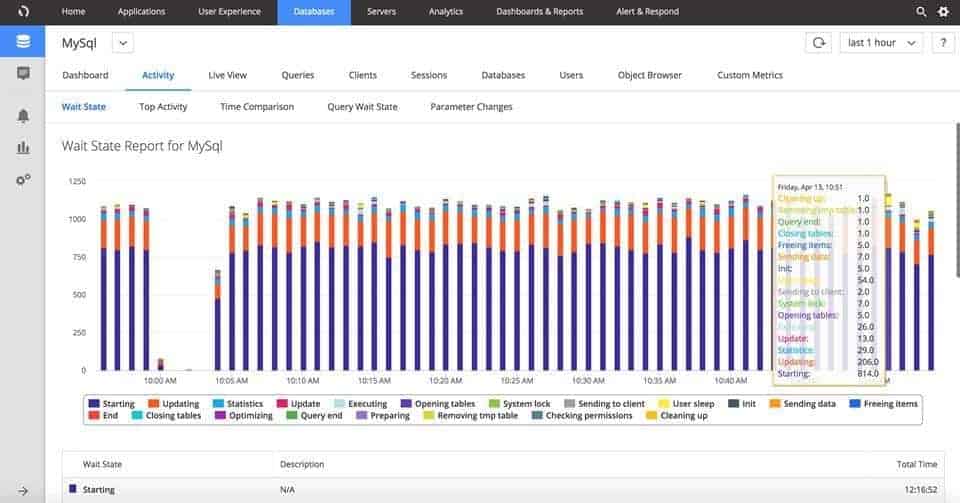
2. Idera SQL Diagnostic Manager for MySQL – FREE TRIAL
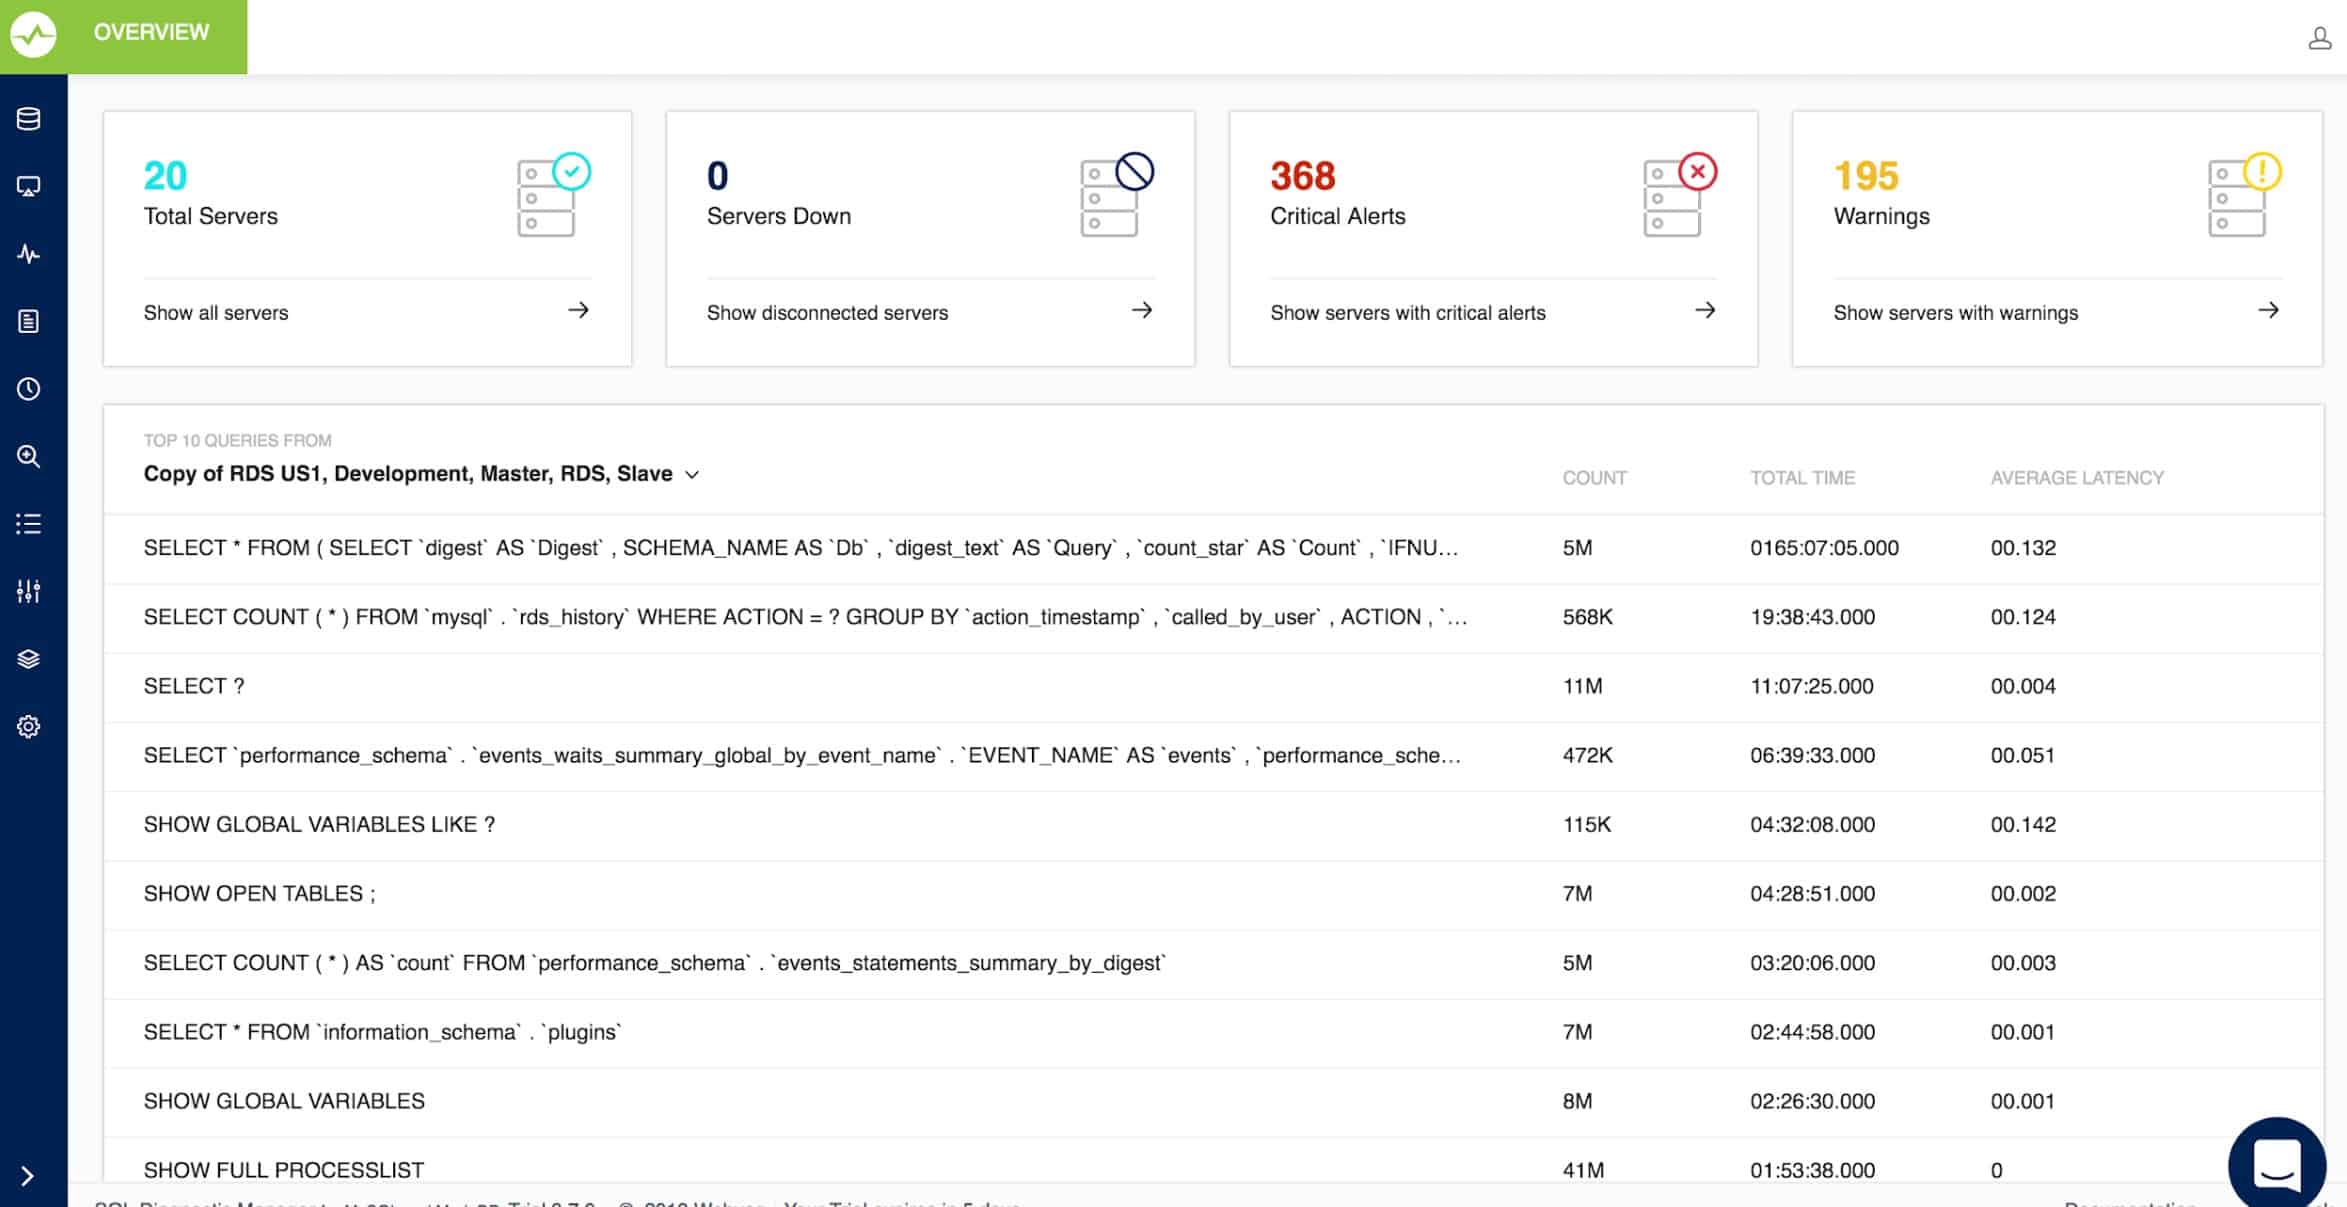
Idera SQL Diagnostic Manager for MySQL is a package of monitoring and management tools for databases created in the MySQL DBMS. It is also able to monitor other DBMSs and there is a different version of the package that caters to SQL Server databases.
Features included in this package are:
- Monitoring facilities for MySQL, MariaDB, Aurora, Azure Database for MySQL, Amazon RDS, Google Cloud SQL for MySQL, and Oracle Cloud MySQL Cloud Service DBMSs.
- Live monitoring for databases, including graphical representations of resource usage.
- Alerts arise when system resources become in short supply or when queries take too long to complete. This allows for unattended system monitoring.
- A performance optimizer for queries that shows the interaction of each transaction with database objects. This tool also enables the improvement of database structures.
- Tracking and recording of automated system processes, such as backup and replication.
- A log manager that stores all of the log files produced by the databases being monitored.
- Available for Windows, Windows Server and Linux.
Pros:
- Simple, but powerful interface – great for new users
- Auto formatting and syntax color makes helps DBAs stay organized when at scale
- Offers numerous presets and recommendations to improve performance out of the box
- Supports collaboration with real-time feedback and team features
Cons:
- The trial could be longer
Idera offers a 14-day free trial of SQL Diagnostic Manager for MySQL.
3. Datadog Infrastructure – FREE TRIAL
Datadog Infrastructure is a cloud-based service that covers services and applications. The package’s remit includes the monitoring of databases, including those run by MySQL. This system can monitor database instances anywhere, including on cloud platforms.
Features of this monitoring system include:
- Customizable screens in a cloud-resident console that can be accessed from anywhere through any standard Web browser.
- Track application dependencies that show databases in context with the systems that user them and those that support them.
- A database and query analyzer that supports the optimization of queries, suggesting new structures to speed up performance.
- A view on server resources that support databases.
- Alerts on performance and also on resource availability.
- Notifications sent by email, Slack, PagerDuty, Jira, and Webhooks.
Pros:
- Easy to use customizable dashboards
- Cloud-based SaaS product allows monitoring with no server deployments or onboarding costs
- Offers specific agents and dashboards for MySQL monitoring
- Allows businesses to scale their monitoring efforts reliably through flexible pricing options
Cons:
- Would like to see a longer trial period for testing
Datadog Infrastructure is a subscription service that is available in three editions: Free, Pro, and Enterprise. The Free edition is limited to monitoring five hosts. The Enterprise edition is higher than the Pro version because it adds on AI-based machine learning to identify application dependencies and predict resource exhaustion. Datadog Infrastructure is offered on a 14-day free trial.
4. Site24x7 – FREE TRIAL
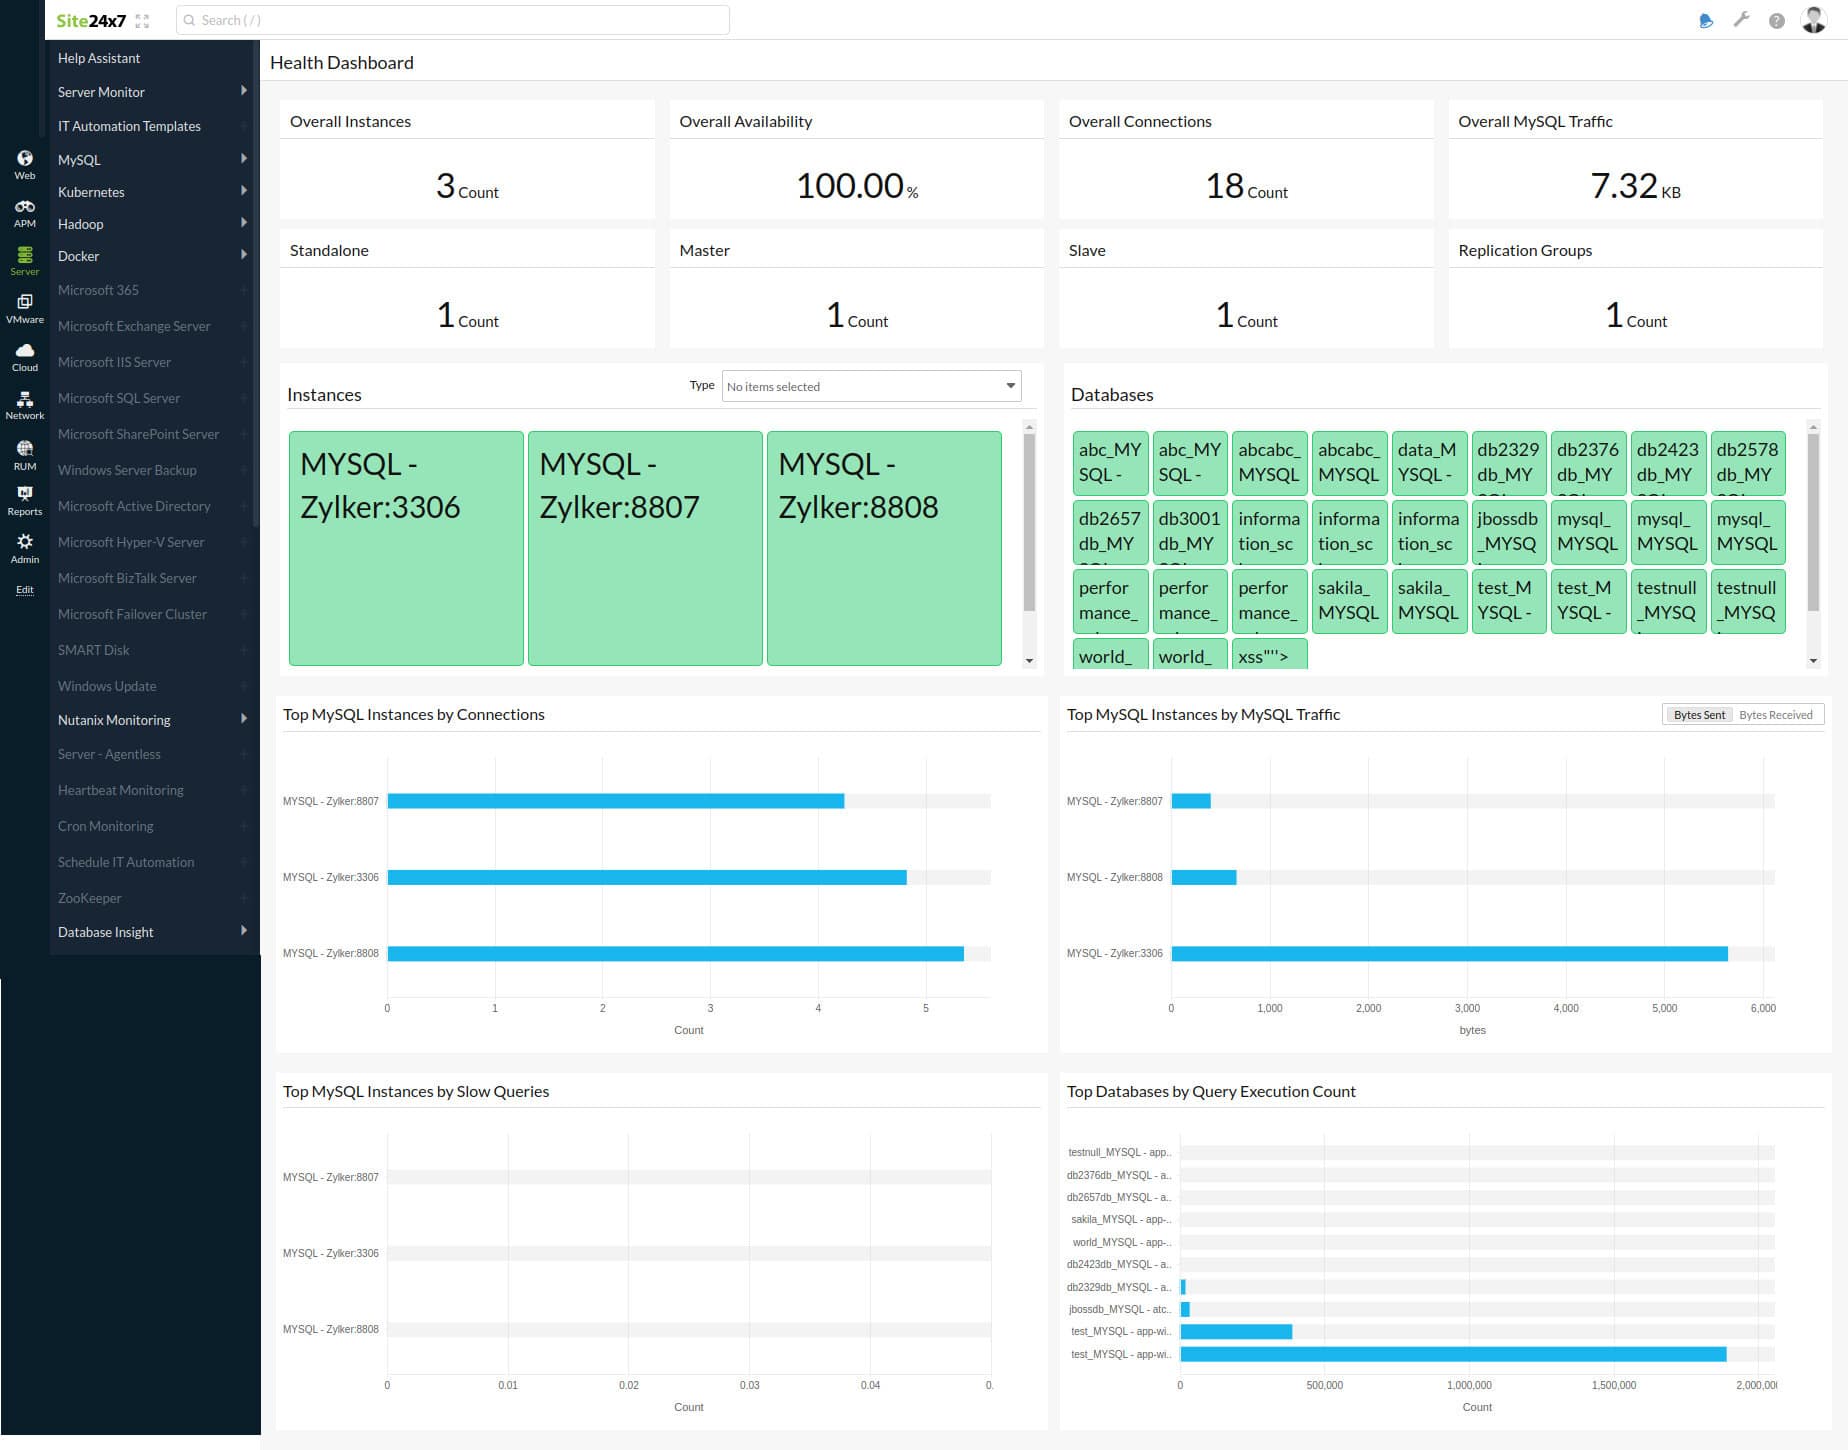
When it comes to MySQL monitoring, Site24x7 offers a comprehensive solution that stands out among the best tools available. It provides in-depth monitoring capabilities tailored specifically for MySQL databases, ensuring that database administrators and IT professionals can maintain optimal performance and reliability. Site24x7’s ability to monitor MySQL in conjunction with a full spectrum of IT infrastructure components makes it an excellent choice in scenarios where MySQL is a part of a larger, more complex system.
Key Features
- Detailed MySQL performance metrics, including query analysis, connection stats, and buffer pool usage
- Customizable alerting system for immediate notification of database issues
- Comprehensive reporting and dashboard tools for easy visualization of MySQL health and performance
- Automated discovery and monitoring of MySQL databases
- Integration with other IT infrastructure monitoring for a holistic view of system health
Why do we recommend it?
Site24x7 is recommended for MySQL monitoring due to its detailed performance metrics and robust alerting system. Its ability to provide deep insights into database health and performance makes it a valuable tool for database administrators and IT teams.
Who is it recommended for?
This tool is ideal for IT professionals and database administrators who manage MySQL databases, particularly in environments where MySQL is part of a broader IT infrastructure. Its comprehensive monitoring capabilities make it suitable for medium to large enterprises that require a detailed overview of their database systems.
Pros:
- In-depth MySQL performance monitoring
- Robust alerting and notification system
- Comprehensive reporting and dashboard capabilities
Cons:
- May be more complex than required for smaller or simpler MySQL setups
5. Paessler MySQL Monitoring – FREE TRIAL
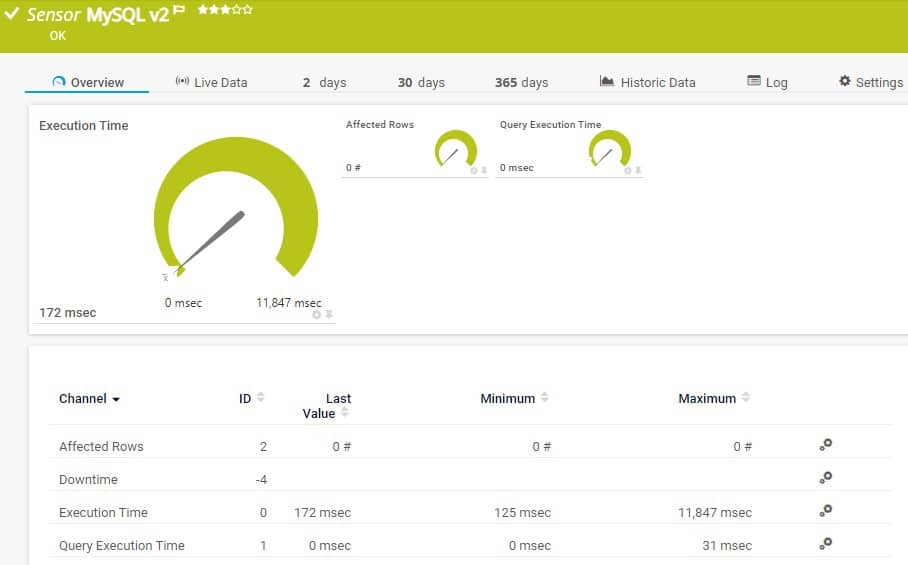
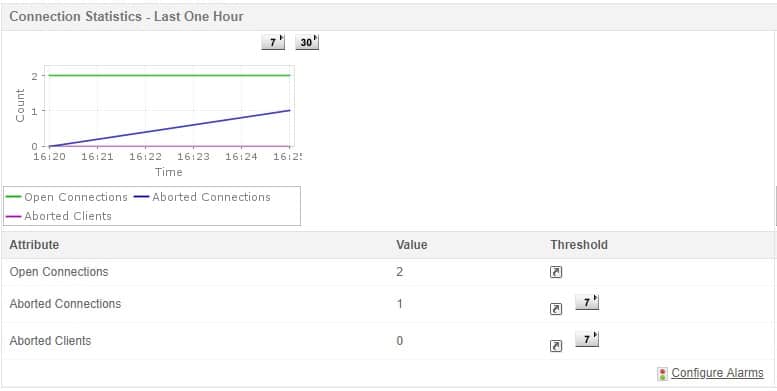
Paessler PRTG, a cloud-hosted network, and infrastructure monitoring tool – offers predefined sensors for every important database manufacturer, including MySQL, with the help of its MySQL v2 Sensor.
Features included with this monitoring tool are:
- PRTG can monitor Oracle, PostgreSQL, Microsoft SQL Server, as well as MySQL which makes it ideal for a complex database environment.
- The tool's dashboard is flexible, customizable, clean, and easy to use – it has tabs for quick access to features like notifications, alarms, and logs to effortlessly keep on top of issues.
- PRTG is also easy to set up which cuts the time needed to deploy and start running; once done, admins can use the default, pre-configured sensors, or configure their own for unique scenarios with the help of APIs.
- It can show execution times of requests – going from connection buildup, to query execution, to transaction handling, and disconnection times of a defined query. In the case of latency, it can then be tweaked for optimal performance.
- The tool can, for example, show the number of rows that were affected or added by a query like a SELECT statement when working with data tables and transactional insights are required for troubleshooting issues caused during execution time.
- When it comes to monitoring, PRTG minimizes query and return times which results in a real-time view of MySQL databases.
Pros:
- The MySQL agent is part of a larger suite of application-specific monitors – great platform for monitoring multiple services and servers
- Autodiscovery reflects the latest inventory changes almost instantaneously
- Supports a freeware version
- Allows for a degree of flexibility and sensor customization
Cons:
- Is a very comprehensive platform with many features and moving parts that require time to learn
PRTG offers a free download of their unlimited version of the tool that is free to use for up to 100 sensors. You can trial the full version free for 30 days.
5. ManageEngine Applications Manager
ManageEngine Applications Manager is another suite of software and hardware monitoring tools that holds a large share of the market. This tool has the ability to manage JDBC databases like Oracle, MS SQL, and MySQL.
In fact, the Application Manager has two features that help monitor and administer MySQL databases: MySQL Performance Monitor and Database Query Monitoring.
Together, these tools help DBAs manage and monitor the performance and availability of their MySQL databases with features like:
- DBAs can monitor critical performance parameters of their databases to maximize uptime. Some key performance parameters monitored include: connection times, request times, thread details, query hit ratio, database and index sizes, and replication details.
- It monitors MySQL query performance by keeping track of a set of specific critical queries and associating alarms to them, to get instant notifications in case they perform abnormally.
- Similarly, it can be used to keep a check on the latency of data syncing – and flag delays in synchronization of data between database servers – depending on the type of replication topology employed.
- It is also a forecasting tool – Applications Manager's MySQL monitor compares historical performance reports of database servers to visualize future performance trends. These machine-learning powered forecast reports allow DBAs to predict future growth and utilization of their MySQL databases and then plan for resource upgrades as well as load distribution.
- MySQL Monitoring also offers the flexibility to create custom reports that can be scheduled to run at required intervals.
All in all, Applications Manager's MySQL Management tool enables users to gain end-to-end visibility into the performance of their MySQL servers with its robust managing, monitoring, alerting, and analytical capabilities.
Pros:
- Offers on-premise and cloud deployment options, giving companies more choices for install
- Can highlight interdependencies between applications to map out how performance issues can impact businesses operations
- Offers log monitoring to track metrics like memory usage, disk IO, and cache status, providing a holistic view into your database health
- Can automatically detect databases, server hardware, and devices in real-time
Cons:
- Can take time to fully explore all features and options available
DBAs can download a 30-day free trial which reverts back to the free version once it expires.
6. Percona Monitoring and Management Tool
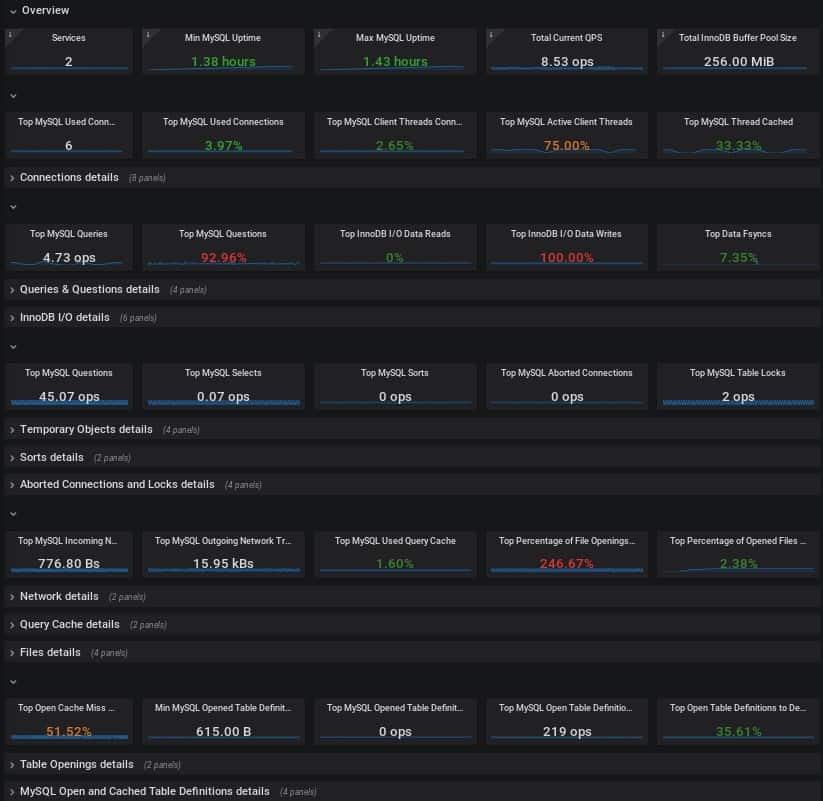
Percona Monitoring and Management Tool (PMM) is a free and open-sourced database monitoring and management solution. It works with MySQL and all its variants: MongoDB, MariaDB, Amazon RDS MySQL, Aurora MySQL, ProxySQL, PostgreSQL – the tool even has dedicated dashboards for some of these versions – as well as Percona XtraDB Clusters.
The monitoring tool comes with features like:
- Besides simplifying and optimizing MySQL database management, PMM also improves the security of other dependant business-critical database environments, irrespective of their location or deployment.
- The Security Threat Tool runs checks for common database security issues by helping to identify unexpected database queries, track database security loopholes, and reduce data exposure. The tool can run regular security checks on all open source databases and trigger alerts when databases are compromised.
- PMM offers real-time visibility, forecasting, and trends as well as a review of fleets of servers that allows for drilling-down into clusters.
- It also offers point-in-time and historical visibility of MySQL database performance for analysis.
- The Query Analytics (QAN) tool stays on top of the execution time of queries with details of MySQL query execution time to help understand the root causes of any latency.
- Security audits and history show real-time statuses of all databases and the currency of their details.
The company is known for its expertise in the development and support of various MySQL open software solutions that have proven to be highly-scalable.
Pros:
- Open source and transparent project
- Works with a variety of SQL environments including MySQL, PostgreSQL, and MariaDB
- Offers built-in security audit tools
- Offers in-depth query analytics for manual reviews
- Is completely free
Cons:
- Not ideal for larger businesses looking for dedicated support
The latest version of Percona Monitoring and Management Tool can be downloaded for free.
7. AppDynamics MySQL Performance Monitoring
The AppDynamics Database Monitoring tool's MySQL Performance Monitoring module is a comprehensive round-the-clock in-depth monitoring tool used to oversee MySQL databases.
Features of this tool:
- The tool offers the capability to visualize end-to-end application performances using just a browser.
- It can help identify and resolve performance issues with real-time insights into statistical data on MySQL databases and servers that are presented in delta graphs.
- The database monitoring tool monitors trend key performance metrics such as resource consumption, database objects, schema statistics, and more, allowing DBAs to proactively tune and fix issues before they affect end-users.
- It also shows execution plans for slow MySQL queries to help identify performance bottlenecks and triggers alerts when database thresholds are violated.
- DBAs can monitor, and then improve on, their databases' performance metrics including top users, programs, and objects.
- They can also analyze MySQL performance trends over time and use the information to proactively tune performances.
- It offers real-time visibility into MySQL server statistics that are then displayed in delta graphs.
- One-click query statement analysis displays details of SQL statements' execution plans with drill-down capabilities for quick troubleshooting. This includes the help of information on current MySQL configuration parameters, properties, and related information on database objects and their configuration values.
- Historical reports of delta comparisons help make data-driven decisions about MySQL servers.
Apart from MySQL, the tool also monitors DB2, Oracle, PostgreSQL, and MS SQL Servers from one central installation that can oversee an organization's entire data storage system.
Pros:
- Tailored for large-scale enterprise use
- Excellent dependency mapping and visualizations to help troubleshoot complex application systems
- Includes a free version
- Offers comprehensive database monitoring beyond just SQL
Cons:
- Better for larger networks and enterprise environments
AppDynamics offers a 15-day SaaS trial version of MySQL Performance Monitoring.
Why do you need MySQL monitoring tools?
Apart from automating the care of, and administering, a MySQL server are there other advantages to using MySQL monitoring tools?
Yes, there are; they include:
- Accuracy in diagnosing issues to help cut their troubleshooting and remedying times.
- Forecasting to know what could happen in the future allows for accurate resource management and planning.
- Avoiding man-made errors before they occur helps cut the number of issues before they can cause interruptions.
- Alerts can be configured to keep an eye on systems round the clock, even when there are no DBAs around.
All in all, MySQL monitoring tools take the burden off of DBAs who need to have a complete insight into their databases, ensuring their optimal performances, and to remedy issues with the shortest amount of time and effort spent. They keep them a step ahead of issues and help them future-proof their assets, thereby enhancing the performance of DBAs and network administrators.
MySQL monitoring tools FAQs
How often should I perform MySQL monitoring?
The frequency of MySQL monitoring depends on the specific requirements of your environment and the size and complexity of the database being monitored. In general, it is recommended to perform regular monitoring on an ongoing basis to ensure that the database is running optimally and to identify and resolve issues as they arise.
What should I do if I encounter a performance or availability issue with a MySQL database?
Suppose you encounter a performance or availability issue with a MySQL database. In that case, the first step is to gather information about the issue and the environment, including resource utilization and query performance.
You can then use this information to identify the root cause of the issue and take appropriate action, such as optimizing queries, reconfiguring the database, or adding additional resources. If the issue cannot be resolved, you may need to seek additional support from the MySQL community or a third-party vendor.

