
Our funding comes from our readers, and we may earn a commission if you make a purchase through the links on our website.
Monitor Windows Server Bandwidth Usage [ Free Tools & Utilities]
![Monitor Windows Server Bandwidth Usage [ Free Tools & Utilities]](https://www.pcwdld.com/wp-content/uploads/Monitor-Windows-Server-Bandwidth-Usage.jpg)
UPDATED: March 21, 2023
We’ve already heard the usual complaints from end-users… “my Internet is slow…,” or “my downloads are taking too long…” and the first thing that comes to our mind is to go out and buy more bandwidth.
But adding more bandwidth into the problem is a quick-and-dirty solution.
You’ll find a workaround to the problem, but soon the slowness of the network will catch up to you again.
What you need to do, is get to the root cause of the problem.
It could be related to an application consuming too much bandwidth, a user streaming Netflix constantly, or even an issue at the ISP.
Identifying the root cause by using a bandwidth monitor will help you get rid of the problem and improve your bandwidth usage.
We've created this step-by-step guide that will show you different case scenarios of how you can keep track of your bandwidth usage, especially for Windows Servers:
Monitoring Windows Server Bandwidth in Real-Time
To keep track of the bandwidth usage of a Windows Server in real-time, you can use the SolarWinds Bandwidth Gauges. This tool is part of the Engineer’s Toolset and you can set it up to monitor any of the devices on your network that you have identified with SNMP. As well as showing traffic flows in both directions from the specified device moment by moment, the tool will store recordings over time for historical analysis.
Install SNMP on the Monitored Device
The Engineer’s Toolset will poll the network with broadcast MIB requests periodically. However, you first need to ensure that your Windows Server system is set up to listen for those report requests and respond to them.
In the diagram below, the Engineer’s Toolset acts as the SNMP Manager, you need to get the SNMP Agent working on your server.
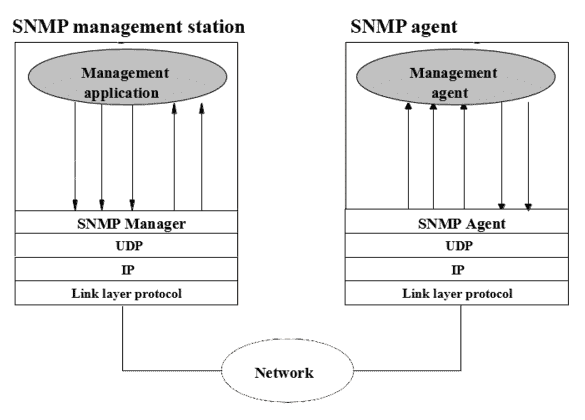
SNMP Agent Install
In this guide, we will configure the SNMP agent locally on the server that we want to monitor, which is a Windows Server 2012:
The SNMP agent does not need additional software, only to have SNMP enabled and configured.
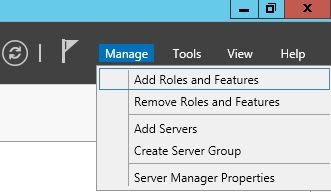
Open Server Manager > Manage > Add Roles and Features. This will open the Add Roles and Features Wizard.
Click Next, until you reach the Features window, where you’ll find and select SNMP service. Click “Install”.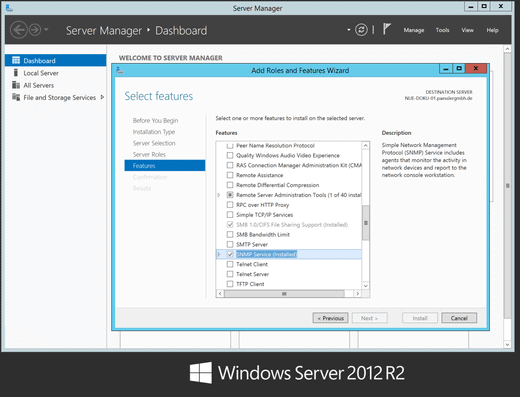
Now that SNMP is installed, you need to configure the SNMP agent with the Community String
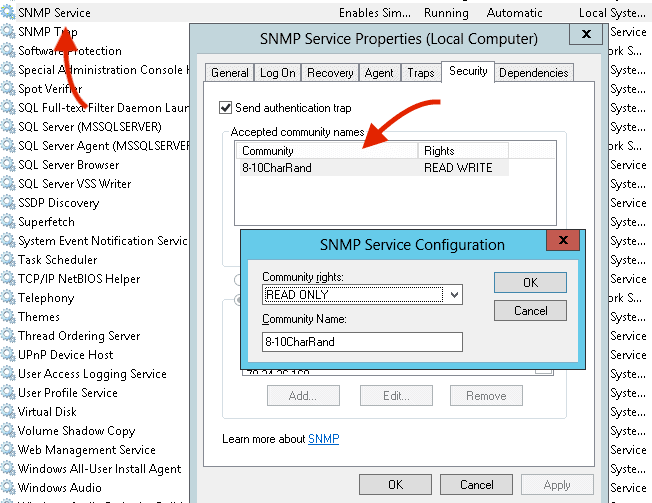
- Configure the SNMP Service. Open services.msc (with Administrator rights), by using the Run tool with the Windows Logo+R key and then typing “services.msc.” You can also go to Windows Start Menu > Administrative Tools > Services.
- Find the SNMP Service, right-click on it, and click “Properties.” Then click on the “Security” tab.
- Click on “Add” > Read-Only Community String. Type your 8-10 characters randomized community string and click on “Ok.”
Now, your Server is an SNMP agent
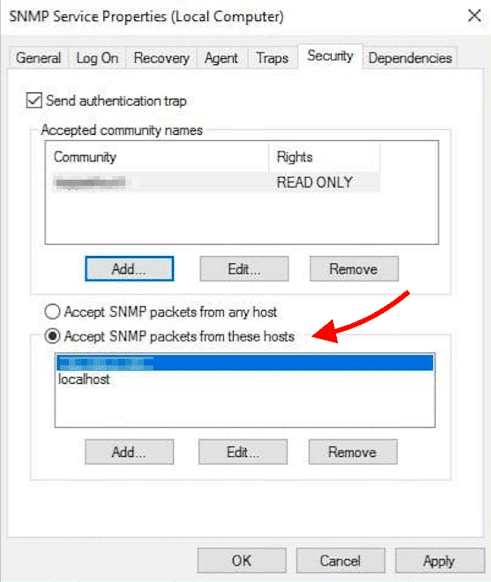
Finally, you can determine the remote server or computer that will run the Real-Time Bandwidth Monitor.
If you are running the monitor locally, you can leave it as “localhost”.
But if you have a remote SNMP server you can specify the IP address here.
Now SNMP is installed on the Windows Server, the service is up and running, and it is configured with the community string.
Now you can set up the Engineer’s Toolset to seek SNMP data.
Setting up the Engineer’s Toolset
The Engineer’s Toolset isn’t a free tool. However, you try it out on a 14-day free trial.
Sign up for the trial, download the software onto Windows Server and run the installer. Once the installer finishes open the Engineer’s Toolset and set up the Network scanner. Doing this gets SNMP data fed into all of the utilities in the Engineer’s Toolset.
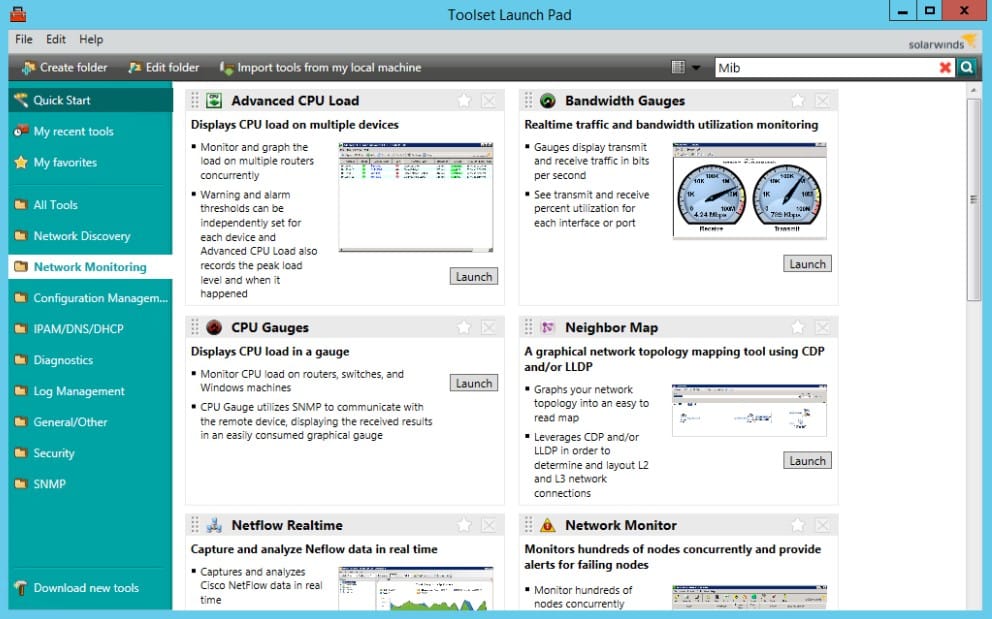
Look in the Toolset Launch Pad, which is shown below.
- Click on File and then select Network/Scanner Settings.
- In the Settings screen, open the Credentials tab and then check the Enable SNMP Discovery option.
- Click Add.
- Fill out the Add Credentials screen and then press OK.
- Arrange the community strings so that the most often used credentials are at the top. Use the Move Up and Move Down buttons while highlighting each re ord to do this.
- Click OK.
The SolarWinds Bandwidth Gauges facility requires SNMP discovery to be activated within the Engineer’s Toolset system. The package offers more than 60 system management tools, which include many SNMP-related functions. There is a central module to activate SNMP data collection within the interface. Once this has been set up, the SNMP system will feed data into many of the services within the Engineer’s Toolset, not just the Bandwidth Gauges.
Running the Bandwidth Gauges
In the Toolset Launch Pad. Click on the Launch button in the Bandwidth Gauges panel. This opens the utility.
- Click Gauges > New Gauge.
- Enter the device IP address or host name.
- Select to use a community string or SNMPv3 credentials.
- Click Test to check that the credentials are valid
- Click Next.
- Specify if you want to store the credentials in the shared credentials database.
- Select the discovered interfaces or ports.
- Click Next.
- Check that Adjust automatically-discovered speed is correct, or specify your own speed.
- Select 64-bit or 32-bit traffic counters.
- Click Finish.
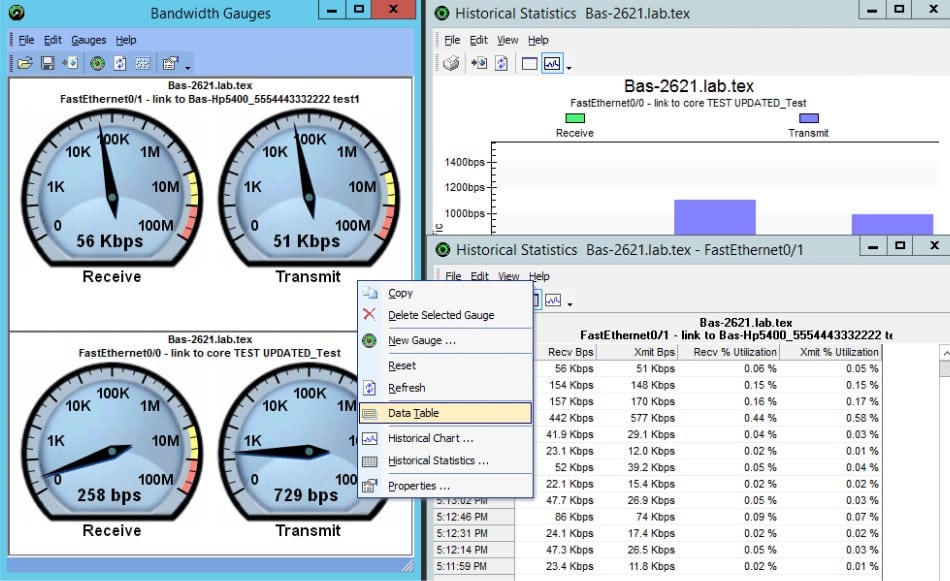
The gauge you set up now appears as a dial in the utility screen and a series of measurements will be shown in a data table.
Solutions for Larger Networks
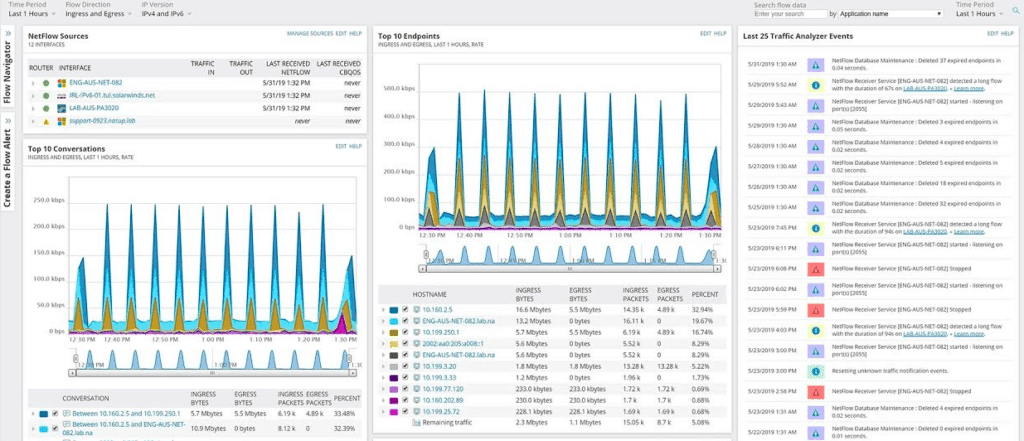
SolarWinds also offers other tools that can monitor bandwidth in large networks, such as SolarWinds Netflow Traffic Analyzer (NTA). This tool has to be used in conjunction with the SolarWinds Network Performance Monitor (NPM).
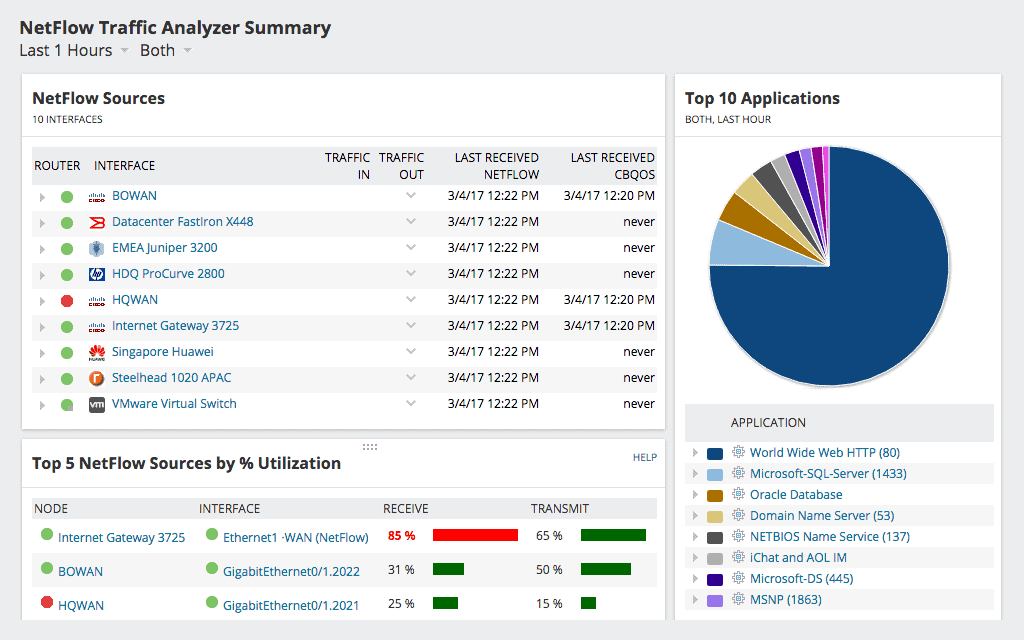
The NTA is a network monitoring tool that comes with an advanced alerting system and network insights. It allows you to monitor bandwidth and analyze the entire traffic in detail.
Download the 30-day free trial of NTA and the 30-day free trial of NPM and analyze the entire traffic of your network.
Keep Track of Bandwidth by Application
To find out which applications are consuming the most bandwidth and traffic volume in your server, you can use a network packet analyzer.
In this example, we will use one of the preferred and must-have tools of network engineers, Wireshark.
This method can be used only to monitor and analyze bandwidth on a single server. You’ll also need a basic understanding of how TCP/IP works.
Running Wireshark
Wireshark is a free packet analyzer that lets you troubleshoot your network traffic. The software is open-source and cross-platform, you can install it in Linux, Windows, macOS, Solaris, etc.
Wireshark will capture the packets coming in and going out of a specific interface from the server. It needs to be installed on the same server that you want to monitor.
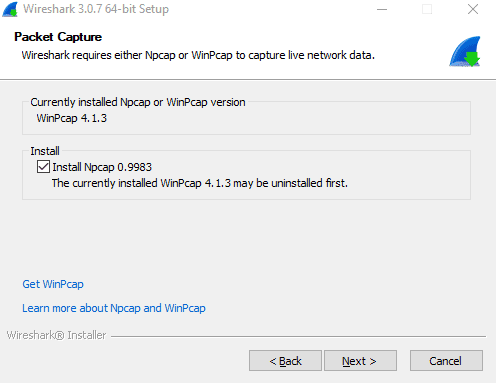
- To start with Wireshark, download the latest stable version, and install it. You will be asked to install or update WinPcap (or Npcap), which is the Windows-version of the libpcap library. This library is used to access low-level network layers. Without Npcap or WinPcap, you can’t capture live traffic.
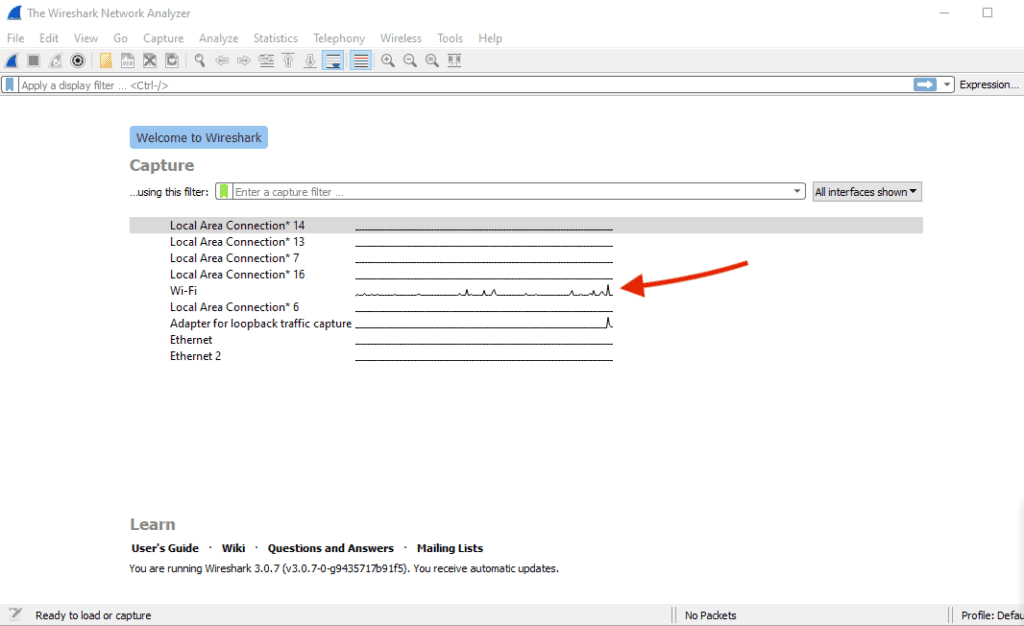
- Open Wireshark. Here you’ll need to select the interface of your Windows Server that you want to keep track of, the most popular being Ethernet (LAN) or WiFi. In the Welcome screen, Wireshark will show you what interface is currently having traffic.
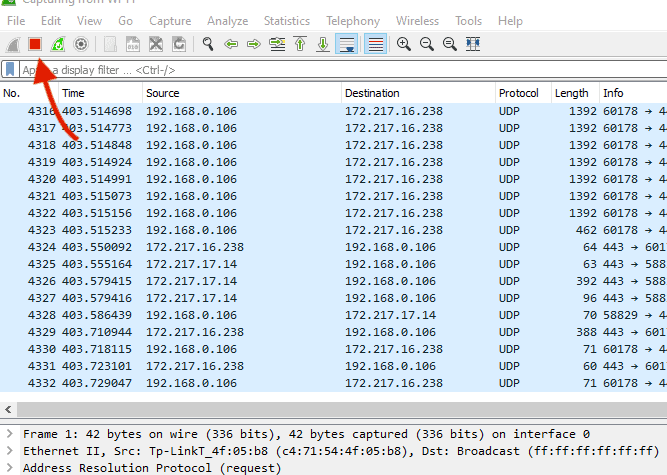
- Start an interface capture. Select the interface that you want to monitor and click “Capture.” Wireshark will start to capture every packet coming in and out of that interface. This capture might contain all kinds of packets, from UDP, TCP, DNS, DHCP, etc. It will show you all the conversations between source IP and destination IP.
In the capture, you will see, Wireshark logging every packet in real-time.
This is why Wireshark is an amazing tool for troubleshooting because you can start a packet capture when a problem occurs, and then go back and analyze details.
After some time has passed and you want to start analyzing packets, stop the capture:
Analyze the Applications that are Consuming more Bandwidth.
Once the capture is stopped, you can analyze it.
All the lines that you see on the capture are conversations between a source and destination.
Within all these conversations, we want to find the applications that are consuming the most bandwidth.
- Go to “Statistics” on the top bar menu, and then click “Conversations.”
The “Conversations” window will show you the traffic between two endpoints.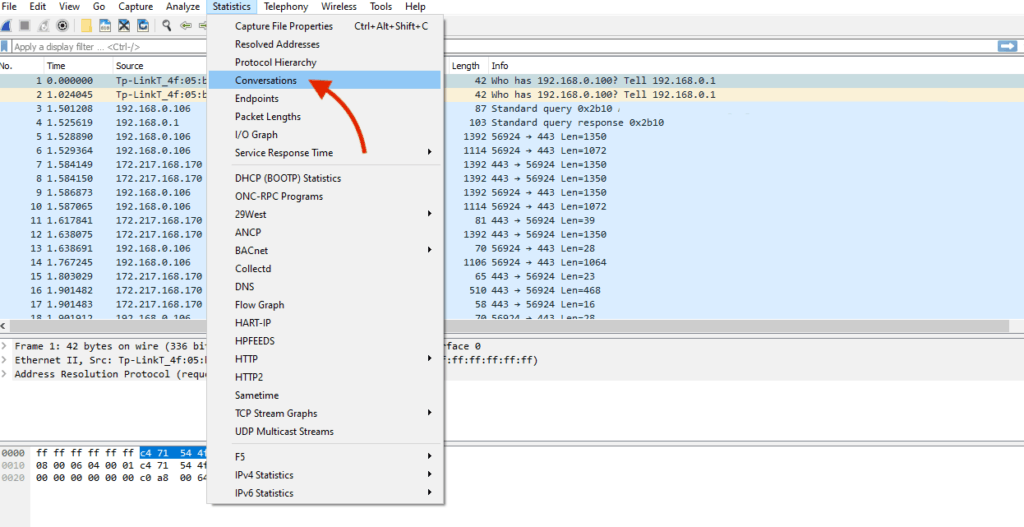 In this case, between endpoints A and B. You can see detailed information such as IP source and destination, port numbers, packet counters, byte counters, duration, etc.
 - Go to the TCP tab, and click on the “Packets” or “Bytes” column to arrange it from largest to smallest.
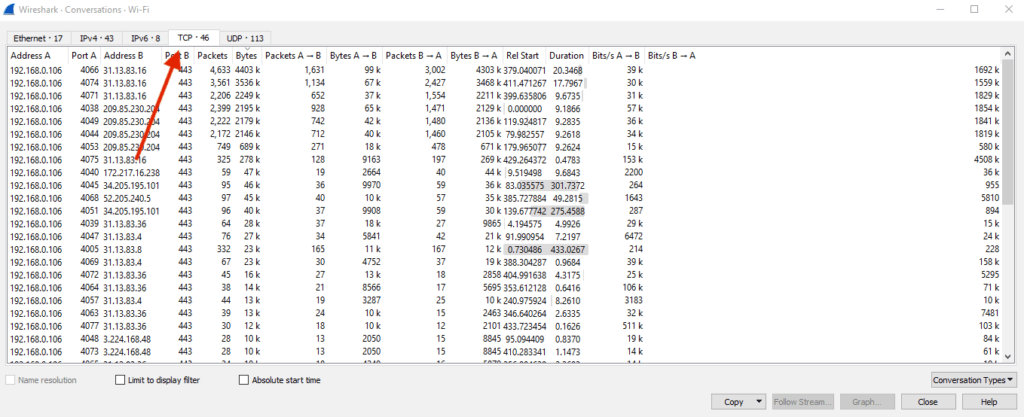
*Note that Bytes is the traffic volume, not bandwidth.
Reading the Results
In the output, you’ll be able to see the top consumers in terms of bytes or packets. To know who are those top applications, you need to learn how to read the results.
Address A (Source) is communicating through Port A to Address B (source) through Port B, and the number of packets (and bytes) for the length of the capture.
My source is 192.168.0.106 going out through a randomly generated port number towards a public address (31.13.83.16) and using the port 443 (HTTPS). This conversation is consuming the most bandwidth (4,633 packets or 4403K Bytes)
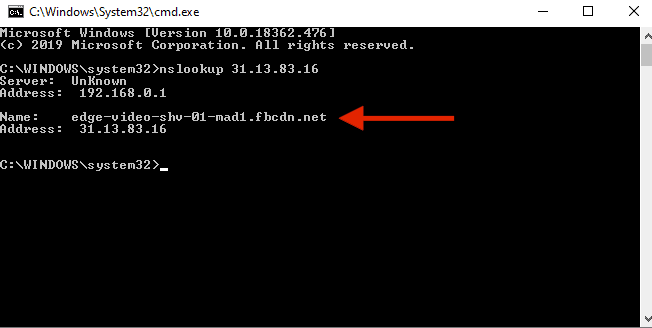
To find out more about that public IP, you can do a quick “nslookup” on the command line.
One of the applications consuming the most bandwidth is a browser (HTTPs) watching a Facebook video (fbcdn).
There are some tools that can help you keep track of the traffic generated by all servers and applications. In the following section, we will monitor the traffic between two hosts, the client and the server.
Monitor the Bandwidth Between Client and Server
Monitoring the bandwidth between Windows Client and Server is also really easy to do with Wireshark.
Open Wireshark and run a capture.
- Open Wireshark on your monitoring server or your local Windows Server.
- Select the interface that the Windows Server uses to talk to the Windows Client.
Notice that if your server is being used as an AD Domain Controller, DHCP, DNS, File Share, etc., it is very likely that this server is connected to a network switch. The welcome screen shows a summary of all interfaces in your Windows Server. Find the particular interface and perform a packet capture.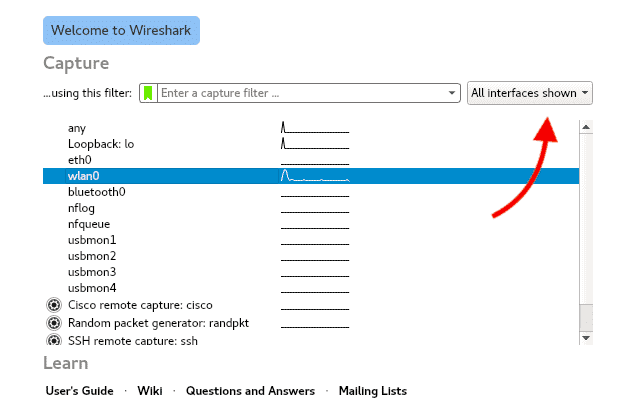
- Perform a packet capture and collect as much information as possible, this will likely include other hosts.
The Windows client that you want to monitor will be exchanging messages with the Windows Server through the specified interface. After a couple of minutes, stop the capture.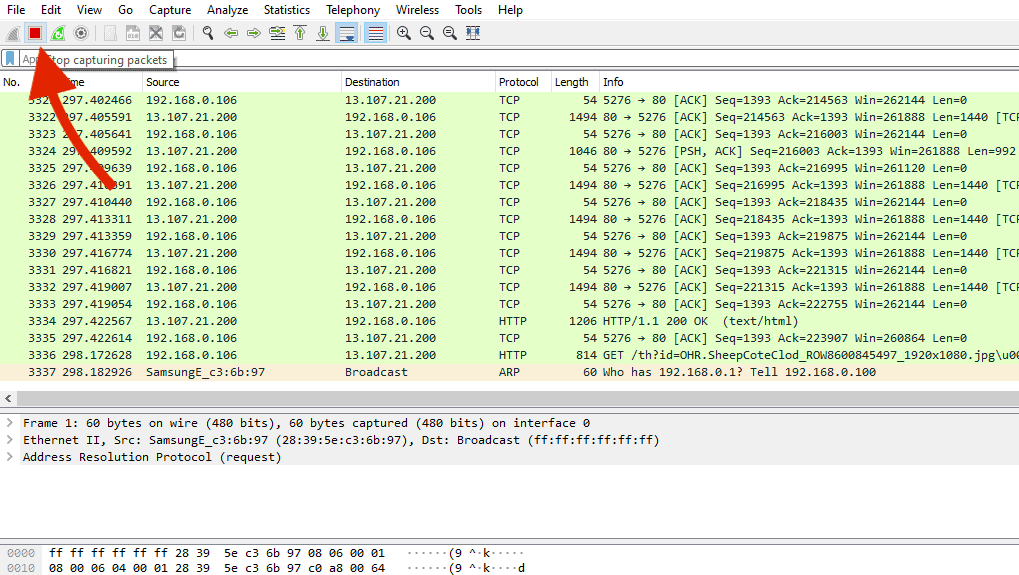
Reading the Results
Now, you will probably have lots of conversations between lots of different clients and other external servers.
How do you find the bandwidth of a specific client through all that clutter?
- Apply a filter.
You can apply a filter, such as “ip.addr == 192.168.0.1/24,” with the IP of the Windows Server that is on the local subnet, 192.168.0.0/24.
This filter will clear out all other messages with other clients, external servers, printers, etc.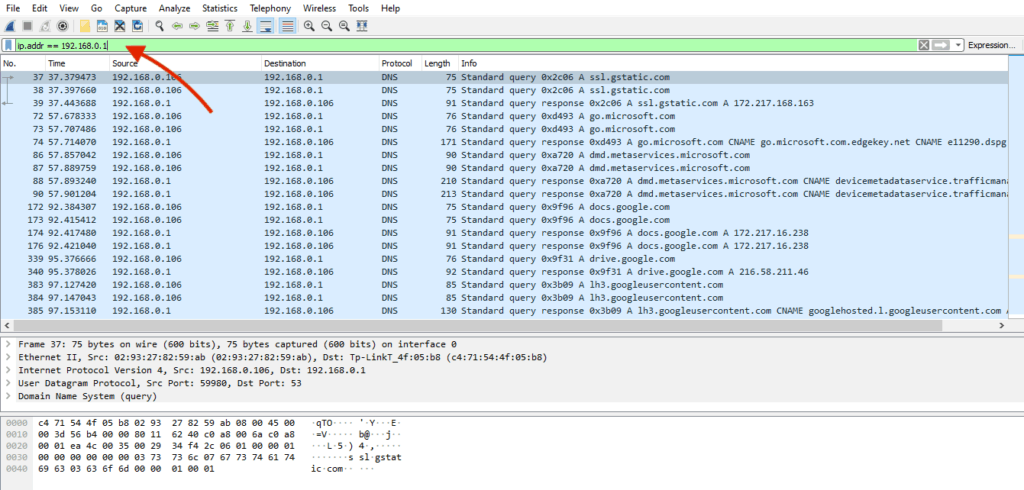
- Now, you only have conversations with the specific client and the server.
To know the traffic volume, the number of packets, and bandwidth go to Statistics > Conversations (or Endpoints).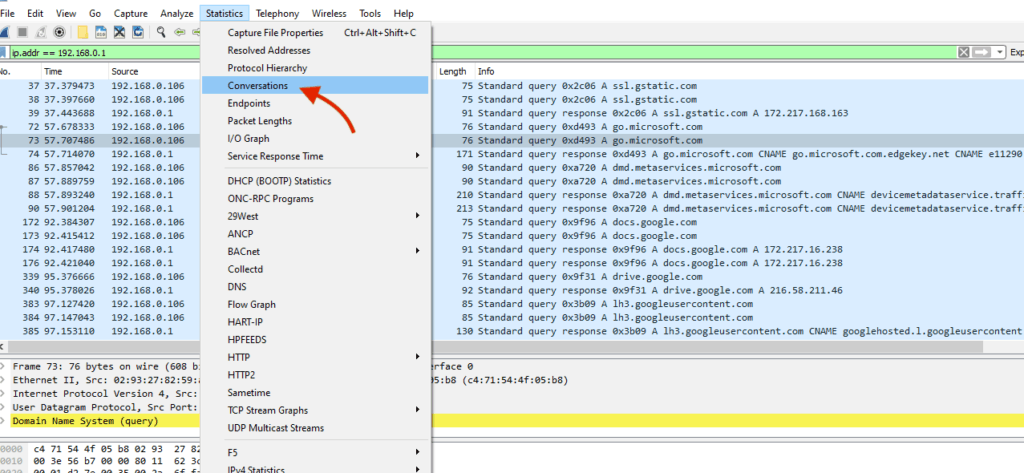
- Click on the “Limit to display filter” to take the effects from the filter into the statistics.
Go to the IPv4 tab. This window will only show information on the messages between the client and the server. In this case, there were 6741 Bytes over a duration of 241.9 (in seconds).
That would be 27.8 Bytes per second or 223Mbps.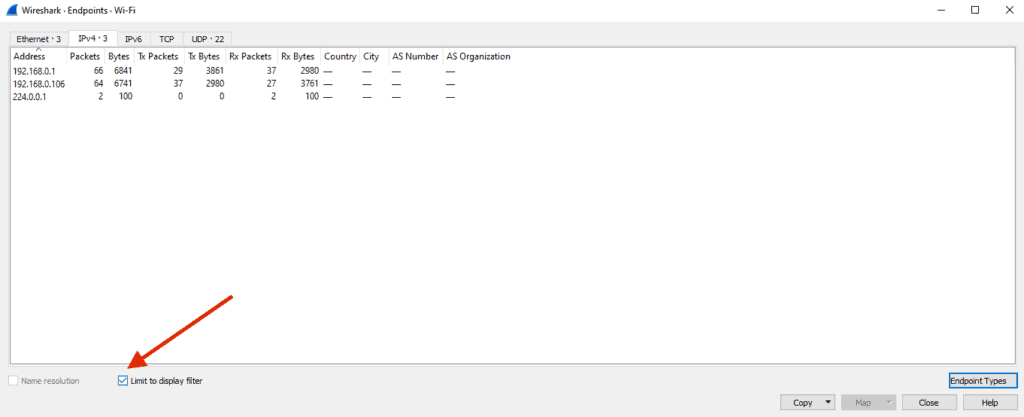
Other Solutions:
Now, of course, Wireshark is a great tool to capture traffic between source and destination and to see detailed packet information from other endpoints.
But Wireshark has its limitations. It is only capable of capturing local network traffic. In other words, it only processes packets on local systems.
But network environments are affected by a large number of variants, such as packet sizes, CRC errs, etc.
Other solutions can give you a broader view of network traffic.
Some of these use SPAN ports (or mirror port) to capture and send copies to a receiving device. These ports are usually located on a network switch.
The following are solutions that let you capture all network traffic at once. All of these offer free trials for a limited time.
- The SolarWinds Network Performance Monitor (NPM). A comprehensive network monitoring tool that allows you to detect, diagnose, and resolve network performance issues.
- The SolarWinds Netflow Traffic Analyzer (NTA) is a traffic monitoring tool that captures data from different streams of network traffic. It then takes this raw data and transforms it into easy-to-read charts.
- The NetFort LANGuardian is another powerful network traffic and security monitoring solution. With this tool, you can capture traffic flowing from the network switch and analyze it.
Measure Bandwidth Performance Between Two Endpoints.
Wireshark provides comprehensive information on TCP/UDP packets.
But still, if you want further measurements for different parameters of the TCP/UDP flows, such as bandwidth availability, delay, jitter, and data loss, you would need to look somewhere else.
Wireshark only gathers information which is useful for analyzing, but it does not creates and sends packets for testing.
iPerf is a TCP, UDP, and SCTP bandwidth performance measurement and tunning tool.
It uses the same client/server model as Wireshark, but it creates data streams that are used to measure the throughput between two endpoints.
iPerf creates a report detailed with time, the amount of data, and the throughput measured during the test. It is a great tool to determine which host is not capable of reaching the desired throughput.
Set Up iPerf
Since iPerf works as a client/server application, you would need to install it on both endpoints. In this case, your Windows Server (which is the iPerf client) and the other monitoring workstation (the iPerf Server).
iPerf Requirements:
- Both endpoints have to be connected directly or through a network switch.
- Make sure there is connectivity between both. A ping test would do the job.
- Disable or apply rules to the firewall. Security processes from the firewall might block iPerf traffic
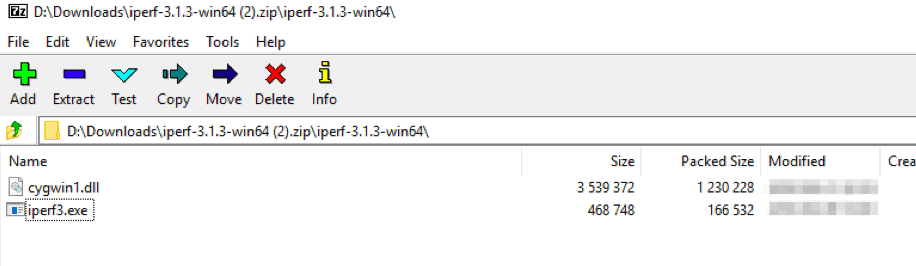
- Download and set up iPerf.
iPerf is a multi-cross platform, it can be installed in Windows, Linux, macOS, Android, iPhone, FreeBSD, and more. Download it here. - If you are using two Windows hosts (client and server), download the zip file and unzip them on both.
Test the Bandwidth Between Two Endpoints
iPerf is a command-line interface tool.
To use it, you need to open the Windows command line “cmd.” You can use the Run tool by “ctrl+R key > cmd” or You can find open it by typing “cmd” on the search bar on Windows.
As a Side Note: To avoid any permissions issues, run the cmd in the “Administrator” mode.
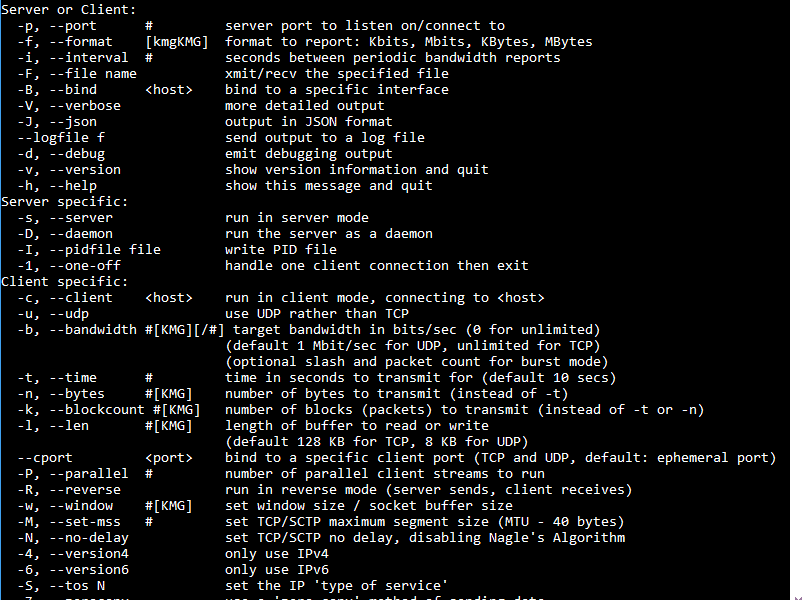
To get a full list of all iPerf commands, you can go to the installation location and use the command “C:\> iperf3.exe –help.”
Configure the iPerf Server
Go to the iPerf server (monitoring workstation), open the command line, and open the iPerf.exe installation location. To set this machine as the server, enter the command: C:\> iperf3.exe -s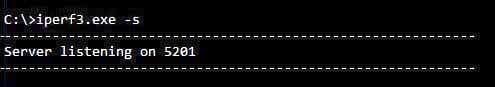
The iPerf server is now operational. But before you begin any bandwidth test, you’ll need to establish a connection with the iPerf client.
Configure the iPerf Client.
Now, go to the client (which is the Windows Server) to start the test stream.
We will assume that our iPerf server IP is 192.168.1.1. Open the “command line” in administrator mode, and input the following command:
C:\> iperf3.exe -c 192.168.1.1
This command will make the current host run in client mode and connect to the server 192.168.1.1. By default, it will initiate a test for 10 seconds, but you can change the default time by adding a -t [time] at the end of the command.
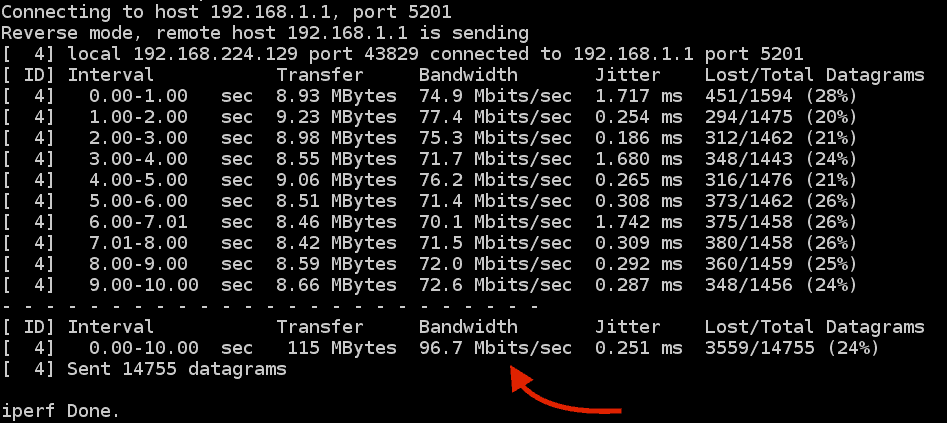
From the summary results shown on the screenshot, you can see that the total transfer in 10 seconds was 115 Mbytes with an average bandwidth of 96.7 Mbits/s and 0.251 ms of jitter.
iPerf3 comes with new features such as the Reverse test mode (-R), which changes the direction of the test – The Server sends, and the client receives.
This feature is a great way to test upload and download bandwidth.
Final Words & Conclusion
In this step-by-step guide into monitoring Windows Server Bandwidth Usage, we learned how to keep track of bandwidth in real-time with the SNMP-based SolarWinds Bandwidth Gauges.
This tool can give you graphs in real-time and send you alerts when the bandwidth goes over a threshold.
You also learned how to identify the top applications that are consuming the most bandwidth in your Windows Server with Wireshark.
With the same tool, you now also know how to monitor the traffic between the client and the server.
And finally, we used the performance monitoring tool, iPerf to measure bandwidth and other parameters between two endpoints.
iPerf is lightweight and very easy to use.
But if you want to monitor multiple Windows Servers and the entire traffic in larger networks, the SolarWinds Network Performance Monitor and SolarWinds NetFlow Traffic Analyzer are the recommended enterprise tools.
Monitor Windows Server Bandwidth Usage FAQs
How is bandwidth usage measured?
Bandwidth usage is typically measured by monitoring the amount of data transmitted over a network connection in a given period of time, such as per second, minute, or hour. This measurement can be performed using network monitoring tools or by analyzing the data transmitted over the network.
What factors can affect bandwidth usage?
Several factors can affect bandwidth usage, including the number of devices connected to the network, the types of applications and services being used, the size and frequency of data transfers, and network congestion.
How can I monitor and manage bandwidth usage on my network?
Bandwidth usage can be monitored and managed using network monitoring tools, such as network analyzers and bandwidth management software. These tools can provide real-time and historical data on bandwidth usage, as well as allow administrators to set bandwidth limits, prioritize traffic, and allocate bandwidth to specific applications or devices.
What are some strategies for optimizing bandwidth usage?
Strategies for optimizing bandwidth usage include reducing the number of devices connected to the network, prioritizing critical traffic and applications, using bandwidth management tools to control and allocate bandwidth, and reducing the size and frequency of data transfers.
Can bandwidth usage be unlimited?
In most cases, bandwidth usage is not unlimited and is subject to service agreements and network constraints. Some internet service providers may offer unlimited bandwidth plans, but these may come with restrictions, such as lower speeds during periods of heavy usage or limitations on the types of data that can be transmitted.

