
Our funding comes from our readers, and we may earn a commission if you make a purchase through the links on our website.
MetricFire vs Datadog
UPDATED: October 11, 2021
When it comes to Application Performance Monitoring (APM) Tools, the two names that you will frequently hear are MetricFire and Datadog. This article discusses what makes these two tools stand out and compares MetricFire vs. Datadog to determine which one is better.
Introduction
Your app is complete and ready to be launched! Everything has shaped up the way you wanted it to be. However, can you be sure that your app will achieve the desired SLA for uptime?
How are you boosting and tracking your revenue growth? Are you aware of how many users are using the app at any given time and what they are doing?
Too many questions with zero answers!
What you need is a platform that monitors and tracks various data in one place. Our recommendations are MetricFire and Datadog, the two most versatile tools in the market.
This article looks into each of the two APM tools, the core strengths, features, and pricing. We also make a head-to-head comparison of both applications.
What does MetricFire and Datadog do?
As an application performance monitoring tool, MetricFire is best used for tracking backend platforms and services from the standpoint of the application. It means that MetricFire is pulling metrics from the application and pulling data about uptime, latency, query speeds, and overall RAM/CPU usage of the app.
MetricFire is capable of doing much more than just infrastructure monitoring. The tool can monitor Docker, CloudWatch, Kubernetes, Redis Databases, cAdvisor, and custom data directly from your app. In addition, MetricFire can put it all in Grafana. Once done, you are all set to build data queries, dashboards, and alerts on your app data.
On the other hand, Datadog is also an all-rounder infrastructure monitoring tool that expands into an APM tracing tool. It helps to monitor your servers and perform application monitoring. Datadog is your go-to tool if you need a little bit of everything.
MetricFire Product Highlights
MetricFire is one comprehensive platform that offers system, infrastructure, and application monitoring using an entourage of open-source monitoring tools. In addition, the application uses beautiful Grafana dashboards to display your app metrics and allows you to use Graphite or Prometheus as a service.
The powerful monitoring capabilities of MetricFire help you understand complex systems with little effort. MetricFire has made significant technical enhancements on the three primary open-source services, Graphite, Prometheus, and Grafana. It has also made all three open-sourced tools as one hosted product.
With MetricFire hosted Graphite, dispensible storage is available up to three times. Additionally, increased support for automatic backup, tagged metrics, and 24/7 engineer support is provided by MetricFire.
On the other side, MetricFire hosted Prometheus bundles three times superfluity for all high fault tolerance user data in the backend with reduced sample support for five minutes and one hour. MetricFire helps you to get your business set up quickly.
Key Features
As stated, MetricFire offers its users an end-to-end infrastructure monitoring ecosystem that comprises three of the most popular open-source monitoring application services. In addition, there are also plugins for several other pre-configured open-sourced projects like Kubernetes, StatsD, and collectd. All bundled together within a single hosted environment as a single product.
MetricFire fits well into business intelligence and application monitoring, apart from a server and network monitoring, part of infrastructure monitoring.
Below are some essential features of MetricFire:
- Hosted Prometheus
With MetricFire hosted Prometheus, the tool improves the open-source Prometheus, a powerful toolkit for systems monitoring, to include several helpful features and excellent technical support for all your organizational functions.
The hosted package includes Grafana dashboards and long-term storage. You get to choose if you want your metrics for a few months, a few years, or for an infinite period. Your data is very secure since all read and write operations take place over the secure HTTPS protocol. Integration with in-house Prometheus is simply about changing your Prometheus.yml config file.
- Hosted Graphite
MetricFire hosted Graphite specializes in two things – rendering graphics for numeric time-series data and storing the same. Graphite includes a component called Carbon which indirectly listens for time-series data and is usually used with a collector agent like collectd or StatsD. However, MetricFire uses its agent, also known as hosted Graphite agent, to collect data that becomes easier than when done through third-party collectors.
The collected data is stored in a library called Whisper. It helps you in rendering on-demand graphs. MetricFire takes all the good points of Graphite and then includes all missing features to make it amazing.
With MetricFire hosted Graphite, you can control your dashboards, get actionable alerts for events through multiple channels, share them with your team, and automate or change whatever you need to do through the MetricFire APIs.
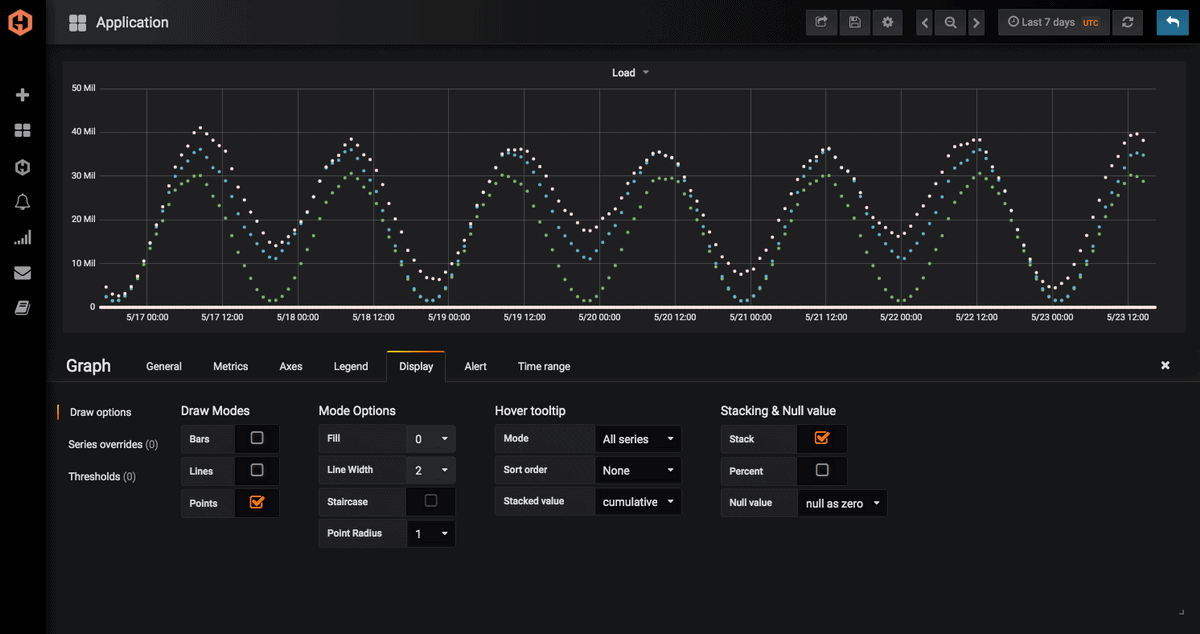
- Grafana Dashboards
MetricFire Grafana Dashboards helps you to gain more clarity of the data on feature-rich graph and dashboard editor. The intuitive interface makes it easier to create and change dashboards. In addition, you can add rows and panels, apply zoom features, and use other features to personalize your graphs as needed.
MetricFire Grafana gives access to managed servers and data storage centers. It also gives you hundreds of pre-built dashboards customized for various plugins. Regardless of the size of the plan, all MetricFire plans include Grafana dashboards.
- On-Premises Monitoring and Cloud
MetricFire offers customers on-premise monitoring or cloud monitoring for any business. You can view real-time metrics on Grafana Dashboards by using either Hosted Prometheus or Hosted Graphite. Hosted Prometheus gives you long-term data redundancy and remote data storage. The Hosted Graphite offers pre-setup APIs, excellent data integration, improved collector daemons like Hosted Graphite Agent, and alerting. All metrics are displayed on the intuitive Grafana Dashboards.
Datadog Product Highlights
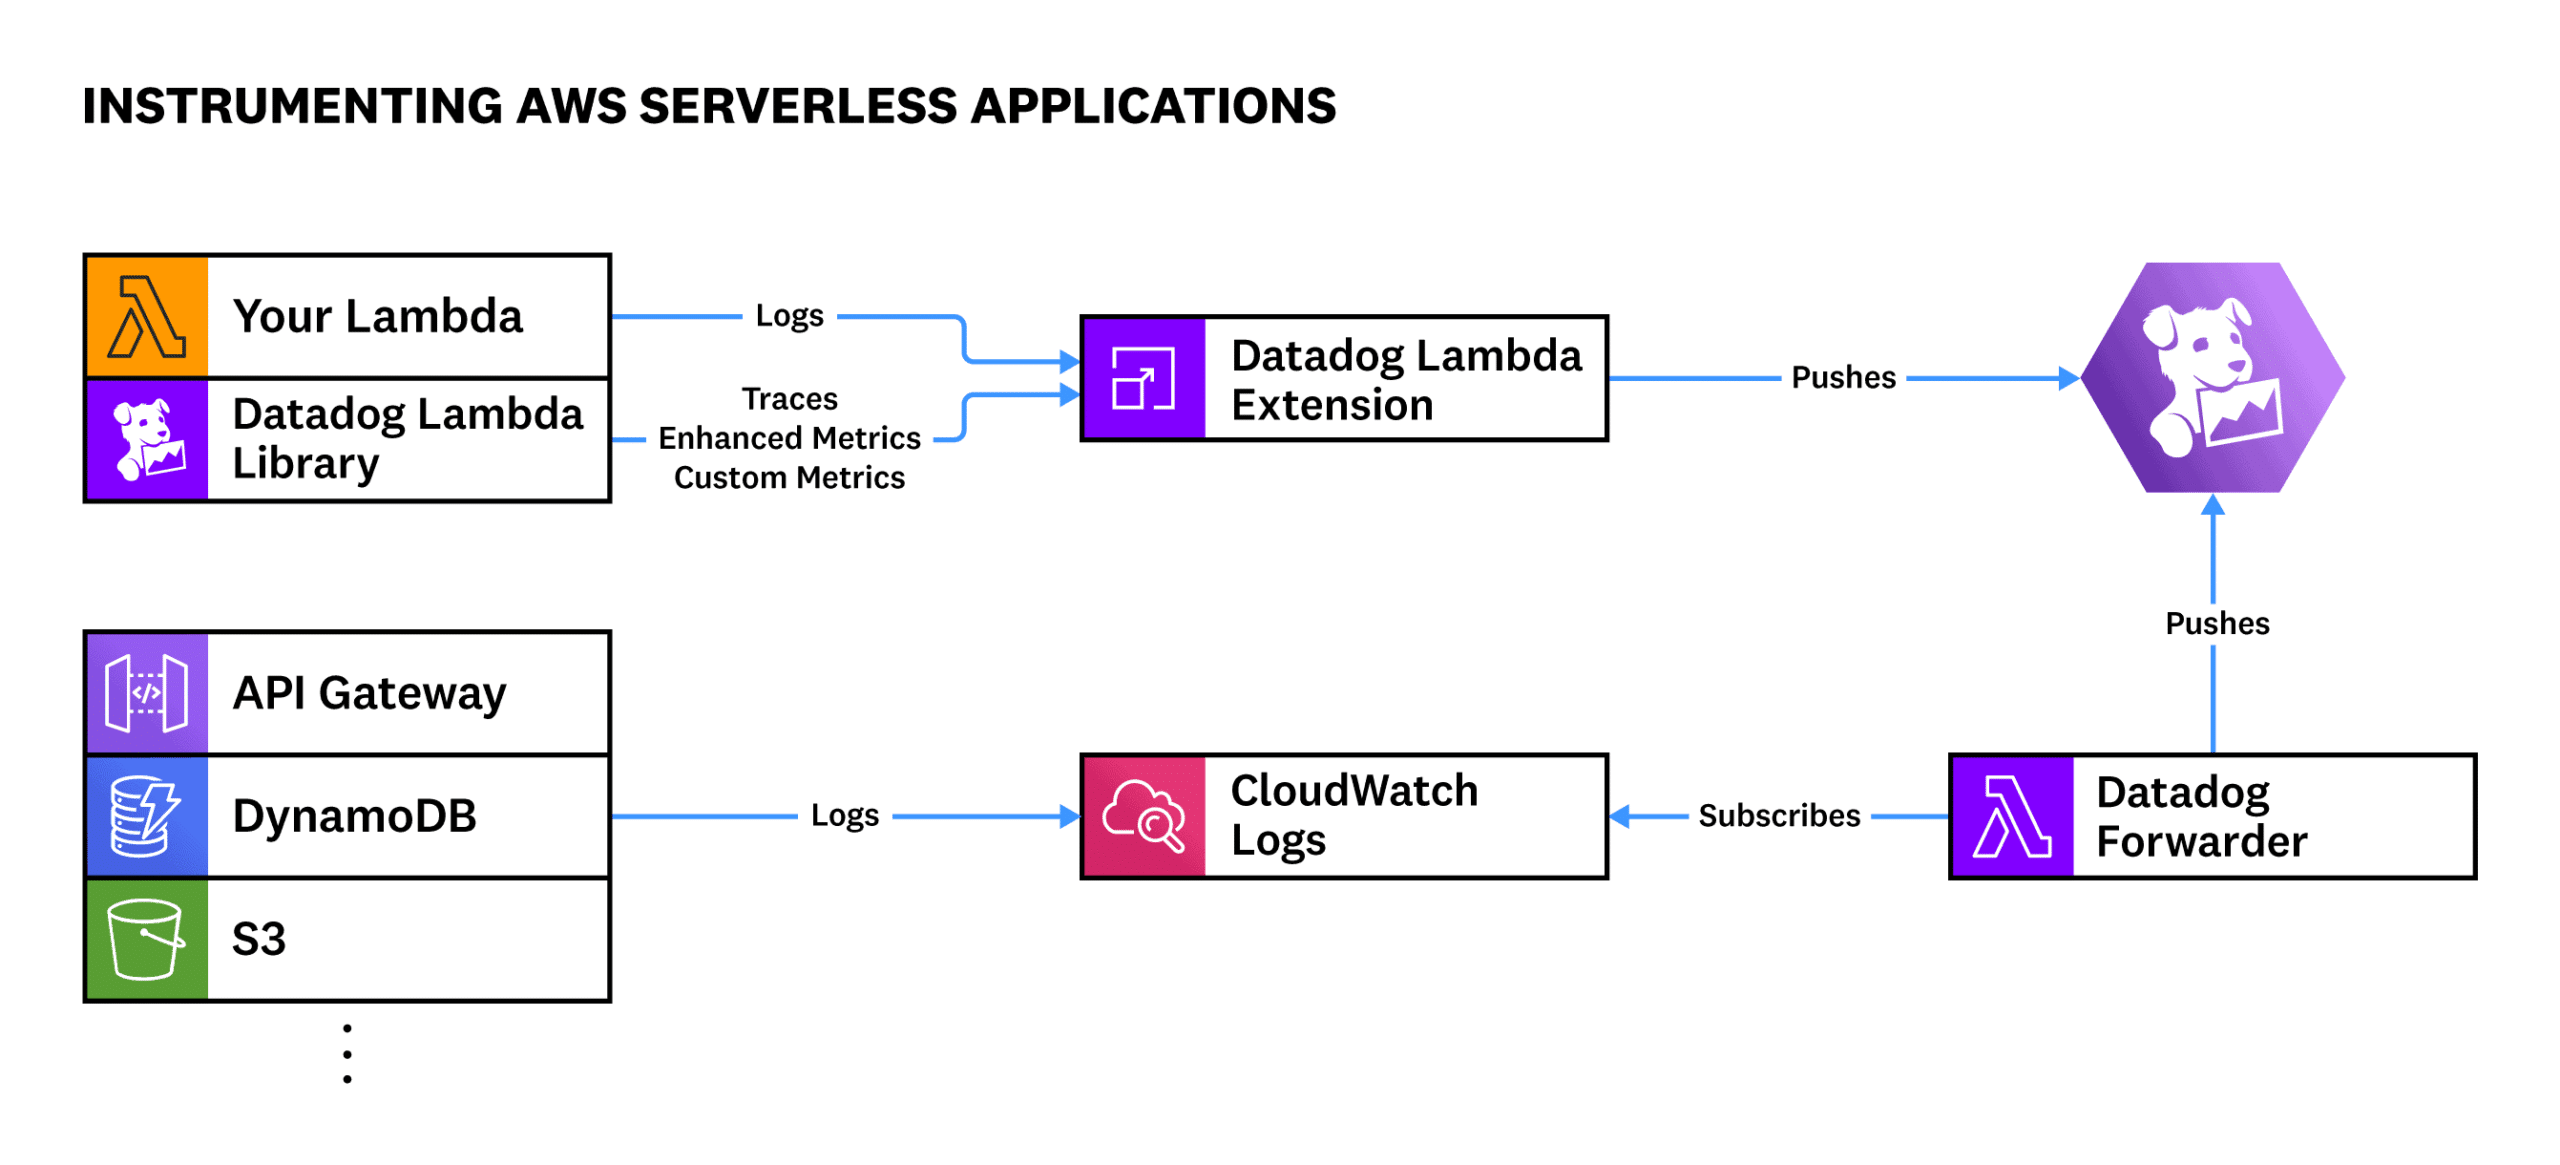
Datadog is an analytics and monitoring tool for DevOps teams, information technology (IT) teams, and security engineers to monitor cloud services and infrastructure and determine performance metrics. It started as an infrastructure monitoring tool and expanded its boundaries as logging, tracing, and an APM tool.
Datadog can help you monitor such services as databases, servers, and tools. The monitoring software is available for implementation as a Software as a Service (SaaS) or on-premise. Datadog supports Linux, Windows, and Mac operating systems. It also provides cloud support for Google Cloud Platform, AWS, Microsoft Azure, and Red Hat OpenShift.
Datadog backend is made from Kafka, Apache Cassandra, and PostgreSQL. The tool uses a Go-based agent. REST application programming interface (API) is deployed for allowing Datadog to merge with several tools, services, and programming languages such as Ansible, Kubernetes, Chef, Puppet, Bitbucket, and Ubuntu.
The user interface of Datadog comprises dashboards that can be personalized and show you graphs composed of multiple data sources in real-time. In addition, Datadog can also send notifications to users on performance issues of any set metric like compute rates. Users receive such information via email, PagerDuty, or Slack.
Key Features
Datadog is used across different industries and businesses of all sizes to enable cloud migration and digital transformation. It also takes care of the operation, security, and business team.
It drives collaboration among development, accelerates time to market for applications, understands user behavior, secures applications and infrastructure, reduces problem resolution time, and tracks key business metrics.
Given below are the Datadog features:
- Datadog provides a DevOps or an IT team with a single view of their infrastructure (Servers, metrics, apps, and other services)
- Full API access
- Datadog provides sampling intervals of 10 seconds
- Datadog has got 80+ turnkey integrations
- Datadog supports over 250 product integrations
- Can automatically collect and analyze latency, logs, and error rates
- Datadog supports applications written in languages such as Python, Java, PHP, .NET, Ruby, Node, and Go
- Datadog allows for full access to the API
- Datadog provides alerts based on critical issues
- Datadog can slice and dice graphs and alerts
- Customizable monitoring dashboards
- Clean graphs of StatsD
MetricFire vs Datadog – Key Differences
Fundamentally, MetricFire and Datadog have different approaches to their identities. MetricFire is built on open-source Prometheus, Graphite, and Grafana, which means there is no such thing as vendor-locking. On the other hand, Datadog is an agent-based monitoring tool that can easily plug into any infrastructure or tech stack.
Μain differences between MetricFire and Datadog
| MetricFire | Datadog |
|---|---|
| MetricFire is supported by a host of monitoring agents, including Graphite | Datadog monitoring agent is the core of their service |
| MetricFire is built on open-source monitoring tools, including Prometheus, Graphite, and Grafana | Datadog is an agent-based monitoring tool that is easy to plugin |
| MetricFire specializes in scaling custom metrics | Scaling is not a strong point of Datadog |
| MetricFire customization is easy with hundreds of plugins or integrations | Datadog customization has a lesser number of integrating options |
| MetricFire installation is not as fast as Datadog | Datadog is quick to install |
| MetricFire has an easy-to-use rendering API to provide access to stored data | Datadog has full access to API however access to stored data is not easy |
| MetricFire has hosted service for the dashboard and alerts | Datadog has a dashboard and alerting service built into the website |
| MetricFire has excellent visualization options through Hosted Grafana Solutions | With Datadog, the visualization options are not as cool as Grafana |
| MetricFire provides Prometheus querying interface through Hosted Prometheus offering | Datadog has no such querying interface |
| MetricFire with Hosted Prometheus offers excellent Kubernetes monitoring metrics | Datadog offers Kubernetes monitoring metrics that are agent-based but not in the same style as Prometheus installation |
MetricFire vs Datadog: Head To Head
User Interface
When it comes to the user interface, Datadog has an in-built dashboard and alerting system on the website. However, MetricFire overpowers Datadog on visualization. The same is hosted on MetricFire through the hosted Grafana solution.
MetricFire also has the support of many other graphing tools and an easily accessible rendering API to provide access to stored data using the complete functionality of Graphite. In addition, hosted Graphite gives access to Graphite Render API and controls the most powerful dashboard service, Grafana.
The benefits don’t end there. MetricFire also provides the Prometheus querying interface, The Prometheus Expression Browser, right inside the app.
Installation
Installation is fast and quick in Datadog, but you have to use the Datadog monitoring agent, which is the core of their service. In addition, the configuration options in Datadog are limited.
With MetricFire, the picture is different. Several monitoring agents support graphite. Many services have Graphite reporting built-in. It is extensively supported. Hosted Graphite provides a monitoring agent which can be installed quickly using the custom script. Any Graphite compatible agent can be used to send data to Hosted Graphite.
Reports
Though the Datadog metric is as good as MetricFire Hosted Graphite metrics, the hosted Graphite metrics are nine times as good. The simple reason for this is Graphite metrics provide data views, different ways of looking into the same reports.
While Datadog supports StatsD, MetricFire does the analysis itself and provides you with a set of different aggregation methods for every metric stored with them. It means that you can decide if you want to check the reports for average, max, or even the 90th percentile values when making the graph. Furthermore, all this activity can be performed without setting up in advance or storing a particular metric.
Plugins
Datadog runs their service by itemizing every feature they have. Datadog supports more than 250 product integrations. While MetricFire is built on open-source Prometheus, Graphite, and Grafana, which means there is no vendor lock-in. It means you can easily customize your MetricFire account with hundreds of plugins or integration available in the open-source communities.
OS Support
MetricFire supports the following stable OS releases on 64-bit machines:
- Debian Wheezy and later
- Ubuntu 12.04 LTS and later
- CentOS 6 and later (Covers the RedHat family)
This covers most of Amazon Linux, RHEL, CentOS, and Ubuntu/Debian family platforms. On the other hand, Datadog supports Linux, Windows, and Mac operating platforms.
Support
With MetricFire, the support level is very robust. It is a support system for engineers, by engineers. MetricFire offers support options, including 24/7 phone, email, and chatbot technical support to assist users with any troubleshooting.
Datadog customer support also has a security response team that works throughout the hour throughout the year. The modes of communication are chatbots, email, and over phone technical support.
Both the applications have a community forum from where you can seek guidance if need be.
Cost
MetricFire sells bulk metrics, and you do whatever you want to do with them. The rate is low, and you can build a personalized monitoring system for your products.
| MetricFire Yearly Plans | |
| Large Annual | $1,599 (Per month billed annually) |
| Growth Annual | $1,099 (Per month billed annually |
| Startup Annual | $429 (Per month billed annually) |
| Basic Annual | $85 (Per month billed annually) |
| MetricFire Monthly Plans | |
| Large | $1,895 (Per month billed monthly) |
| Growth | $1,299 (Per month billed monthly) |
| Startup | $499 (Per month billed monthly) |
| Basic | $99 (Per month billed monthly) |
Datadog’s per-host pricing is fixed. It has some leeway for custom metrics and containers. However, you pay what you pay. While Datadog appears low cost, it can become expensive, speedy.
| Datadog Pricing Plans | |
| Pro | $15/host/month |
| Enterprise | $23/host/month |
| APM and Distributed Tracing | $31/host/month |
| Trace Search & Analytics | Starts at $1.27/million trace |
| 7-Day Retention | $1.27/million log events/month |
| 15-Day Retention | $1.70/million log events/month |
| 30-Day Retention | $2.50/million log events/month |
Note: Free trial is available for both MetricFire and Datadog
MetricFire vs. Datadog: The Verdict
While looking for an application performance monitoring tool, always look at the business metrics, in-game user metrics, and infrastructure metrics.
MetricFire is an excellent tool because it is made for scaling without any complexity and exorbitant prices. With MetricFire, time-series metrics can be scaled with cost-effectiveness and limitless possibilities. You can collect time-series data from your application on anything. The tool is unbeatable for application observability.
Datadog helps you observe apps, streamlining how you monitor stack apps and gives you complete visibility over modern applications. With Datadog, you only need to keep track of significant updates, correct code configurations, and scheduled operations.
If you are looking for an open-source, comprehensive performance monitoring tool that offers system and infrastructure monitoring along with visually stunning Grafana dashboards for app metrics, then go for MetricFire.
However, if your requirement limits you to opt for an all-rounder infrastructure monitoring tool that also expands into an APM tool, then Datadog is your go-to product.
Eventually, what matters is the nature of the demand and the cost to the pocket.

