
Our funding comes from our readers, and we may earn a commission if you make a purchase through the links on our website.
ManageEngine OpManager Review
UPDATED: October 23, 2023
Do you wish you can see everything in just one application? In the world of computing and networking, this is necessary in infrastructure to keep an eye on your network performance, latency, quality, and threats.
If you are managing a network of computers, servers, routers and other network devices, you surely have a lot of monitoring tools to pull up to have an overall visibility of your network’s performance.
For example, an NOC engineer may need to open multiple applications and use several desktop monitors to display everything just to make sure nothing is missed, because as we know, a slight network problem can lead to other issues down the line.
Now, back to the question. “Do you often wish you can see everything in just one application ?” What if this is possible and you can try it out with a free evaluation? Yes, this network monitoring solution is made available with ManageEngine OpManager. And you can try it for free to check if it suits your needs – but we can guarantee that it does.
But before you jump into the trial edition, this article will give you an overview and review of OpManager and its endless possibilities.
Download OpManager Free Trial!
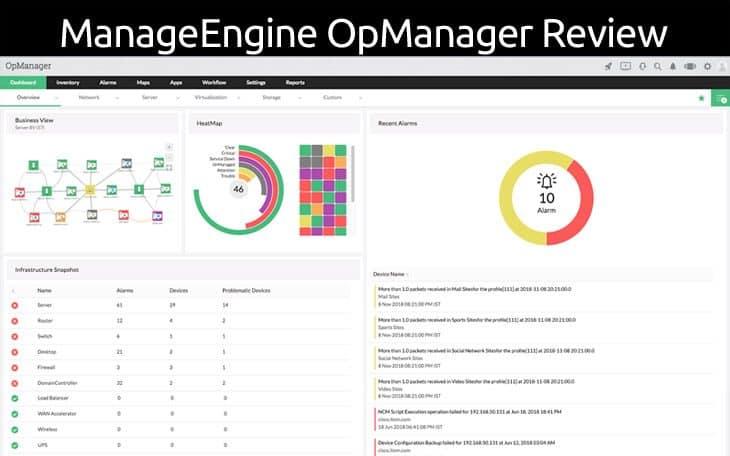
Here's the Main Features, Editions and Requirements of OpManager in Review:
First, lets breakdown what OpManager really is and what it is meant to do. OpManager is a Network and Server Monitoring software that can provide the following features and functionalities:
- Network Management
- Server Management
- Network Traffic Analysis
- Network Configuration Management (NCM)
- Switchport Mapping (SPM) and IP Address Management (IPAM)
- Fault and Data Center Management
Let’s discuss it one by one so you can take a peek into how OpManager performs and delivers quality monitoring of your network and provide service desk features as well.
Network Management & Monitoring Features
A common misconception in managing a network is that when everything is done right the first time, it does not mean that the network will not experience any downtime or suffer by performance.
1. VoIP Monitoring
Fast detection of VoIP problems can save you a big deal of a headache and time to restore call quality. With OpManager, you can monitor packet loss, RTT, jitter, latency, and MOS (Mean Opinion Score), all within a single page.
Call location can also be learned through OpManager’s VoIP Monitoring page. OpManager uses Cisco IP Service Level Agreement (SLA) to calculate and measure VoIP RTP packets.
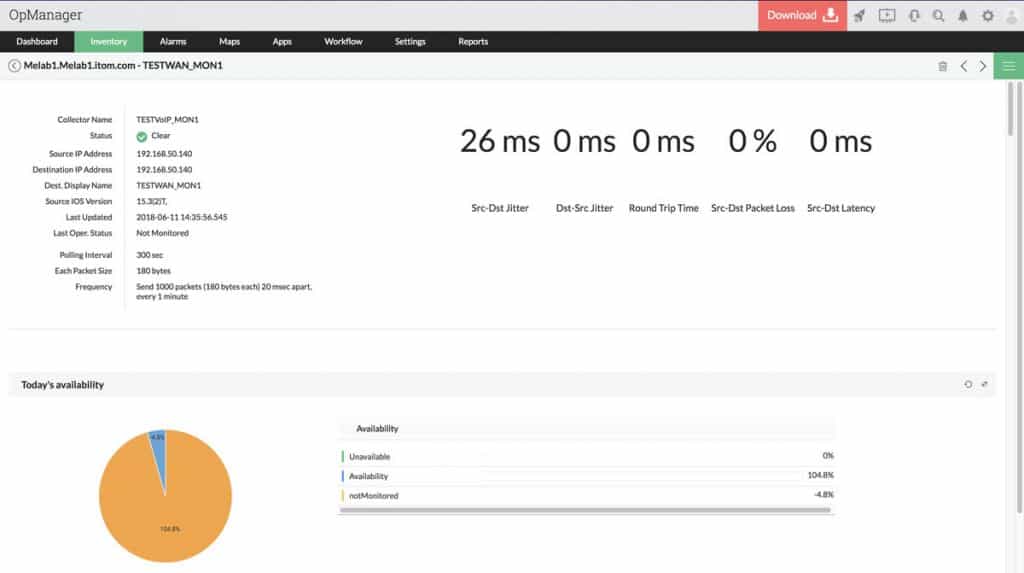
VoIP packets that traverse within a WAN infrastructure and over the cloud can defer as it goes through a number of hops. OpManager provides a clearer view of VoIP QoS in graphical representation for quick analysis. Once a problem is discovered, it will easily give you information on which part of the call suffered for fast call quality recovery.

2. NCM Capabilities
Is your enterprise or network geared towards scalability? You'll find the NCM feature of OpManager very useful and seamless when dealing devices from different vendors and manufacturers.
Network Configuration Management (NCM) is a system that introduces the process of configuration, inventory, and change on both hardware and software within a network. OpManager automates the long and repetitive task of deploying configuration and scripts on thousands of devices inside a network infrastructure.
It offers the advantage of Zero Touch Provisioning with just a Click, hence eliminating the possibility of human error.
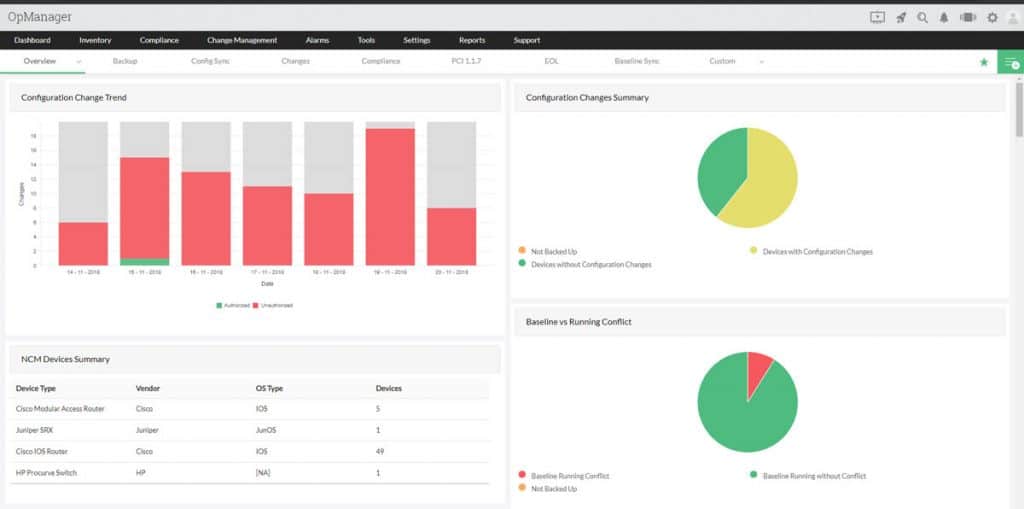
If you are wondering what can you get from OpManager for your NCM requirements, here they are:
- Schedule configuration backups and restoration
- Real-time monitoring and audit on hardware, software and config changes and who performed the action
- Automation of manual configuration changes and provisioning
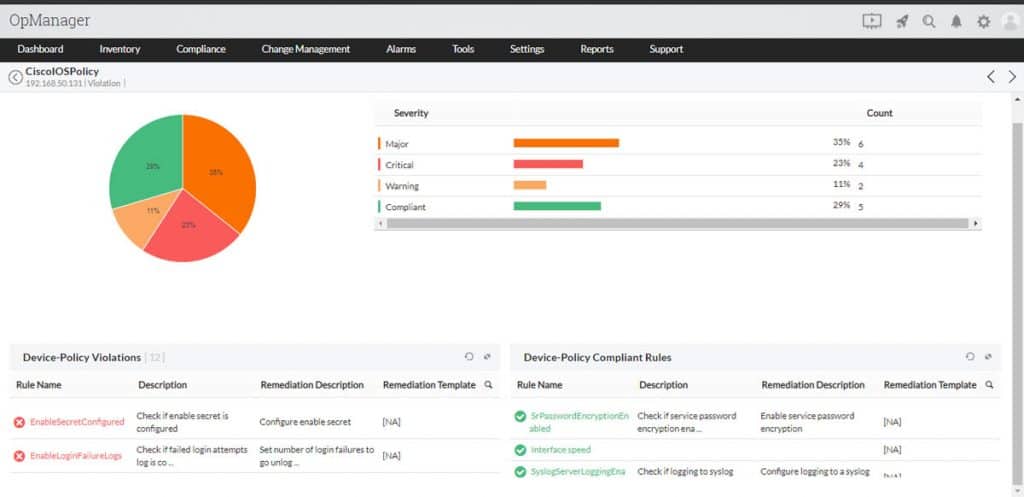
- Device policy violations and compliance
- Comprehensive NCM reports
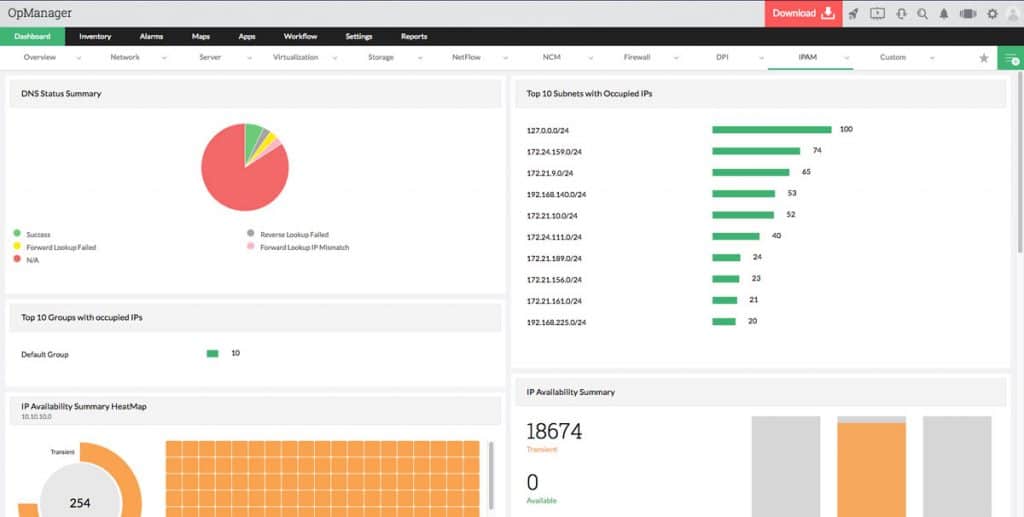
3. IP Address Management (IPAM) for Routers/Switches
Tired of recording your device and IP inventory on a database or spreadsheet? IP Address Management (IPAM) and Switch Port Mapping (SPM) addresses this boring task and it is made even better under OpManager.
It provides you a complete inventory of your IP address and which device it is mapped to including the MAC Address, DNS and which port on your distribution switch it is connected for easy tracking of devices in case a network issue arise. It will also give you real-time information on the mostly occupied subnets and total IPs: Used, Transient and Available.

Related Post: Best IPAM Software for IP Address Management
4. Cisco Monitoring – AVC, NBAR and IPSLA Monitoring/Reporting
If you have Cisco devices deployed within your network, whether existing ones or out-of-the-box devices, you can utilize OpManager to monitor the performance, traffic, firewall, configuration and switch port management.
In terms of performance, OpManager has a built-in system to monitor memory and CPU utilization, packet drops, CRC errors and more. It also makes use of UCS Manager XML API to monitor blade servers and VMware monitoring for VMs.

OpManager supports a wide array of Cisco devices. So, if you have Nexus, ASRs, Catalyst switches and UCS platforms, that runs IP SLA, AVC, NBAR, Netflow and more of Cisco technologies, this might be the right monitoring software for you.
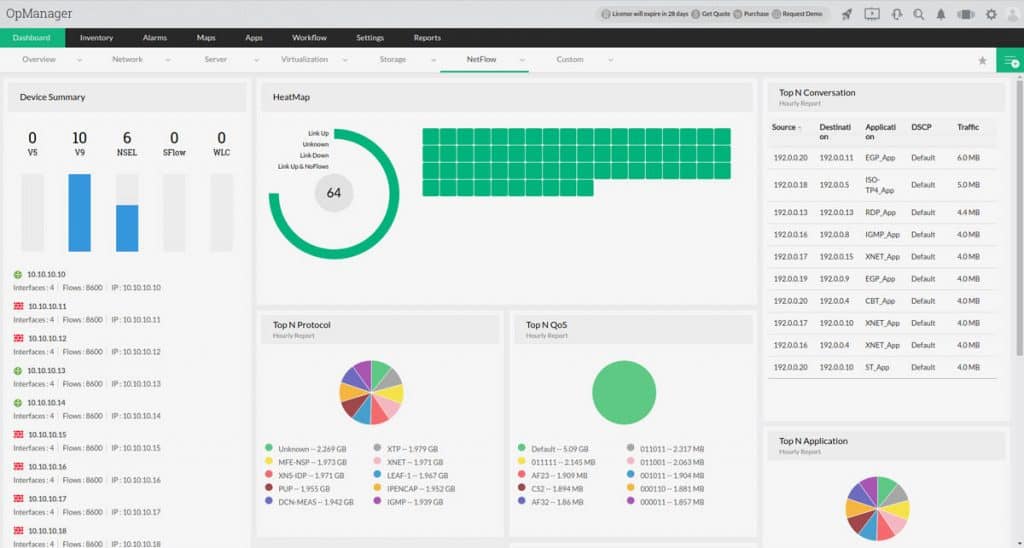
5. Bandwidth & Netflow
Is your network constantly experiencing congestion and you are often left puzzled on what is causing it to be so slow, in terms of file transfers and accessing resources within your network? Your monitoring system could certainly show you when it is happening like peak hours or a DDOS attack.
But what if you can resolve the problem straight from your monitoring software without jumping to another application?
Bandwidth/Traffic Monitoring
OpManager is an easy-to-use bandwidth management software that can give you a visual analysis of traffic and bandwidth usage which includes NetFlow, sFlow, IPfix, jFlow, QoS, CBQoS, Billing, Attacks and more.
Apart from traffic monitoring, it also gives you a visibility of your wireless network with its WLC module, listing up the top users according to WLAN SSID, the wireless device used and accessed application.
6. Do-it-Yourself Deployment
Yes, DIY your own network. Back in the days, deploying devices in a network requires manual intervention by physically installing and configuring the devices to connect to the network. Consider yourself lucky to be in the era where Zero Touch Provisioning (ZTP) addresses the top concern of network management.
OpManager can discover up to 5000 devices in just a minute! It discovers all devices within an IP range using ICMP, SNMP (V1, V2, and V3), WMI and Telnet. Not only that, OpManager can readily collect the device name, type, operating system, configurations and more details. It offers Automatic Layer 2 and Network Mapping, and Automatic Discovery.

Server Management
Let’s turn our page to server management. OpManager is not only incredibly useful in terms of network monitoring but also shows high potential when it comes to server health and performance monitoring. All faults are detected in real-time and notifications are triggered to alert the service desk for quick action.
OpManager has the capability to provide system administrators with the below tools for monitoring and troubleshooting server faults:
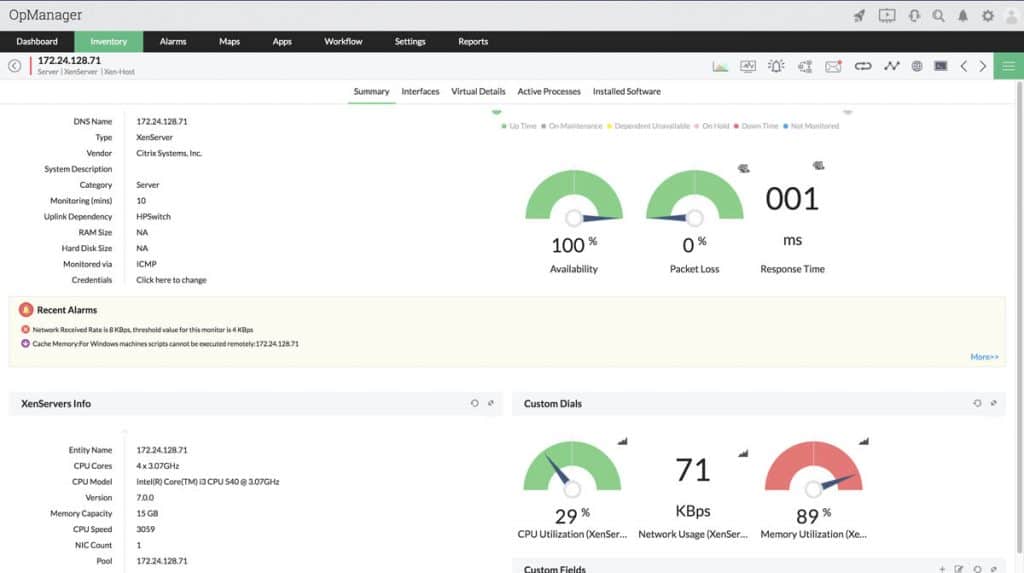
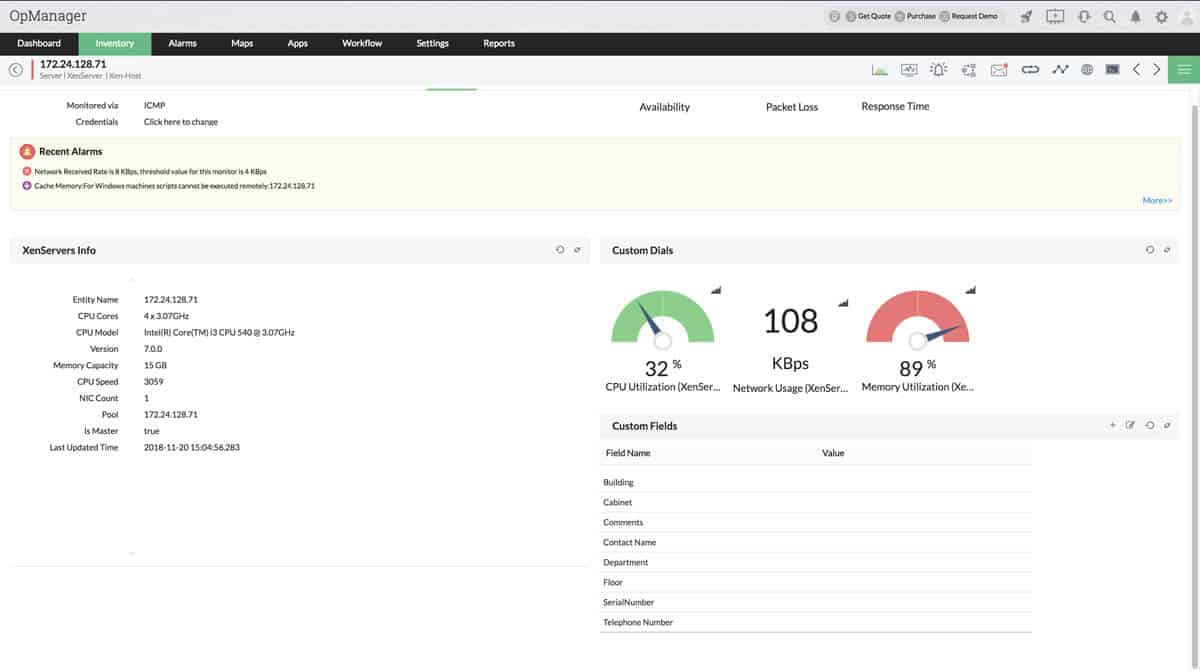
1. Citrix XenServer Monitoring
OpManager utilizes Xen API for the discovery of XenServers. It only needs to detect the host to discover the VMs, SRs and Storage Repositories connected to it.
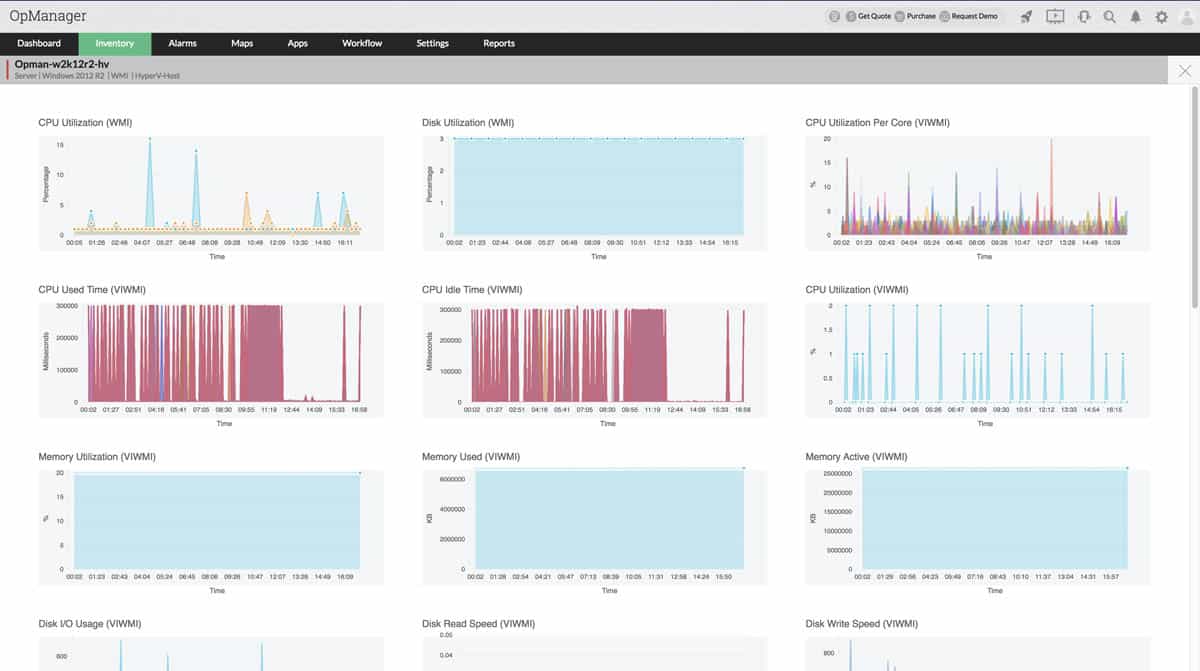
2. Hyper-V & VMware Monitoring
As a part of virtualization hosted by OpManager, you can monitor and classify Microsoft Hyper-V devices using WMI for discovery and real-time monitoring of Live Migration for resource allocation.
With Hyper-V and VMware Monitoring, OpManager will provide you with full health monitoring of CPU, Disk, Memory and Network of both host and guests.
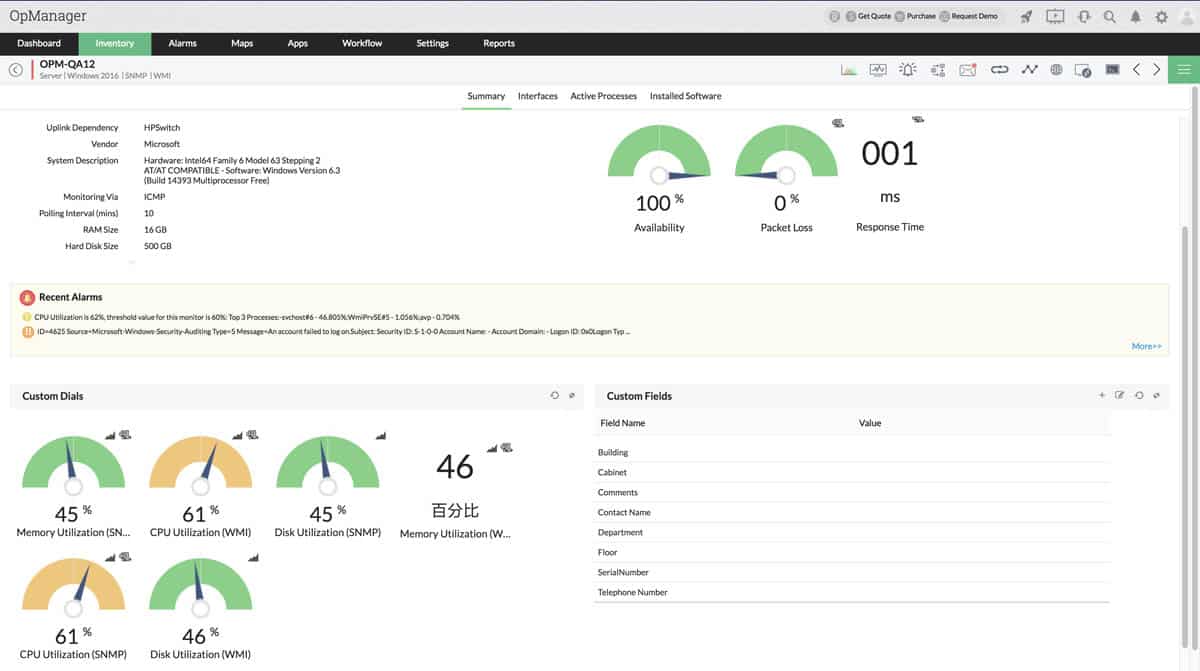
3. Hardware Health/Failure Monitoring
System health monitoring is one of the main features of OpManager. You can monitor critical servers based on its memory, disk and CPU metrics by specifying thresholds.
A server health report is also available in provides a detailed performance of the server and verify the CPU and memory utilization trends to quickly diagnose the problem and address the root cause.
You can also configure custom monitors according to the server parameters you wish to monitor.
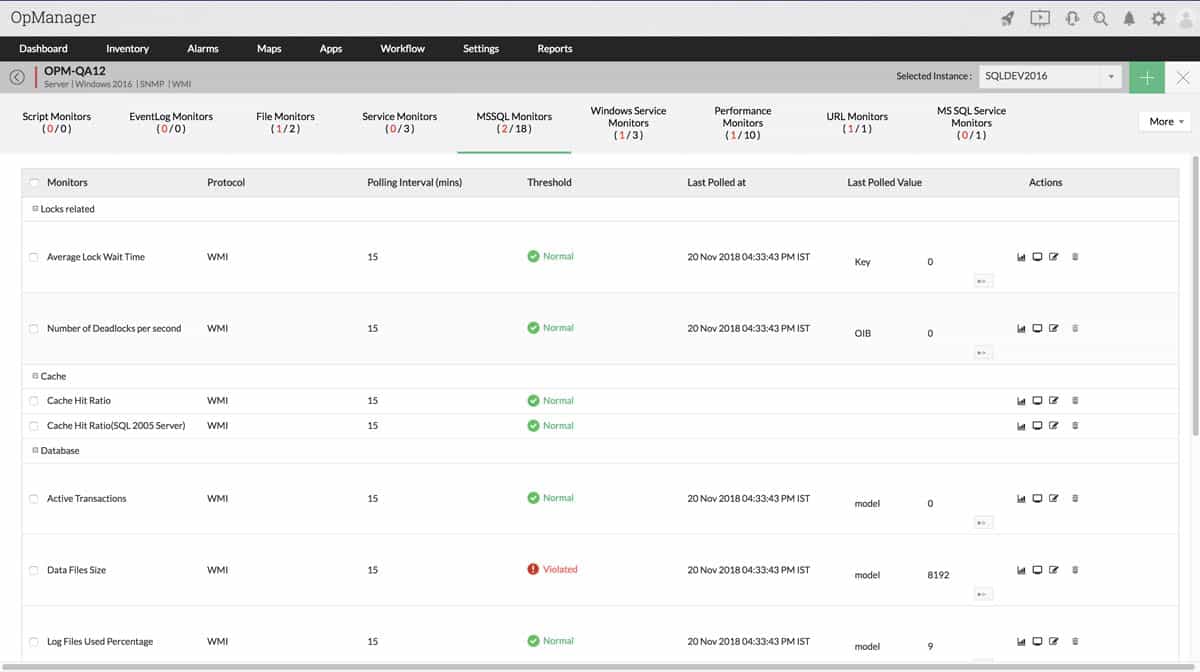
4. MSSQL Monitoring
Need a tool to monitor MSSQL? Guess what, OpManager has this feature built into it as well! OpManager provides Database Monitors and MSSQL services with a simple and easy-to-read MSSQL dashboard for your SQL servers.
It can detect a change in data file size, locks that cause delays, buffers and cache/memory related errors.
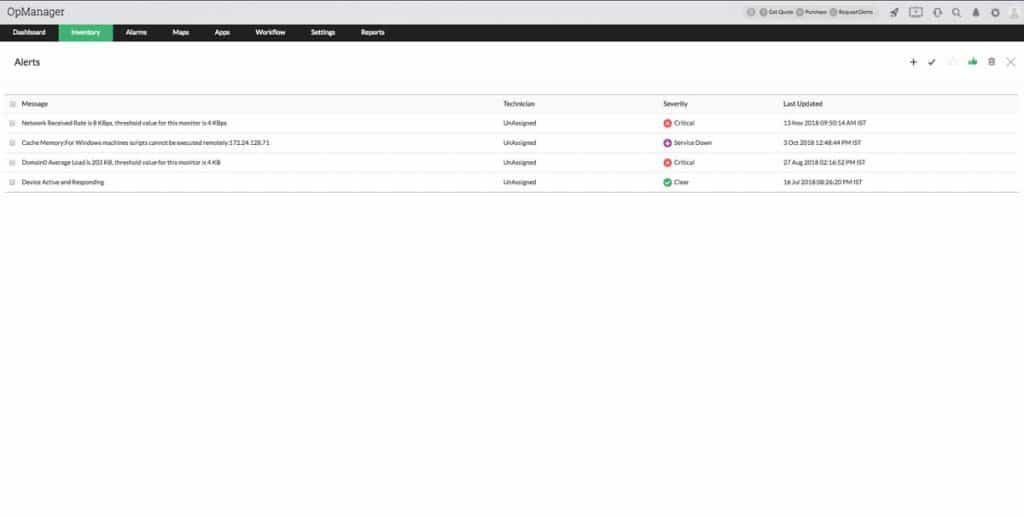
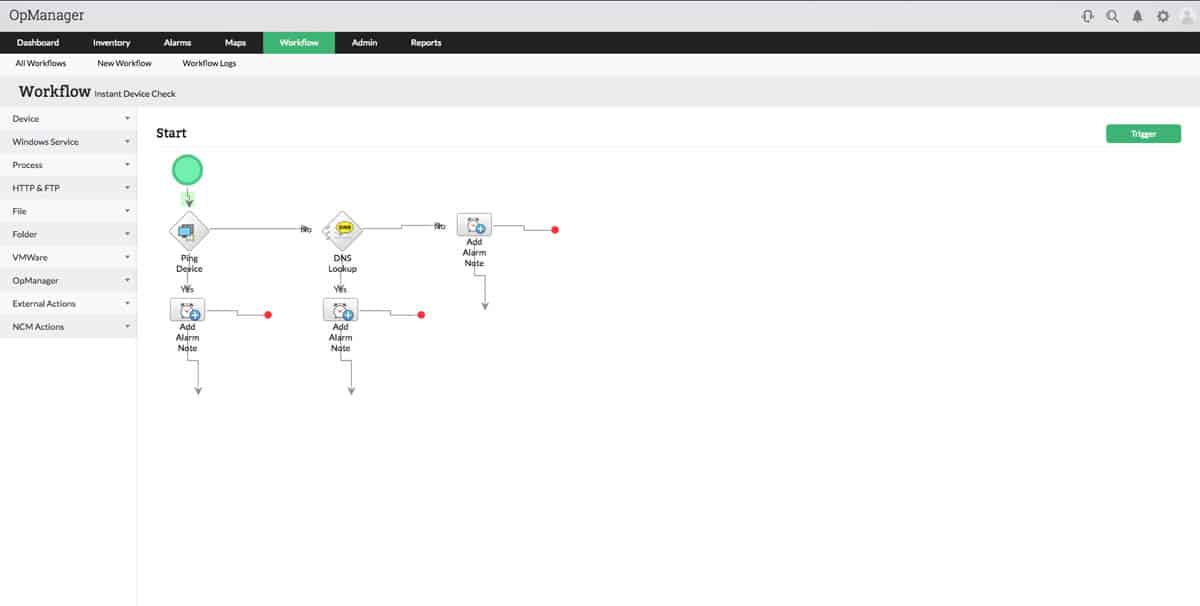
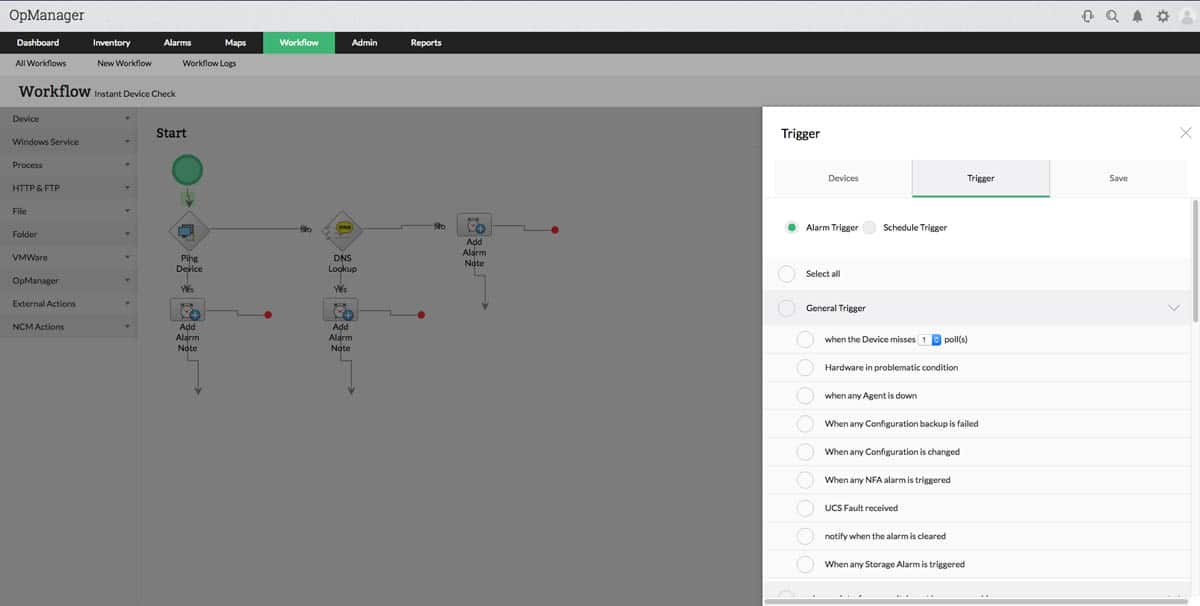
Fault Management
OpManager’s Fault Management solution comprises networking and IT workflows to follow in the event that an unforeseen fault happens. You can assign the trigger point to activate the workflow in case the assigned parameters are encountered.
You can manage alerts, notifications, logs monitoring, reporting, and SLAs.
OpManager can also be integrated with your helpdesk as well. It has an add-on product which is ServiceDesk Plus that is mapped with the thresholds set under OpManager. Conveniently create and assign trouble tickets to respective departments or technician for resolution.

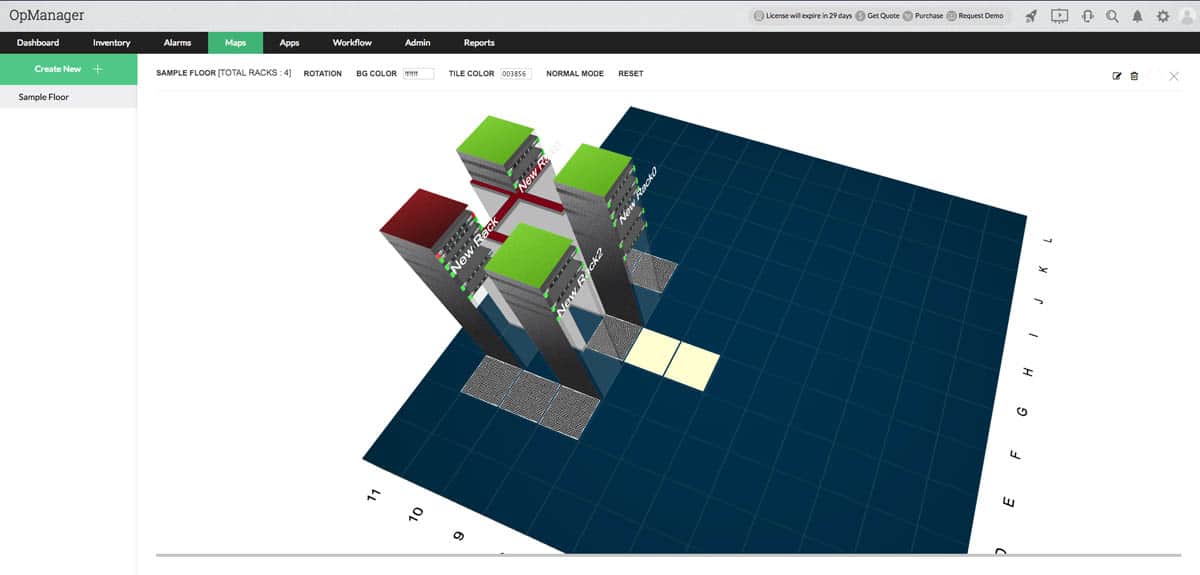
Data Center Management
A data center is a beautiful landscape of device patching. Many companies use data centers for co-location, ending in racks and racks of servers and networking devices. If you need further insight into your inventory of all the devices within your data center or colo, OpManager has a great visualization feature that will prove to be very useful.
OpManager provides 3D Floor Modeling of your entire data center infrastructure to give you a visual of all the racks and devices installed at all levels. The 3D Data Center Floor tool also has the ability to detect the health of each device by color coding scheme and notify the NOC or the helpdesk of any critical conditions.
You may also find OpManager’s virtual Rack Builder fascinating as it gives you the freedom to design racks and mount servers and networking devices on each slot to confirm a good setup.
Another important factor to consider when running a data center is the temperature and humidity. OpManager Environmental Monitoring can help you monitor the temperature of each device. With proper threshold specification, you can control critical points and trigger a notification if the temperature comes near the threshold value.
Pricing
OpManager is offered by ManageEngine at different price plans and packages. It has a Free Edition but has limited features. For the paid version, it is made available as a base software (exclusive of add-ons), base software with add-ons included (discounted), and enterprise edition. Here is a quick comparison of the three price plans:
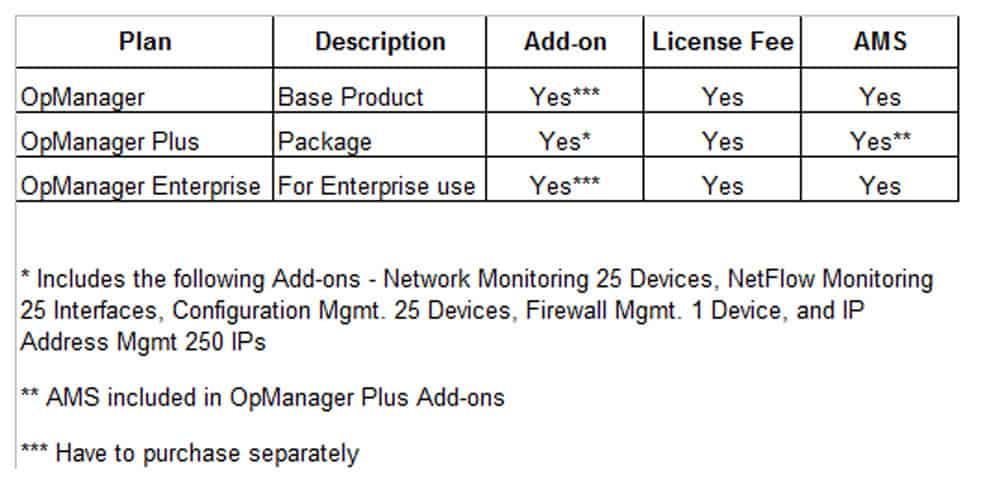
The best package by far is the OpManager plus as you can save fees on AMS (Annual Maintenance Service) and has some Add-ons inclusion that there is no need to buy them separately. You may visit OpManager Pricing page to learn more about the plans and packages.
Download OpManager Free Edition
Pros and Cons
But of course, with every review gives you the light about the pros and cons of the software. Now that we have gone through all the features and capabilities of OpManager, here is an intuitive summary of the ups and downs of this network and server monitoring software.
Cons:
- Let us start with the cons. OpManager has really a lot to offer. The only turn off is that the tools are pretty much scattered. For example, if you are looking for Discovery Mapping, you would guess it might be under IPAM feature tab but you have to navigate all the way down the “Settings” gear icon to find it.
- Another point to consider (although not entirely a con) is that OpManager is a bit pricey. You have to buy the license and pay for an annual maintenance service (AMS). If you are still a startup service provider, this may not be a good fit. But for large enterprises, you may be more after the functionality over the price. It is definitely a good choice if you can afford the software, considering the wide feature set it has to offer.
Pros:
- First, OpManager is developed by ManageEngine, which is a subsidiary of Zoho. Zoho is one of the top Cloud Software Suites and SaaS providers today. With this foundation, you’ll know that you will be buying the product and service from a trusted provider.
- Compared to other networking and server monitoring software, OpManager, by far, offers the most comprehensive monitoring tool which covers monitoring modules ranging from network, server, NCM, Netflow, IPAM, to Automatic Discovery, Asset Management, Fault Management, and Data Center Management. Others offer a few of the monitoring tools listed above but OpManager included almost everything you need, all in one software. It also offers helpdesk integration where alerts come as notifications or tickets which can be assigned to an engineer or technician.
- Now, here is the fun part. OpManager has the ability to be installed and access from any web browser. It is a light software that it does not require high-end computers to run the system. It is also available for download as a mobile application for those professionals on-the-go. The Dashboard, which is the eye of the software, can be customized according to your monitoring preference. For network gurus, where network maps are playgrounds, OpManager can get them around their network without having the need to be physically available onsite.
Conclusion
If you are among the decision-makers in your organization, you would perhaps consider the benefits that a product or service can bring your company in the long run. It can be worth investing in a software that can give you high accuracy, cost-effective solution, and fast troubleshooting and resolution of network/server faults. In this case, the pros outweigh the cons.
Last words, if you want to learn more about OpManager and how it can be of help to your IT processes, you can try the free edition or the 30-days free trial and see it fits your needs. If you want more functionality, you can freely choose which pricing plans works best for you.

