
Our funding comes from our readers, and we may earn a commission if you make a purchase through the links on our website.
LogicMonitor vs Datadog
UPDATED: April 4, 2024
Today, you will find loads of IT Management Software tools and products to help businesses grow and increase efficiencies. But selecting such software requires you to compare them thoroughly to know the full features and functionality. This way, it gets easier to understand whether a particular service is optimal for your business needs or not.
LogicMonitor and Datadog are two of the leading IT Management software products available today. So the question is LogicMonitor vs. Datadog – which is better?
In this post, we will dive deep into their features, support, security, reporting, and other capabilities to help you make an informed decision.
What do LogicMonitor and Datadog do?
LogicMonitor is a SaaS-based monitoring solution that monitors your entire IT infrastructure, whether physical, On-premises, or in the cloud. As a result, it dramatically reduces the time and complexity involved in monitoring your tech stack. For this, it leverages embedded information regarding your tech stack such as applications, servers, networking gear, and so on.
On the other hand, Datadog is also a SaaS-based monitoring service developed for DevOps and IT teams who design and run applications at scale, as they can get a unified view of their IT infrastructure. It will gather a massive amount of data produced by your services, apps, and tools and offers a centralized view of the metrics and events.
LogicMonitor Product Highlights
LogicMonitor is a fully automated, cloud-based Agentless monitoring solution designed for MSPs (Managed Service Providers) and enterprise IT. It offers complete visibility and a unified view of your entire IT stack, including cloud, servers, databases, containers, storage, and networks. In addition, it searches, capably queries, and monitors virtually any resource of data centers.
Key Features:
- Comprehensive Monitoring: Tracks and analyzes data center resources, offering insights for issue resolution and prevention.
- Advanced AIOps: Features anomaly detection, root cause analysis, and performance forecasting for proactive management.
- User-Friendly Interface: Provides a straightforward, flexible platform for monitoring various technology stacks without complex setups.
- Customizable Alerts: Enables the linkage of specific tests to hosts, groups, or instances with dynamic threshold settings for alerts.
- Intelligent Discovery: Offers the ability to selectively filter systems and tailor alerting rules based on the type of resource.
- Versatile Application: Not limited to data centers; it's an optimal solution for internal IT operations management as well.
This powerful SaaS-based monitoring platform extracts actionable data needed to manage agile and complex IT environments. Teams can leverage insightful data through customizable dashboards, pre-configured integrations, performance forecasting, and flexible reporting.
Pros:
- Cloud & Hybrid Monitoring: Capably monitors cloud-based applications and assets in hybrid environments, ensuring comprehensive visibility.
- Customizable Dashboards: Allows for dashboard personalization, catering to different team or individual preferences and requirements.
- Enterprise and MSP Oriented: Especially beneficial for enterprises and managed service providers seeking to enhance IT operations management.
Cons:
- Limited Trial Period: Offers a 14-day trial, which may be insufficient for extensive testing and evaluation of its capabilities.
Datadog Product Highlights
Datadog is a security, monitoring, and analytics platform deliberately designed for IT and DevOps teams, businesses, and security engineers. It integrates and automates application performance monitoring, infrastructure monitoring, and log management to offer a real-time, centralized view of your entire technology stack.
Key Features
- Comprehensive Integration: Seamlessly aggregates data from cloud and SaaS providers, applications, and various services for holistic monitoring.
- Infrastructure Insights: Identifies performance bottlenecks by monitoring hosts and containers, improving system efficiency.
- Auto-Instrumentation: Facilitates automatic tracing across multiple frameworks, enhancing visibility into application performance.
- Real-Time Analysis: Quickly analyzes and visualizes large data sets with real-time dashboards, streamlining decision-making processes.
- Customizable Dashboards: Offers drag-and-drop functionality for dashboard customization, catering to specific monitoring needs.
- Advanced Filtering: Enables focused analysis on key performance indicators, allowing prioritization and effective performance management.
- Collaborative Features: Simplifies team collaboration with shared insights and seamless communication tools.
- Extensive Integrations: Boasts over 450 pre-built integrations, ensuring compatibility with a wide range of technologies and platforms.
Datadog is ideal for businesses and industries of all sizes, seeking to drive cloud migration, digital transformation and enhance seamless collaboration between DevOps teams. Not just that, it also drastically reduces problem resolution time, accelerates delivery time for applications, and helps you get invaluable insights into KPIs.
Pros:
- Dynamic Visualization: Offers robust graphical representations for monitoring complex metrics, aiding in quick comprehension.
- Tailored Dashboards: Allows for high customization of dashboards, ideal for specialized teams like NOC.
- Universal Accessibility: Cloud-based monitoring ensures access from any location, facilitating remote management.
- Broad Compatibility: Supports an extensive array of integrations, accommodating virtually any database or application setup.
- Scalable Solution: Effectively adapts to any scale of operation, from small startups to large enterprises.
Cons:
- Trial Limitations: The trial period is seen as too short for comprehensive evaluation of all features and functionalities.
The main objective of Datadog is to help IT and DevOps teams get a unified view into the performance of their networks, tools, and apps. It offers solutions to boost efficiencies, agility, and visibility of high-scale IT infrastructures. Users simply need to install a monitoring agent such as SQL Server, Windows Services, Apache, vSphere, or IIS to monitor multiple services and devices. Datadog will aggregate vast amounts of data flowing from different tools and apps and keep track of their entire lifecycle.
In short, it is a powerful end-to-end monitoring solution. Not just real-time monitoring, but Datadog also triggers alerts and notifications in case of threshold overpass.
Feature Comparison Table: LogicMonitor vs Datadog
| Features | LogicMonitor | Datadog |
|---|---|---|
| Data Retention | Pro package- 1 year Enterprise package-2 year | Free package- 1 day Pro package- 15 months Enterprise package- 15 months. Customizable |
| Out-of-the-box dashboards | Yes | Yes |
| Getting Started | Installing LM Collectors | Installing Open-source Agents |
| Alerting | Yes | Yes |
| Reporting | Yes | Yes |
| Training | -Live Webinars -Certification programs -Training portal | -Webinars -Training through Slack channel |
| Forecasting | Yes | Only for the Enterprise package |
| Pre-configured Integrations | Over 2000+ | Over 450+ |
| Full REST API access | Yes | Yes |
| Role-based access controls | Yes | No |
| Support | Ticket, Chat, Phone | Chat, Email (Phone only for Enterprise package) |
| Onboarding support | Yes | Only for the Enterprise package |
LogicMonitor vs Datadog Head-to-Head
User Interface
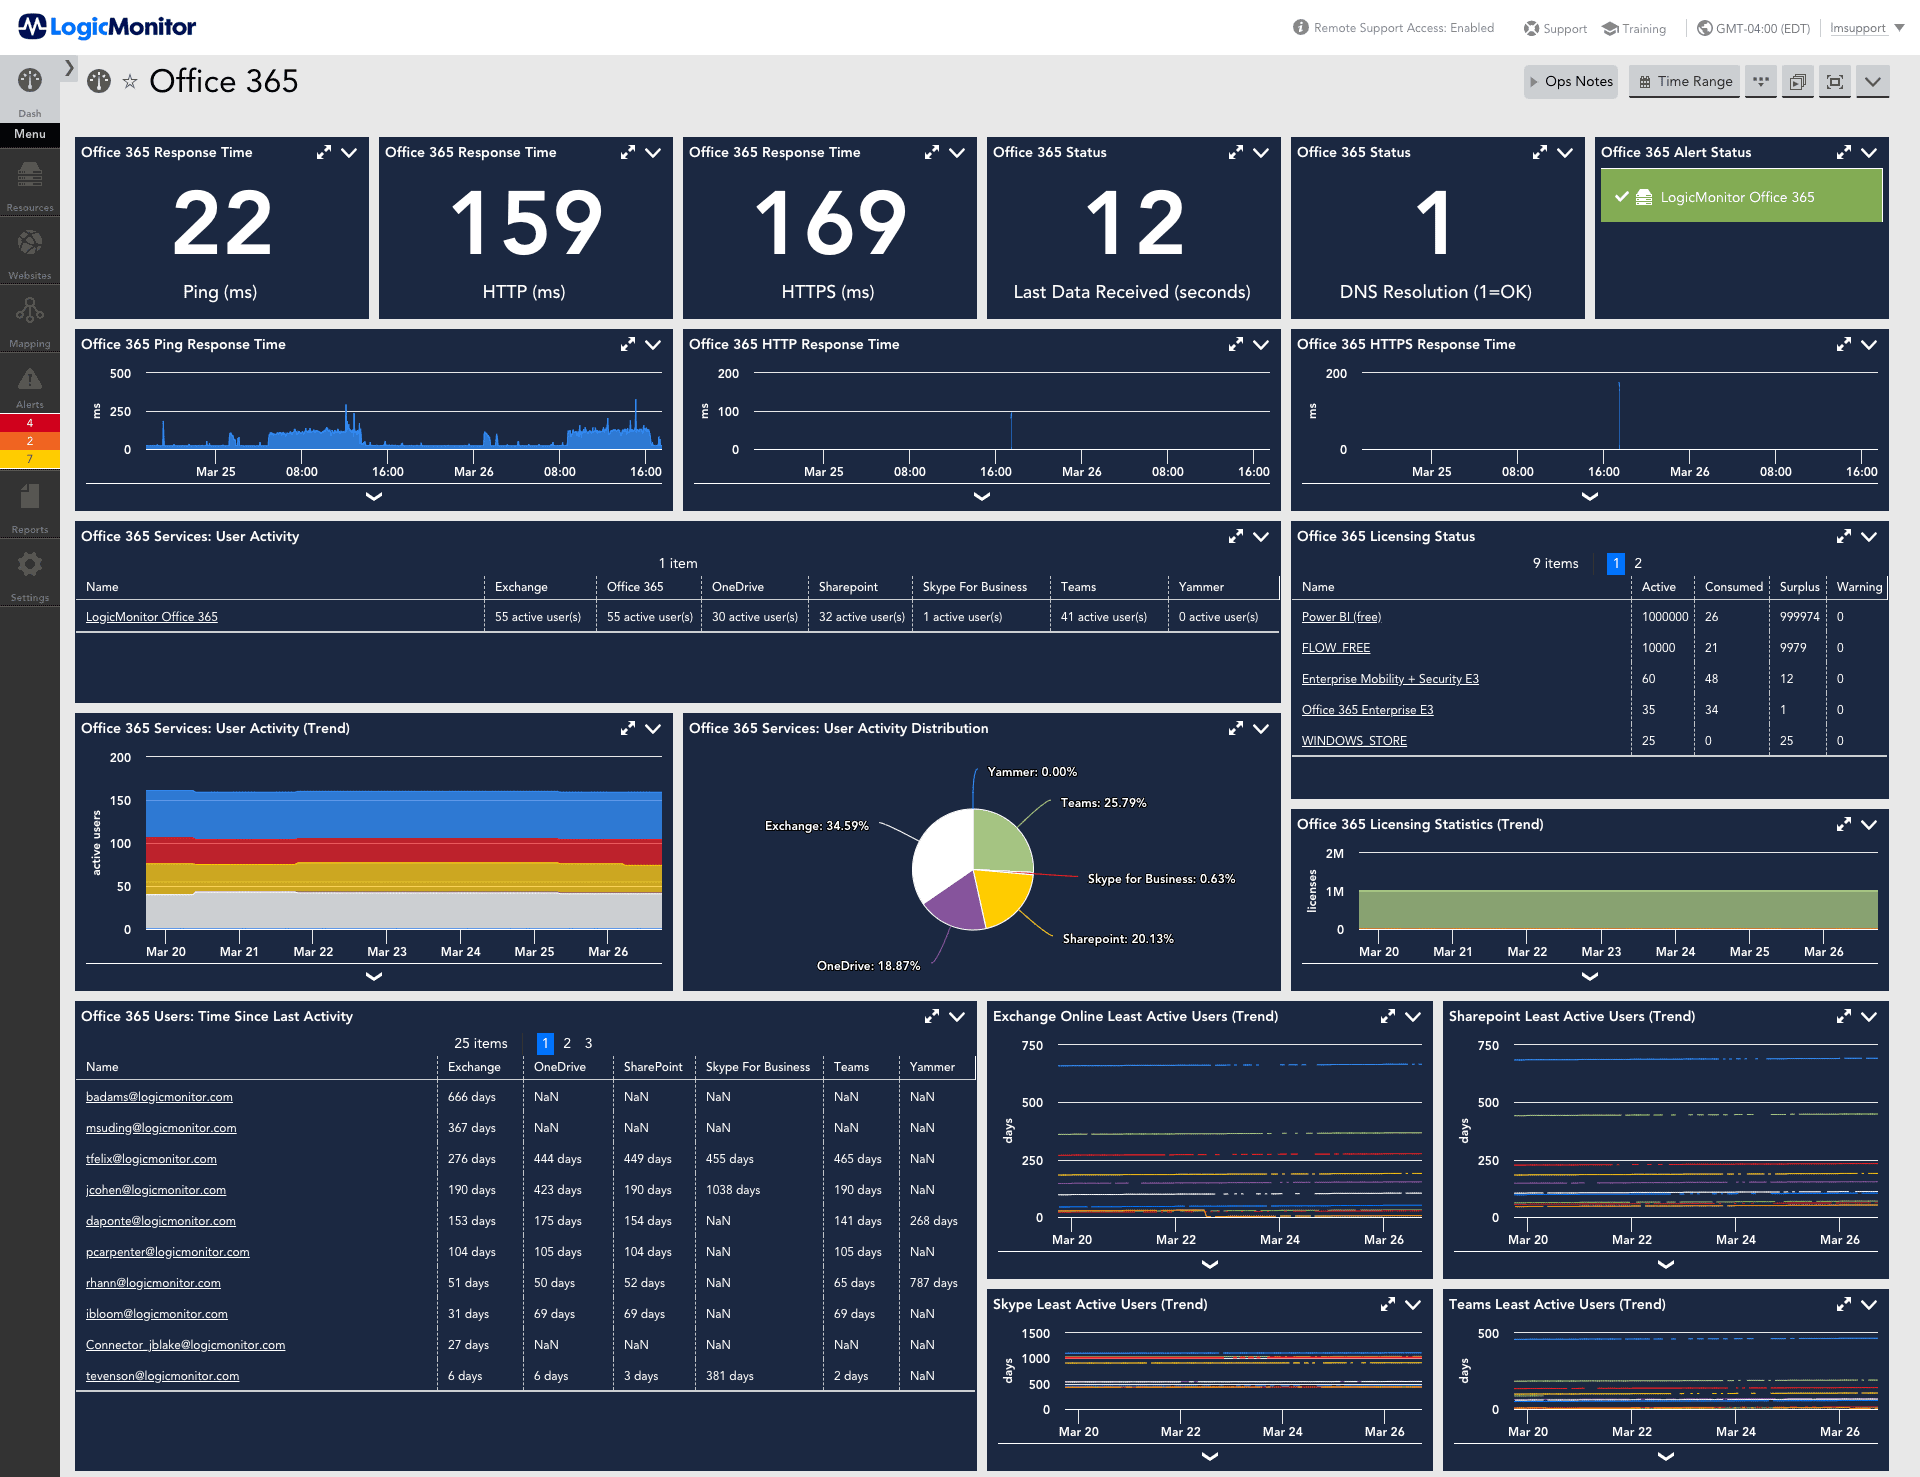
LogicMonitor has a quick UI that is easy to navigate as it features visually appealing graphs. Dashboards and metric graphing provide an in-depth, unified view into your IT infrastructure. Furthermore, it employs alerting when a certain threshold is overpassed. The only downside is at the left navigation, where clicking on different tabs opens different interfaces. Some users may find this jarring sometimes.
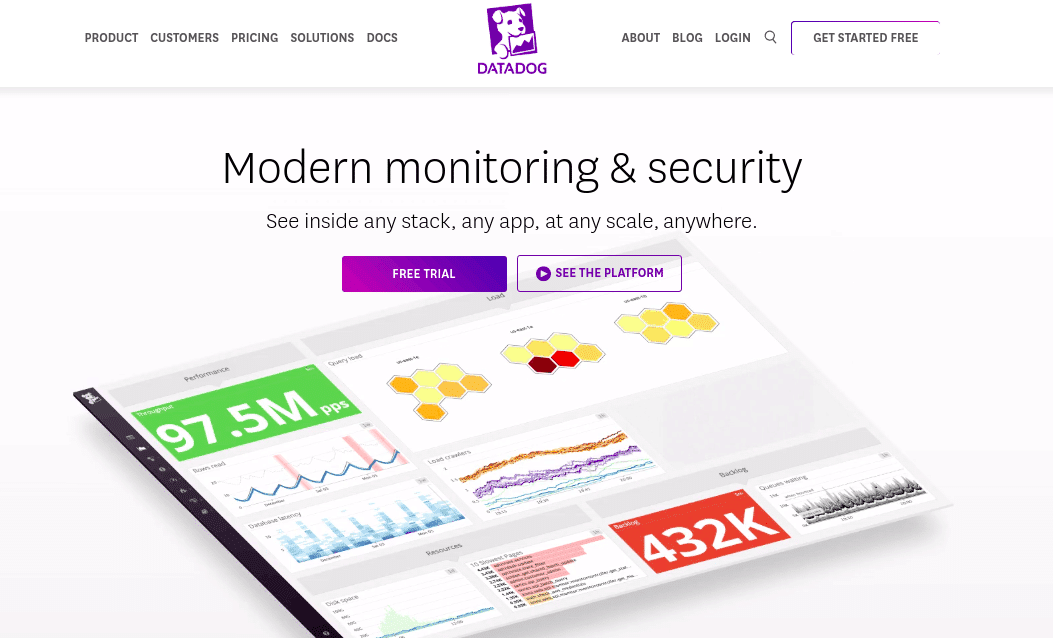
Datadog’s simple User Interface includes customizable dashboards with graphs that show multiple real-time data sources. It also alerts the users in case of performance issues of any set metric. Users are alerted via PagerDuty, email, or Slack. The dashboards are ready to use right out of the box, plus you can always create new customizable dashboards. To make things easier for IT teams, Datadog offers inbuilt RDS, EC2, and Kubernetes dashboards. Its easy-to-use UI does not require any query language and can be used by amateurs as well. Though Datadog's UI is easy, it could still be improved in areas such as network maps.
Monitoring Capabilities
LogicMonitor provides full-stack visibility across all your hybrid, On-prem, and cloud environments with its SaaS-based monitoring capabilities. Its AIOps platform powered by LM Intelligence offers an Early Warning System to help businesses pick up warning signs before real issues arise. These symptoms include anomalies or patterns in performance metrics or alerts. In other words, it provides meaningful alerts, highlights patterns, context and drives foresight through its AI (Artificial Intelligence) and ML (machine learning) abilities. With these early warnings, users can take crucial actions such as custom scripts and integrations to prevent issues.
LogicMonitor also offers Dynamic Thresholds to trigger alerts for anomalies and reduce noise. Besides, it also employs RCA (Root Cause Analysis) and advanced forecasting functionalities to predict future trends for your monitored tech stack. It offers over 2000+ pre-configured monitoring integrations to provide a unified view into the health and performance of your IT infrastructure and discards context switching or tool sprawls.
Datadog SaaS-based monitoring solution provides visualizations, metrics, monitoring, and alerting into your hybrid or cloud environments. It offers access to vendor-approved integrations for server-less platforms, Kubernetes, and over 450+ other technologies. You can deploy its monitoring solution anywhere- be it on IoT, On-prem, hybrid, or multi-cloud environments. It tracks hundreds and thousands of infrastructure metrics right out of the box. In addition, Datadog offers Live Process Monitoring, through which you can follow the impact of every process running in the tech stack.
Datadog offers complete visibility into your modern applications as it can trace requests from end-to-end across various systems. Besides, you can even instrument your code with open-source tracing libraries. Furthermore, Datadog provides impressive monitoring capabilities for user experience, such as web recorder, AI-powered self-maintaining tests, and management of SLOs and SLAs.
Installation
LogicMonitor and Datadog, both platforms, are SaaS-based (cloud) monitoring solutions. Hence, you have to create an account to get access to the service. Once your user account is created, LogicMonitor takes you through a step-by-step guide for installation. After logging in, you must install collectors on each network segment you wish to monitor. For example, you can go for a Windows collector that covers all devices and mixed environments. Or, you can choose the Linux collector if you don’t want to deal with Microsoft environments.
Now the installation is pretty simple. It will ask you to run a command-line string and automatically install the collector. Once the collector is installed, LogicMonitor can sniff into your systems for monitoring, and you can now proceed towards the online wizard. Here you can add devices or automatically scan systems. LogicMonitor supports Microsoft Hyper-V and VMware ESXi systems which is ideal if you have lots of virtual infrastructures. Configuring LogicMonitor is a bit challenging, but once configured- deployment is a breeze!
Datadog installation is also straightforward. First, you need to create a Datadog account and install the agent on a platform of your choice, such as Windows, Ubuntu, CentOS, etc. Then, run the Agent’s status command, and the installation will start. Once the Agent is installed, it will collect metrics and events from hosts and send them to Datadog. With more than 450+ integrations, you will learn bit by bit to collect logs, metrics, and traces.
Reports
LogicMonitor offers powerful reporting functionality to create standard reports, thereby simplifying operational reviews and management. The customizable reports feature allows you to format messages and schedule their delivery as per your liking. LogicMonitor offers reports for Alerts data, Monitored Data, Resource Configuration Data, and User data.
In Datadog, you can create custom reports using Log Analytics API. Their all-new Datadog Reporter integration allows you to schedule reports delivery through email. You can generate and send unlimited reports to your users.
Plugins
LogicMonitor has a whopping 2000+ monitoring integrations, so you can seamlessly integrate with services, technologies, and devices your business requires. Due to myriads of inbuilt integrations, the monitoring experience and user control offered by LogicMonitor is a bit better than Datadog.
Datadog has over 450+ inbuilt integrations to help you aggregate metrics and events across your entire DevOps stack, including apps, services, and systems.
OS Support
LogicMonitor Collector is an app that runs on a Windows or Linux server within your infrastructure and leverages standard protocols to monitor devices in your tech stack. Unlike Agents, you do not have to install Collector on every resource within your IT infrastructure to be monitored. Instead, you can simply install a Collector on a host in each location of infrastructure.
Datadog Agent runs on your hosts to aggregate metrics and events and sends them to Datadog for monitoring. Agent software is open-source and can be installed on various platforms such as Amazon Linux, CentOS, Debian, RedHat, docker, Ubuntu, Windows, and many other OS. You can also install a standalone DogStatsD package for Amazon Linux, Debian, Red Hat, SUSE, CentOS, Fedora, and Ubuntu.
Support
LogicMonitor offers solid support in the form of three packages viz. Standard, Enhanced, and Premier. All packages provide well-defined SLAs and access to a top-notch expert addition, you. You can get support through the community forums, support portals, self-help resources, onboarding support, ticket, chat, and phone.
Similarly, Datadog also offers exceptional support via email, Live Chat, and In-app Event Stream Messaging. Besides, it provides detailed documentation that has information and guides for APM, dashboards, monitors, logs, integrations, etc.
Training
LogicMonitor offers free e-learning content for training. Besides, you can also purchase their technical certification programs viz. LogicMonitor Certified Associate (LMCA) and LogicMonitor Certified Professional (LMCP) provide a comprehensive learning experience with use cases and interactive graphical and video content. Or, you can sign up for their live training webinar held every other Wednesday as well.
Datadog provides better insights into product features and customer success stories through webinars. For training, Datadog also has a comprehensive Datadog Learning Center featuring myriads of courses. If you still have an issue with the solution, you can contact their Learning team through learn@datadoghq.com, or you can even go through their slack training channel.
Pricing
LogicMonitor price starts at $20 per month per user. It has a Quotes Only pricing structure.
Datadog pricing is minimalistic. No commitments, as it offers monthly plans. It offers three packages viz.
Free
Pro: $15 per host per month (450+ integrations, inbuilt dashboards)
Enterprise: $23 per host per month (Live Process Monitoring, Premium Support, ML-based alerts)
Free Trials are available for all three packages.
LogicMonitor vs. Datadog: The Verdict
In this battle of LogicMonitor vs. Datadog, if you ask which one is better? We would say both the solutions are great, depending upon your unique business requirements. It can leverage APIs and also read Active Directory and configs on switches.
Anyone who prefers a fully automated, cloud-based solution with Agentless monitoring capabilities, intelligent alerting with dynamic thresholds, and Active Directory functionality, can go for LogicMonitor. It is perfect for Managed Service providers and IT businesses with complex environments.
Datadog is perfect for a business environment with low-level investment on a cloud approach or supporting IT infrastructure, looking to scale their business without compromising the set of features. It is often preferred by IT and DevOps, who develop and run applications on hybrid or dynamic cloud infrastructure. It can transform massive amounts of data coming from tools, services, and apps into actionable insights.
Datadog is a no-brainer for any infrastructure based on multiple servers!

