
Our funding comes from our readers, and we may earn a commission if you make a purchase through the links on our website.
Jitter And Latency
UPDATED: January 8, 2024
It’s quite common for jitter and latency to get confused with one another, or even regarded as the same thing, however, they are innately distinct. Simply put, latency describes the time it takes for a packet to arrive at its destination. On the other hand, jitter refers to the delay through the time when the signal jitters or wanes.
Let's look at this difference in detail and then look at some monitoring tools you can use to help you solve latency/jitter problems.
Here are some of the best tools to deal with Jitter and Latency:
- SolarWinds Network Performance Monitor – FREE TRIAL A tool that will let you precisely troubleshoot your entire network to detect signs of latency and app slowdown. Start a 30-day free trial.
- Site24x7 – FREE TRIAL Offers a comprehensive solution for monitoring network performance, particularly excelling in jitter and latency tracking. Its all-in-one platform, which also covers server, application, and cloud service monitoring, is equipped with continuous performance metrics tracking and user-friendly interfaces. Start a 30-day free trial.
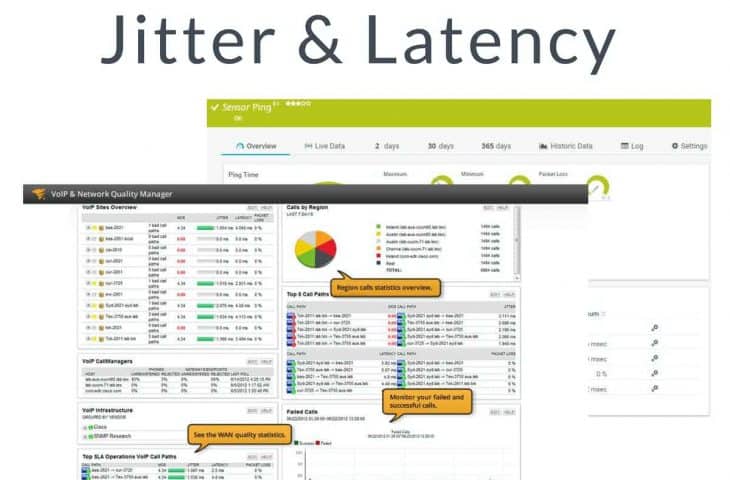
- Paessler PRTG Network Monitor An excellent network monitoring tool, fully equipped with Quality of Service (QoS) monitoring features.
What Is Latency?
Latency is a description of how much time it takes for data to go from the source to the destination. Generally, you’ll see latency measured as a round-trip, which means it’ll describe the time it takes for a packet to get from its source to the destination and back. If there’s a high delay between these, that means your network is having some performance issues. In essence, latency is a way to measure delay.
What Is Jitter?
Like we’ve already mentioned, jitter is the variation in the packet flow’s latency from one endpoint to another. Generally, jitter will be measured in milliseconds, and it's one of the leading causes of issues with VoIP calls, video calls, and similar features. With that being said, jitter isn’t very relevant when downloading something off the internet, as there’s no need for real-time delivery of packets.
Monitoring Jitter
Now that we’ve established the definition of jitter, we’ll go through some ways you can pay attention to jitter in your network. If you’re still unsure whether you have jitter problems, you’ll need to get a tool that can measure jitter. By doing this, you’ll be capable of seeing the severity of the problem before you solve it.
Monitoring Latency
If you’re looking to monitor latency, there’s a variety of different tools and tests you can use. We’ll be looking at the two market leaders in the area: The SolarWinds Network Performance Monitor, and the Paessler PRTG Network Monitor we’ve looked at above. Now, you might not necessarily need a tool in order to check if you’re experiencing latency issues. A one-time test might do the trick, so we’ll be covering the difference between these two.
One-Time Tests
Now, it’s not always necessary for you to monitor latency across your whole network long-term to find out there are some issues. Sometimes, it can be enough just to run a singular test for latency issues. An example of this is running a ping query to check the response time can give you a good rough estimate of your network’s latency.
Doing this lets you figure out if you’re facing latency issues when you’re taking the test. With that being said, if you’re looking to get your latency over time or ensure that the problems don’t persist, then monitoring latency long-term is necessary.
Long-term Latency Monitoring
Ongoing, long-term, or perpetual latency monitoring is a way of monitoring latency throughout a longer period of time. In essence, this means monitoring your network for any changes in packet loss, jitter, latency, or a decrease in the mean opinion score. Although this way takes more time, it lets you keep an eye on latency consistently, and removes the need for doing endless one-time tests.
Tools like the two we’ll discuss below will alert you the moment you start having latency issues. One of the biggest benefits of handling your network monitoring this way is the ability to react to issues that pop up as they come.
Most Frequent Causes of Jitter And Latency
When you’ve determined that your network has issues with jitter and/or latency, you’ll need to figure out where the issue is coming from. There are quite a few factors influencing your network’s latency or lack thereof. Low bandwidth availability is nowhere near the only cause of latency, however, you can find it caused by an improper structuring of your network. The most frequent causes of latency being:
- The distance between devices in reality
- The kind of internet connection utilized
- Issues with the routing
- Routers being overwhelmed
- Using outdated hardware
With that being said, jitter is usually caused by packet queuing. As a general rule of thumb, the more packets your network routes at once, the more you’ll face performance issues. As you can see above, there’s a variety of causes that could be the reason your network is having latency issues. Whenever there’s a packet queue on your network, you can be certain there’s a bottleneck somewhere.
Fixing Jitter
There’s a lot of ways that you can fix jitter issues within your network, depending on the root cause of the problem. With that being said, it’s crucial that you recognize jitter isn’t always caused by you. Having the best hardware out there won’t be enough to prevent jitter if your internet isn’t performing well enough. There are a lot of things you can do in order to minimize or prevent jitter:
- Get a better internet
- Deploy a jitter buffer
- Get better hardware for your network
Getting A Better Internet Connection
Getting a better internet is the easiest, and most direct way to combat jitter on your network. Usually, you’ll want to try and ensure that your up and down speeds are high enough to support high-quality VoIP calls. Now, how fast that connection needs depends on the number of calls you’re planning for. If you just need 10 calls simultaneously, you’ll need a lot fewer resources than if you needed 400.
Generally, you can assume that you can support 12 calls per Mbps of bandwidth. With that being said, that’s just the start of the factors you should be paying attention to in order to get peak call performance, however, it can give you a ballpark of resources you should be putting into your internet connection.
Getting A Jitter Buffer
A lot of companies have resorted to deploying a jitter buffer in order to combat jitter. This is a component that sits inside endpoints and gets around issues with jitter through holding packets for some time before it passes them on. The buffer here makes sure that all of the packets being sent are in the right order. This solves the cause of jitter where packets are arriving out of order.
The biggest problem with jitter is that latency is always fluctuating, and packets are reaching the user out of order. Through holding them for a short time, a jitter buffer makes sure that all of the packets are arriving in the correct order. This translates to a VoIP or video call recipient being able to tell what the other person’s saying.
With that being said, you should keep in mind that while jitter buffers lower jitter, they also increase latency intentionally. Because of this, although jitter buffers can be excellent short-term band-aids over the problem, they are not very good as a long-term solution.
Getting Better Hardware
Another way to prevent jitter is by getting better hardware for your network. By improving the infrastructure of your network, you can experience massive upgrades in its performance. This is especially true if your network is working on a bunch of outdated hardware. Although this isn’t certain to fix jitter, it can be a huge deal for old networks. When you’re picking what hardware to upgrade, it’s crucial that you pay attention to routers and other components of your network’s foundation. Shelling out a bit more money in order to get a better router with superior quality of service settings can make a huge difference in your network in the long term.
Fixing Latency
Latency can be quite the handful to fix, however, if you keep in mind that a majority of latency boils down to the time packets spend in transit, it’ll get a lot easier. Because of this, latency depends on both your internet and the optimization of your hardware and software. With that being said, you should always troubleshoot latency issues first. This is because you can’t start fixing latency before you find out what exactly is causing your issues. So, once you’ve found out what the problem is, all you need to do is apply one of the following fixes:
- Repair Malfunctioning Endpoints
- Solve Bottlenecks
- Set up a CDN(Content Delivery Network)
Finding Malfunctioning Endpoints
There’s a lot of cases where the culprit for latency issues is an endpoint that started to malfunction and devour bandwidth. Generally, this kind of endpoint is called a top talker. One of the telltale signs of this issue is a large sum of bandwidth consumption, which indicates a breach of the network or simple performance issues.
Having a bad connection in a specific area can also mean that you need to work on the signal distribution within it, because of this, tools like the two we mentioned above are crucial in determining which exact endpoints are at fault for your issues.
In case your latency issues are larger or smaller from app to app and endpoint to endpoint, you can take advantage of the SolarWinds Network Performance Monitor in order to make a heat map of the network, and find places where the signal is at its weakest. This gives an excellent perspective on how you can make your network connection better. It’s crucial for you to keep in mind that there’s a lot of ways through which you can find malfunctioning endpoints and other devices through the usage of the above two tools.
Finding And Solving Bottlenecks
Another crucial aspect that helps you ensure good traffic flow in your network is finding and solving bottleneck issues. A bottleneck is a place in your network experiencing high congestion (a lot of traffic trying to get to a smaller amount of resources.) Looking through your network traffic lets you find these bottlenecks. Either of the tools above can provide you with this functionality, as well as tell you if there’s a specific time during the day when they usually occur.
When you find a bottleneck, there’s a variety of solutions you can apply. For example, it’s possible for you to simply reroute traffic to solve it, or you could get a better router. The route you choose to take should be based on what is causing the bottleneck. In order to better find and solve bottleneck issues, you’ll want to ensure that you’re monitoring the quality of service.
Setting Up A CDN
A great way to solve latency issues is to take advantage of a CDN, or Content Delivery network. A content delivery network takes advantage of connection optimization, progressive image rendering, and content caching in order to ensure your resources are used in the most efficient manner. An example of this is the CDN utilizing content caching through Points of Presence in order to make copies of websites before they cache and compress them. This leads to a lowered round-trip time for content and gives a smoother experience to users.
Connection optimization also has a lot of different routes it can be done through. One of the easiest is the CDN’s ability to take advantage of a Tier 1 network in order to make sure traffic goes through as few hoops as possible. This helps your round-trip times as well.
The Βest Jitter and Latency Monitoring Τools
1. SolarWinds Network Performance Monitor – FREE TRIAL
SolarWinds Network Performance Monitor will let you precisely troubleshoot your entire network to detect signs of latency and app slowdown. SolarWinds takes advantage of deep packet analysis to figure out how intense the latency problem is on your network. If a problem is found, then the tool can help you find its root cause. Usually, the problem stems from a performance issue of some sort.
The tool also possesses its own software for packet analysis, helping you identify over 1200 different apps. Through this, the tool can figure out whether the latency is coming from an issue with your network, or if it’s an issue with the application. This info can be crucial to not wasting time when you get it early, as it lowers the amount of troubleshooting you need to do drastically.
Pros:
- Designed with large and enterprise networks in mind
- Supports auto-discovery that builds network topology maps and inventory lists in real-time based on devices that enter the network
- Has some of the best alerting features that balance effectiveness with ease of use
- Supports both SNMP monitoring as well as packet analysis, giving you more control over monitoring than similar tools
- Uses drag and drop widgets to customize the look and feel of the dashboard
- Robust reporting system with pre-configured compliance templates
Cons:
- This is a feature-rich enterprise tool designed for sysadmins, can take time to fully explore all features and tools
The SolarWinds Network Performance Monitor offers a 30-day free trial.
2. Site24x7 – FREE TRIAL
In the realm of network performance, jitter and latency are critical metrics that can significantly impact the user experience. Efficient monitoring of these elements is crucial, especially in environments where real-time data transfer is essential. Site24x7 emerges as a robust solution in this context, offering comprehensive tools for monitoring jitter and latency alongside other vital network parameters.
Site24x7 provides an all-in-one monitoring solution that encompasses not only network performance but also applications, servers, and cloud services. Its ability to monitor jitter and latency is particularly noteworthy. The platform enables real-time tracking of these metrics, ensuring that network administrators can quickly identify and address issues that could affect network stability and performance.
Key Features
- Continuous tracking of network performance metrics
- Comprehensive tools for monitoring servers, applications, and cloud services
- User-friendly interfaces for easy data analysis and reporting
- Instant notifications for performance anomalies
- Supports a wide range of applications and services for integrated monitoring
Why do we recommend it?
Site24x7 stands out for its comprehensive approach to jitter and latency monitoring. Its real-time analysis capabilities, combined with automated alerts, make it an invaluable tool for maintaining optimal network performance.
Who is it recommended for?
Site24x7 is ideal for network administrators and IT professionals who need a versatile tool for monitoring not just network performance metrics like jitter and latency, but also server health and application performance. It suits both small-scale and large-scale network environments.
Pros:
- Comprehensive monitoring of jitter, latency, and other critical network metrics
- Intuitive dashboards for easy data interpretation and analysis
- Extensive integration options enhance its utility in diverse IT environments
Cons:
- Can be overwhelming for users who need a tool focused solely on jitter and latency
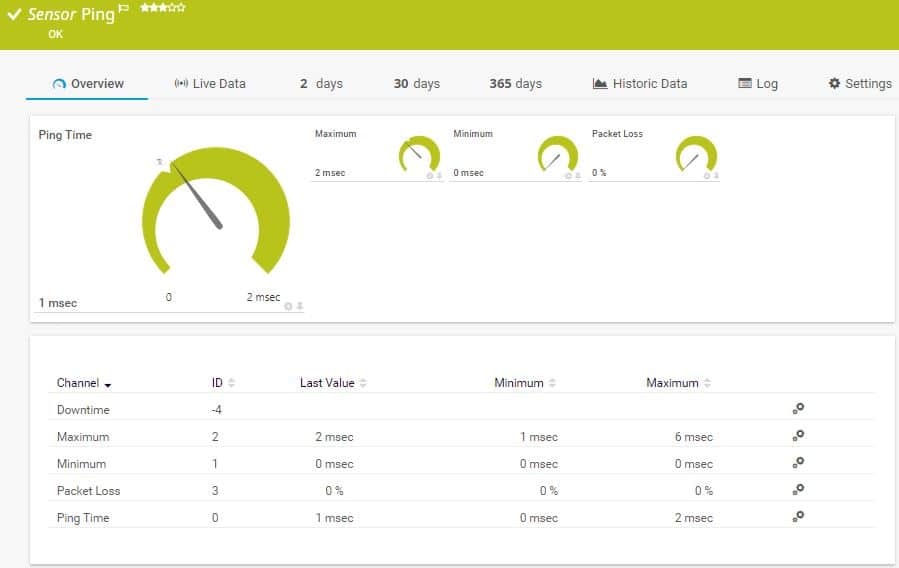
3. Paessler PRTG Network Monitor
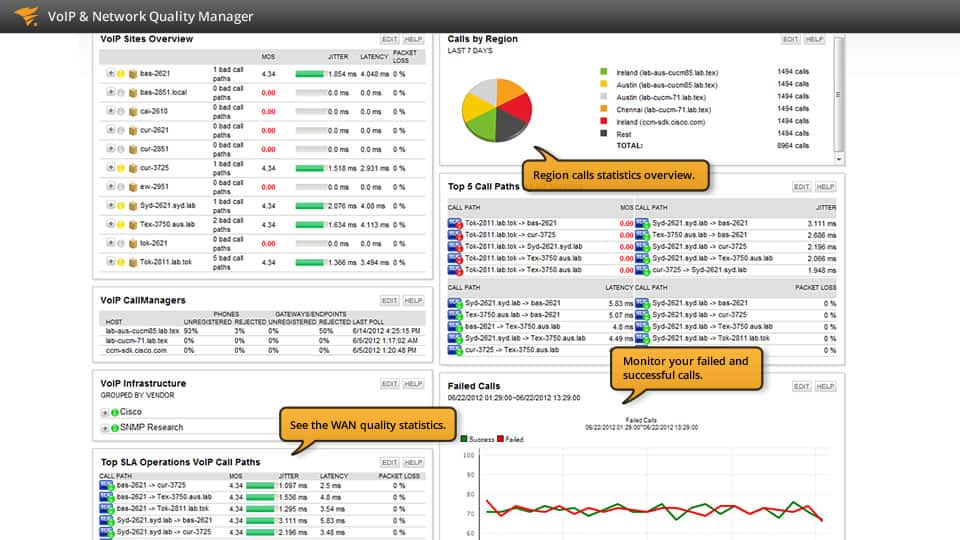
The Paessler PRTG Network Monitor is an excellent network monitoring tool, fully equipped with Quality of Service (QoS) monitoring features. It’s useful for looking at the effect that jitter has on your network with its variety of jitter-detecting sensors:
- QoS One-Way: This sensor pays attention to the quality of the connection of two probes, giving you the min, max, and average jitter values.
- QoS Round-Trip: This sensor displays a simple measurement of packet loss, jitter, and latency, as well as an opinion score of the connection.
- Ping Jitter: This sensor gives you a jitter measurement rooted in ping signals.
Another excellent feature of the Paessler PRTG Network Monitor is that every sensor has a unique display, showing you its measurements live. It’s important for you to figure out you have jitter issues before you start putting in QoS solutions. By using a tool like this, you can ensure that there’s an actual problem to fix.
Paessler is great for monitoring jitter, however, that doesn’t mean it doesn’t excel at monitoring latency too.
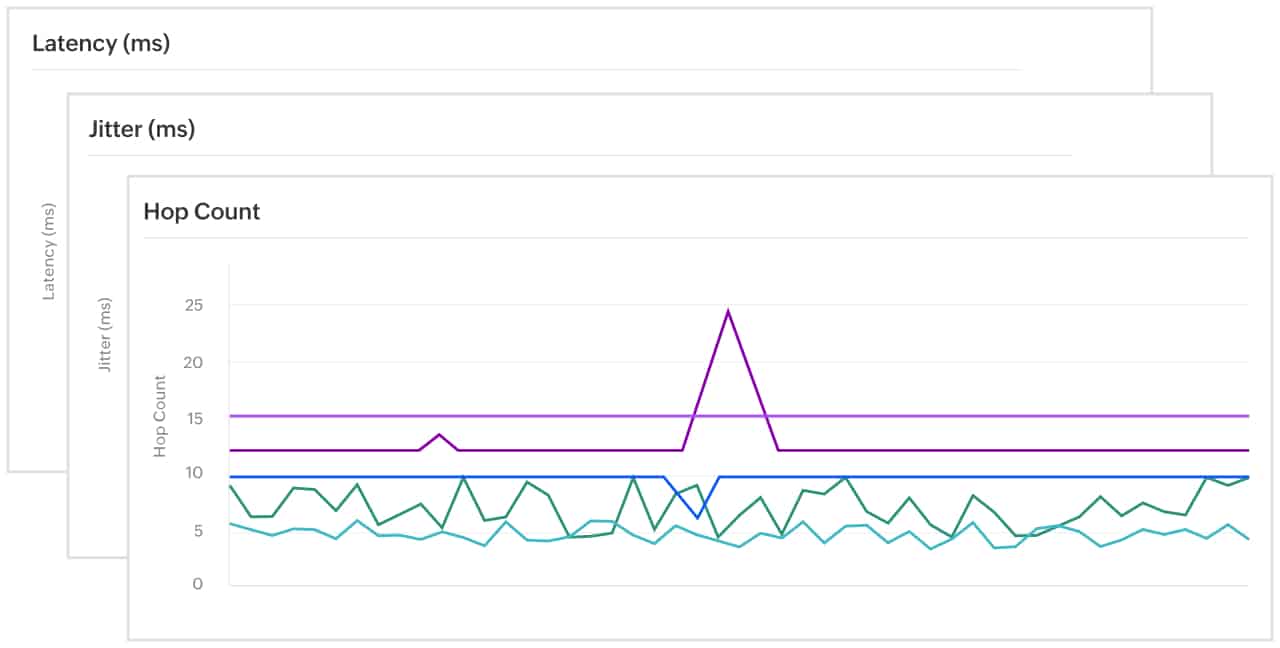
It offers a variety of different sensors that will let you keep track of latency on your device such as:
- QoS Round Trip: This sensor will measure the quality of service of a network route.
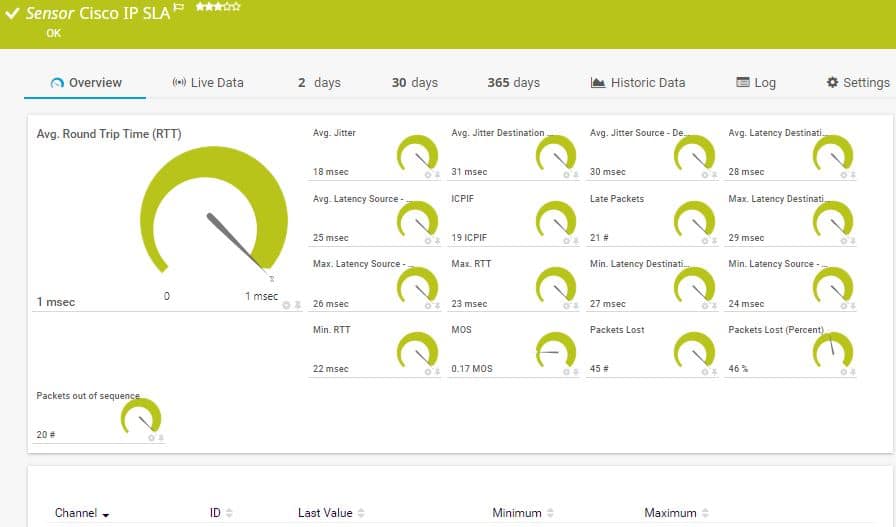
- Cisco IP SLA: This sensor will collect the quality of service values off of Cisco devices.
- Ping: The ping sensor pings devices in order to determine if they’re available.
The most useful sensor for this is the QoS Round Trip, as it’ll let you pay attention not only to latency but also jitter, delay variation, MOS(mean opinion score), corrupted packets, lost packets, and so on. All of this information makes it very easy to put a number on how much latency is affecting your network. One of PRTG’s biggest advantages in terms of latency monitoring is how it uses alerts. It allows you to get alerts at any time that latency goes higher than the threshold you set. This lets you do other things instead of having to wait for spikes of latency.
Pros:
- Uses a combination of packet sniffing, WMI, and SNMP to report network performance data
- A fully customizable dashboard is great for both lone administrators as well as NOC teams
- Drag and drop editor makes it easy to build custom views and reports
- Supports a wide range of alert mediums such as SMS, email, and third-party integrations into platforms like Slack
- Each sensor is specifically designed to monitor each application, for example, there are prebuilt sensors whose specific purpose is to capture and monitor VoIP activity
- Supports a freeware version
Cons:
- Is a very comprehensive platform with many features and moving parts that require time to learn
Paessler offers a 30-day free trial.
You Should Avoid Both Latency And Jitter
Although jitter and latency have a few connections between them, they’re very different beasts in reality. Grasping the essence of both of these concepts can be a great help when it comes to finding fixes to them and detecting them. In case you’re interested in smooth VoIP services, then you’ll have to make sure that jitter and latency don’t wreak havoc on your network.
There’s only one way to do this, and that’s by using QoS monitoring. Although there’s an abundance of tools on the market that can do this, the SolarWinds Network Performance Monitor and Paessler PRTG Network Monitor are the pick of the crop. If you keep an eye out for any signs of jitter or latency, you can find issues before they even pop up, and solve them.
You’ll always want to ensure that the latency and jitter in your network are minimal, without any QoS monitoring, it’s nigh-impossible to find causes of these issues before they start affecting your users.
Related Post: Best Pop Up and Ad Blocker

