Our funding comes from our readers, and we may earn a commission if you make a purchase through the links on our website.
Graphite vs Datadog

UPDATED: October 19, 2022
Seeking highly efficient business intelligence software plays a vital role in boosting your business productivity and ROI. Datadog and Graphite-both, the software, are pretty popular these days for their impressive set of features. So if you’re wondering – Graphite vs. Datadog, which is better, you’ve come to the right place!
In this post, we will be comparing their features, benefits, price, and other aspects, so you’ll know which one is perfect for your unique business requirements.
What do Graphite and Datadog do?
Graphite is a highly scalable platform that executes real-time data graphing. In addition, it can store numeric time-series data and further uses this data to render graphs on-demand.
Datadog is an industry-leading, SaaS-based monitoring platform that unifies metrics, logs, and traces across your entire IT infrastructure to offer complete visibility. DevOps most commonly leverage it, and IT teams are developing and running applications on hybrid or multi-cloud infrastructure.
Datadog is primarily known to be a performance monitoring tool. And, Graphite is a data logging and graphing data tool. But, if done right, monitoring can dramatically improve the response times of DevOps and reduce MTTR and MTTD.
Graphite Product Highlights

Graphite is an open-source, enterprise-ready graphing system that runs seamlessly on the cloud or minimal hardware infrastructure. Businesses leverage Graphite to track the performance of networked servers, applications, servers, and websites. It is a free, new-Gen monitoring tool that can capably store, query, and visualize time-series data coming from anywhere, be it servers, devices, systems, or websites simultaneously.
Key Features of Graphite
- Graphite stores numeric time-series data and uses this data to render graphs on demand.
- It mends a simple path to get all your metrics and systematically organize them into a time-series database.
Graphite is NOT a collection agent. - Graphite offers loads of data integrations and other third-party tools if you need language bindings or a collection agent.
- The architecture of Graphite has three core components viz. carbon (a twist d or twisted daemon that listens for time-series data and gathers it over a set of protocols), whisper (database library to store time-series data), and graphite web (a Django web application that uses Cairo to render graphs on-demand).
- It is a push-based monitoring software, meaning that it gathers metrics through data that is already expressed. Further, it uses this data to store and visualize it through graphs.
- To extract time-series metrics from your infrastructure, it commonly uses StatsD or collectd.
- The metrics are amassed and stored in the whisper- Graphite’s database. With Graphite, businesses can seamlessly keep, monitor, and visualize data, plus it can also send alerts on specific events.
- Hosted Graphite is also available via MetricFire.
Now, what is a time-series database?
A time series is a series of data points that are listed or graphed using time order. Such databases offer excellent advantages such as high performance, enhanced scalability, reliability, higher writes, and so on. Therefore, Time-series databases are ideal for companies that want to leverage advanced technologies to employ analytics, DevOps, forecasting, IoT, etc.
First designed and written by Chris Davis at Orbitz in 2006, Graphite was just a side project which later evolved to be a prominent monitoring tool. In 2008, Graphite was released under the open-source Apache 2.0 license. Today, many large companies use and deploy Graphite to production to monitor their e-commerce services and scale quickly.
Feeding the information into Graphite is simple; instead, the challenge is to collect the data. Then, as you send data points to carbon, a twisted or Twisted Daemon, they are ready for graphing in the web app. With web apps, you can create and view graphs in multiple ways, such as simply through URL API to render graphs and embed them into web pages.
Pros:
- Completely open source and transparent platform
- Highly data focused – can load various data types into your time-series database
- Can monitor and view data natively with built-in graphics
- Large dedicated community
Cons:
- Open source isn’t always the best option in terms of support for larger businesses
- Is more analysis-focused – not the best option for those looking for out-of-the-box monitoring
Datadog Product Highlights

Datadog is a SaaS-based monitoring service aimed at IT and DevOps teams who build and run applications on dynamic or hybrid infrastructure. It collects large amounts of data from your applications, cloud services, tools, servers, containers, web browsers, and mobile. It provides a unified dashboard to view critical metrics, traces, logs, and events.
Key Features of Datadog
- Datadog helps you correlate metrics, logs, and events from connected cloud services, apps, tools, hosts, and containers.
- It can detect bottlenecks in application code or infrastructure as it closely monitors containers and hosts.
Datadog analyzes and renders graphs of large amounts of data in just a few seconds through intuitive dashboards. - Has an efficient alerting system that triggers specific events.
- Can trace requests automatically across all libraries and frameworks and run auto-instrumentation to collect spans.
- You can overlay event markers on the rendered graphs for correlation analysis.
- Build new dashboards by using drag-and-drop graphs and other intuitive widgets.
- Rank and filter key metrics to focus on specific events.
- Includes more than 450+ prebuilt, vendor-approved integrations to monitor hundreds and thousands of hosts.
Datadog offers impressive features of alerting, monitoring, visualization, and troubleshooting. However, what makes it the best is that it can integrate with over 450+ services or apps to offer exceptional monitoring capabilities.
The main objective of Datadog is to extract data from any application or tech stack and provide a centralized dashboard for metrics and events. It integrates and fully automates application performance monitoring, log management, and infrastructure monitoring to provide a real-time, unified view of your entire tech stack.
Datadog is an ideal cloud-based service for industries and companies of all sizes that seek efficient collaboration between the DevOps teams, drive cloud migration, and boost their digital transformation journey.
With Datadog, companies can gain deeper visibility into high-scale IT infrastructure and boost agility and integrating efficiency.
Pros:
- Offers numerous real user monitors via templates and widgets
- Can monitor both internally and externally giving network admins a holistic view of network performance and accessibility
- Changes made to the network are reflected in near real-time
- Allows businesses to scale their monitoring efforts reliably through flexible pricing options
Cons:
- Would like to see a longer trial period for testing
Feature Comparison of Graphite vs Datadog
| Features | Graphite | Datadog |
|---|---|---|
| What is it | Time series data graphing tool | SaaS-based monitoring, alerting and data visualization tool |
| Integrations | 95+ integrations | 450+ integrations |
| Support | StackExchange Community Support -Documentation -GitHub projects -IRC channel | -Chat -Phone only for Enterprise package |
| Out-of-the-box alerting | No | Yes |
| Out-of-the-box dashboards | No | Yes |
| Retention | No | Yes |
| Graphs | Interactive graphs | Clean graphs of StatsD and other integrations |
| Server OS | Linux, Unix | Linux, Windows |
| API | HTTP API Sockets | HTTP REST API |
Graphite vs Datadog Head-to-Head
User Interface
Graphite has a simple UI with functionalities to help you gather, transform, calculate and filter data in a graph. It can display the time series as per the R&D needs. In Graphite’s dashboard, you will see one or two visualization types, making it relatively straightforward.
Graphite’s UI is quite basic with not so flexible visualization. For a better experience, you may integrate Graphite backends with advanced tools such as Grafana and MetricFire. Other than that, querying in Graphite is easy and relatively advanced to run. In addition, the functionalities are flexible to perform, such as calculations, grouping, alias, and exclusion methods often desired by DevOps teams.
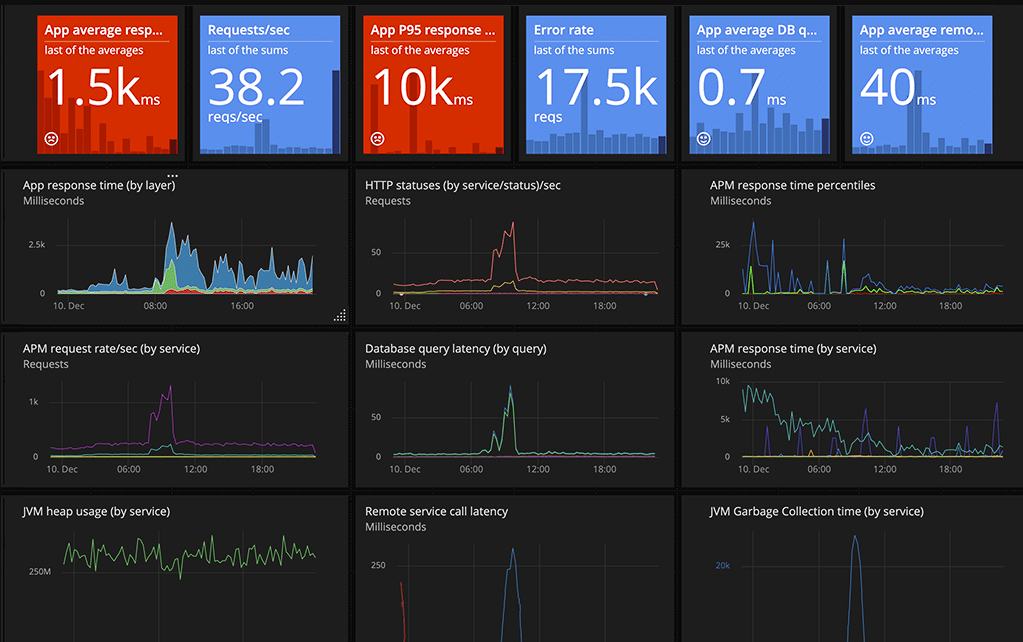
Datadog also has a simple UI with customizable dashboards and graphs that unifies real-time KPIs. Datadog comes with myriads of inbuilt dashboards such as Kubernetes, EC2, and RDS, plus it also allows you to build new dashboards. The interface is beginner-friendly and does NOT require query languages. There is room for improvement in the UI, though.
Monitoring Capabilities
Graphite’s functionality revolves around a passive time-series database with efficient graphing and query language features. Any other functionality required is addressed through third-party components.
- Carbon & whisper: Carbon & whisper are the two main components of Graphite. Now, there are numerous types of carbons, each with different behavior. With carbons, you can assemble a decent storage architecture back end. Likewise, a whisper is a database, somewhat similar to RRD (round-robin database). It offers quick access to numeric data over time. For long-term storage, carbon writes the data to whisper. And, both carbon & whisper supply the time series to graphite-web. Graphite-web queries these databases and offers an intuitive UI and API access to render graphs and dashboards.
Graphite can work with numerous collectors and backends, and this makes it the best choice. In addition, the simple plug-and-play nature of the tool makes it easier for the DevOps team to configure the monitor quickly.
To make its UI better, Graphite integrates with Grafana, where the data is visualized in better, more innovative, and sophisticated panels.
Datadog offers SaaS-based monitoring features along with visualization, metrics, and alerting functionalities to your cloud or hybrid environments. You can deploy the software anywhere- on multi-cloud, hybrid, On-Prem, or any IoT platform. It can track hundreds and thousands of critical metrics through 450+ pre-built, vendor-supported integrations. Moreover, Datadog also provides a Live Process Monitoring feature to track the impact of every process taking place in the infrastructure.
Datadog will collect a vast amount of data from various apps and tools and monitor its entire lifecycle. Along with monitoring, it also offers an alerting feature in case of a threshold overpass.
Also, Datadog provides deeper visibility into your modern apps by tracing requests from multiple end-to-end systems. In addition, it can carry out code instrumentation using open-source tracing libraries.
Installation
Graphite is self-hosted. Synthesize- Graphite’s installer will scan and install all core components one after the other. It will install three other extra components:
- Collectd – an agent for service metrics
- Memcached – speeds up data queries
- Statsite – a high-performance StatsD implementation
These components do the job of collecting metrics and visualizing the data points.
Recently, Hosted Graphite was launched as the newest SaaS solution for Graphite. It allows you to use both the Grafana and Graphite dashboard UI with a typical out-of-the-box installation.
Datadog installation is also straightforward. First, you need to create a Datadog account and install the agent on a platform of your choice, such as Windows, Ubuntu, CentOS, etc. Then, run the Agent’s status command, and the installation will start. Once the Agent is installed, it will collect metrics and events from hosts and send them to Datadog.
Reports
Graphite integrates with Targets-io, which is a dashboard application for reporting performance test results. The test results stored in Graphite can be benchmarked between test runs. It helps you get automated feedback on the application performance.
Datadog allows you to create custom reports with the help of Log Analytics API. In addition, the Datadog Reporter integration can schedule the delivery of reports via email.
Alerts
Graphite does not include an alerting feature right out of the box. However, it integrates with open-source tools such as Graphite-alerts and Graphite-beacon to help you generate alerts in case of Graphite threshold overpass. Moreover, it also has other integrations that allow you to create alerts on specific events.
Datadog features an ML-based alerting solution that efficiently detects problems in your apps, services, and infrastructure. Every alert is actionable and contextual to help reduce alert fatigue and minimize downtime, even in complex environments.
Plugins
Graphite has a long list of integrations for monitoring, collecting, and forwarding data such as collectd, sflow, Windows Server, logstash, sensu, Nagios Core, Grafana, riemann, and so many more.
Datadog has over 450+ prebuilt integrations to offer the best monitoring abilities.
OS Support
Graphite works well with Unix and Linux distributions.
Datadog Agent runs on your hosts to collect metrics and events and send them to Datadog for further monitoring and visualization. Agent software is open-source and works on Windows and Linux distributions such as Ubuntu, CentOS, Debian, Red Hat, SUSE, etc.
Support
Graphite is a business-specific tool; hence it involves fewer team members for its growth. Yet, Graphite features new content from time to time. For support, Graphite offers official documentation, GitHub projects, and StackExchange Community Support. In GitHub projects, you can see updated features and bug fixes so it can keep up with today’s DevOps teams.
Datadog offers support via LiveChat, In-app Event Stream Messaging, and email. You can also go through documentation and access guides regarding monitors, logs, APM, integrations, etc.
Training
Users can get training for Graphite through online courses.
On the other hand, Datadog has a Learning Center with multiple online courses. If you face any issues with the platform, you can contact their Learning team through learn@datadoghq.com or visit their #training slack channel.
Cost
Graphite monthly pricing starts from $19 for one user.
Yearly pricing starts at $200 for one user. Graphite caters to large companies as well as individual developers working on small-scale projects.
- Datadog Free package is for five hosts.
- Datadog Pro package starts at $15 per month per host for up to 500 hosts.
- Datadog Enterprise package starts at $23 per month per host.
- You can get custom pricing for 500+ hosts.
Graphite vs. Datadog: The Verdict
The use of monitoring and visualization tools is one of the critical factors for today’s DevOps teams. First, every company needs to understand its monitoring standards and requirements. And after this, they need to choose the best monitoring solutions and tools based on their set of features and functionalities.
Now, if you’re wondering Graphite vs. Datadog- which is better?
Well, Graphite is a widely-used, robust time-series data graphing system. Graphite is minimal, but it does its job very well. It deals with numeric data and comes with numerous out-of-the-box tools to get you started. In addition, integrating graphite-web provides an excellent UI for developers to monitor their apps. So, anyone who needs time-series monitoring for their infrastructure can choose Graphite. It is perfect even if you want a clustered solution that can store long-term historical data.
Datadog is also prominent monitoring, data visualization, and alerting solution. You can choose Datadog if you run applications on dynamic and hybrid cloud environments.


