
Our funding comes from our readers, and we may earn a commission if you make a purchase through the links on our website.
Grafana Review and Alternatives
UPDATED: January 8, 2024
Grafana is an open-source observability platform that helps you know more about the system’s performance and health via outstanding visualizations.
This in-depth Grafana review analyzes and evaluates this popular data visualization and observability platform. Will we provide the answers to questions like, what is Grafana? How does it work, how to use it? And what are some of its pros and cons?. In the final section, we summarize the top Grafana alternatives.
What is Grafana?
Grafana is an open-source web-based observability and data visualization platform. It is famous for its ability to create outstanding data visualizations. Grafana connects to different and multiple data sources or stores, including Elasticsearch, Prometheus, InfluxDB, and many more. It collects data, including metrics, logs, and traces, and produces the visualizations. The software may use an agent to push the data or query data using services like Graphite.
With Grafana, you can create highly customizable operational dashboards, charts, and graphs from the data collected. Use these dashboards for analysis and monitoring or share with the team. Grafana also provides a robust alert management system to create and unify alarms.
Product details
- Deployment Cloud-based. But for organizations with strict privacy and security measurements, Grafana also offers a self-managed environment (only for Enterprise).
- Mobile No mobile app available, but you can optimize your dashboards to look good on mobile. Use a web browser and open the following Live Grafana Demo to see how it feels.
- Pricing model Four plans, Free, Pro ($49/mo + usage), Advanced, and Enterprise.
- Customer support and knowledgebase Support is based on documentation, webinars, videos, blog, tutorials, and its public community forums. Full customer support is unavailable for a free account. Help is only available for Pro and Advanced.
- License Open-source under the AGPL-3.0 license. Find it on GitHub.
- Self-managed? Observability on cloud (for all plans) or self-managed for Grafana Enterprise.
- Free trial Grafana provides a free-forever-plan for the Grafana Cloud.
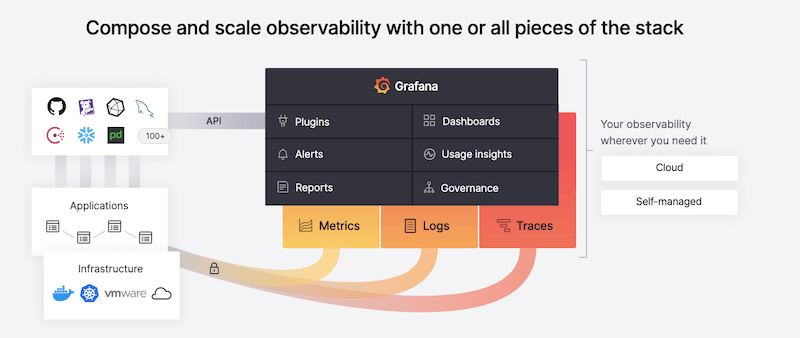
How does Grafana work?
The Grafana software uses a simple client/server architecture. The client (data producer or source) collects and pushes data to the Grafana Cloud (server) using agent-based technology. The Grafana Cloud may also query data (pull), aggregate it, store it, and produce visualizations.
The Data Producer and Source
Time-series data (metrics, logs, traces) generates from applications or infrastructure, such as Docker, Kubernetes pods, Jenkins CI server, Raspberry PI, VMs, IoT devices, and more. Grafana may use Grafana agents directly installed on the monitored target to collect and send data. Grafana may also integrate (without agents) with other third-party data sources like Prometheus and Graphite, Grafana Logs with Loki, and Grafana Traces with Tempo.
To integrate with your existing data source, you can use Grafana plugins. These data sources include anything from PostGre, Azure, Datadog, Splunk, Zabbix, and more via Grafana API.
The Grafana Server (Grafana Cloud)
The Grafana backend server collects the data and then aggregates, queries, or stores it. The Grafana frontend produces visualizations out of the processed data. Within the Grafana Cloud, you can create and tailor Grafana dashboards to suit your monitoring needs. Here, you can also set alerts and rules to keep you informed on any failures or performance bottlenecks.
Grafana supported types of data
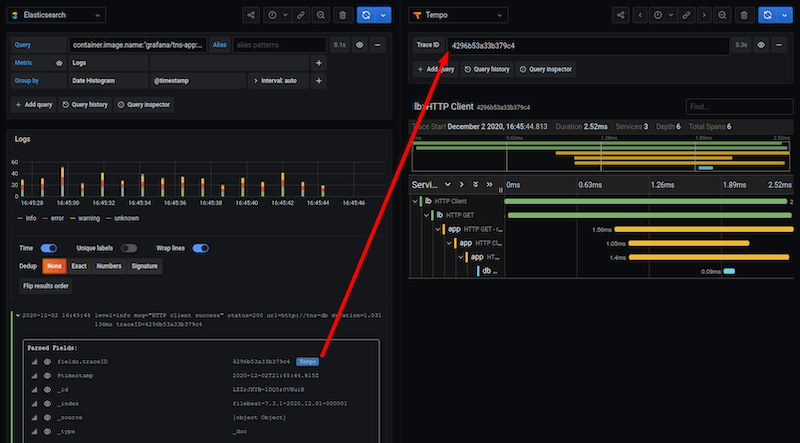
Grafana may aggregate, query, or store the following types of data: metrics, logs, or traces. Metrics may be anything from CPU utilization, temperature, bandwidth, storage, etc. The log data usually uses a standard format, for instance, the Syslog message format. The traces are data captures of how the components in a system operate, execute, and perform. Below is an example of how Grafana displays traces.
Grafana Full Feature’s Review
- Grafana’s Plugins Grafana provides an extensive list of plugins. The list is organized data sources (import data from external systems), apps (custom and out-of-box monitoring), and panels (add new visualizations).
- Agent-based monitoring Grafana comes with a telemetry agent collector designed to send metrics, logs, and traces to the cloud-based Grafana Observability platform.
- Grafana Alerts Grafana provides a single UI to generate and manage all your consolidated alerts. The Alerts Manager allows you to create alerting rules, evaluate rules and integrate outputs.
- Reports Grafana automatically generates PDF-based reports from the dashboards. You can configure reports to be sent to specific emails. This feature is only available in Grafana Pro, Advanced, and Enterprise plans.
- Customizable Dashboards Create personalized dashboards with adequate queries and display suitable properties. You can also share dashboards and panels with other users or publish them on the web.
- Usage insights Have a better understanding of how your system is being used and who is using it. This feature collects pre-processed data and shows it in the dashboard. It is available only in Grafana Advanced.
- Security and Governance Grafana Cloud (all plans) provides security features such as Administrative UI, Compliance (SOC2, ISO 27001, PCI, GDPR, CSA, and HIPAA), and users and permissions management. Grafana Pro and Enterprise provide more robust security features.
- Advanced and robust visualizations Grafana provides many visualizations to support your specific application. It comes out of the box with dashboards and various plugins to create your visualizations and monitors.
- Load testing with Grafana K6 Load testing gives you high-quality usage data to observe before going live. It simulates how would real behaviors affect your system so that you can improve it.
- Grafana Machine Learning Monitor the current state or predict the future state of all your systems. Grafana ML allows you to create adaptive alerts and plan for capacity—Grafana ML is only It is available in Pro and Advanced.
- Grafana On-Call A new on-call management tool. It provides simple workflows and interfaces to help reduce hard work on on-call management.
Grafana Cloud User Interface Review
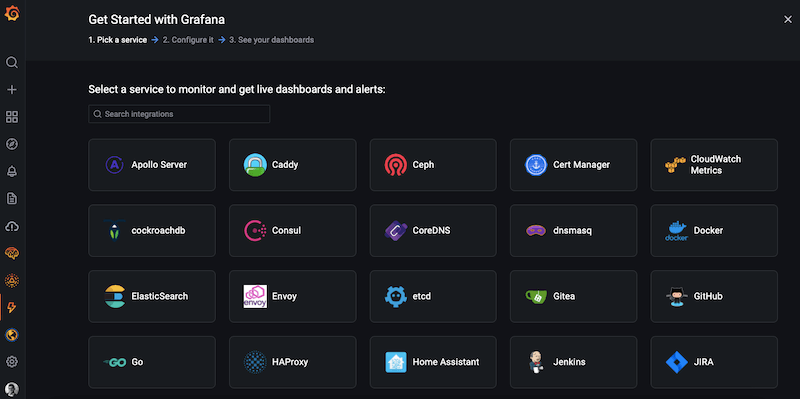
When getting started, Grafana provides a list of integrations (as shown in the screenshot below). If you have an existing data source, you can go ahead and choose it. But, you can also skip this step and configure it later. As you learn Grafana, you’ll be able to come back and customize your dashboard.
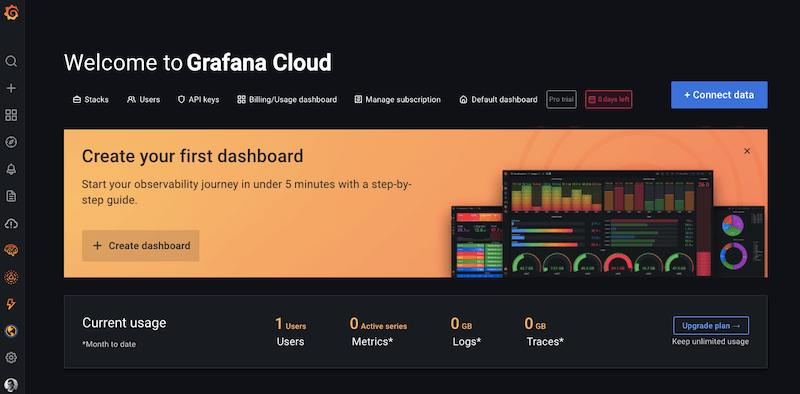
The Grafana Cloud UI is easy to use and highly intuitive
- The top-bar menu gives you access to administrative options, including Stacks, Users, API Keys, Billing/usage dashboard, Manage subscription, or Default dashboard.
- The right-hand bar menu allows you to create, manage, customize your dashboards, and create alerts and reports. From this bar, you’ll also be able to access Grafana ML, On-Call, synthetic monitoring, or basic settings.
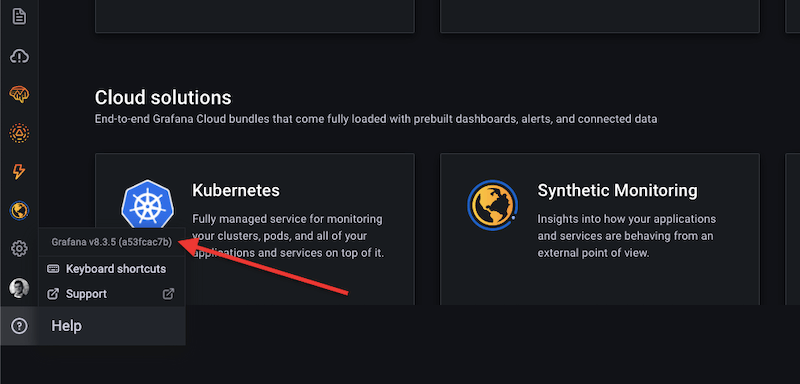
Checking the current Grafana version. Grafana Cloud is currently running on v8.3.5 version. To check the version, go to the “?” icon “Help” on the bottom of the left-hand menu bar. To know more about this version go to the latest release notes.
Integrating a data metrics source
The first step to starting with Grafana is connecting the data source, such as the Prometheus database, with Grafana. To do this, you’ll need to configure Grafana’s external data source and the query method.
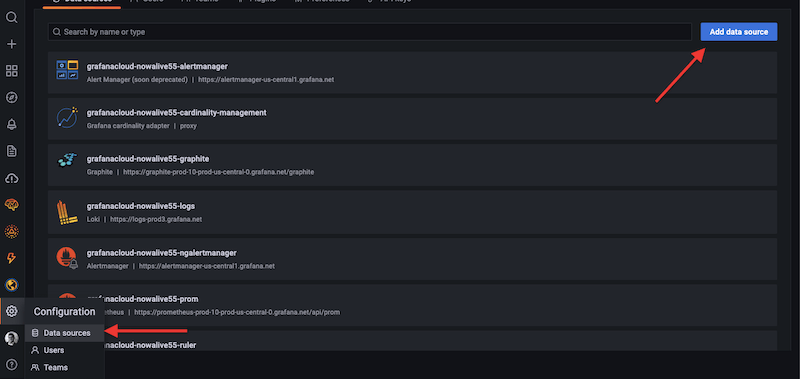
- Go to the “configuration” icon on the bottom of the right-hand menu and click “Add data source”.
- Choose your data source.
- If you can’t find your specific data source, you can look for the plugins on the third-party website.
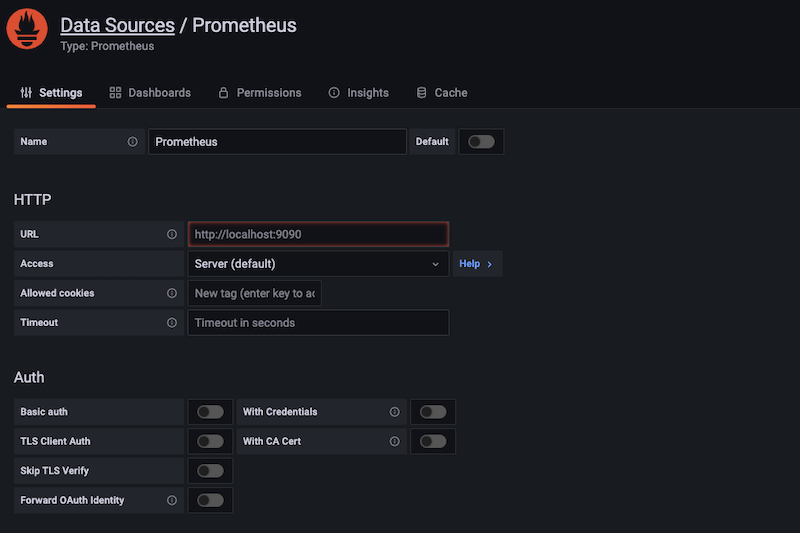
- For this case, let’s add Prometheus. Once the following window pops up, configure your server’s details, including URL, authentication, etc.
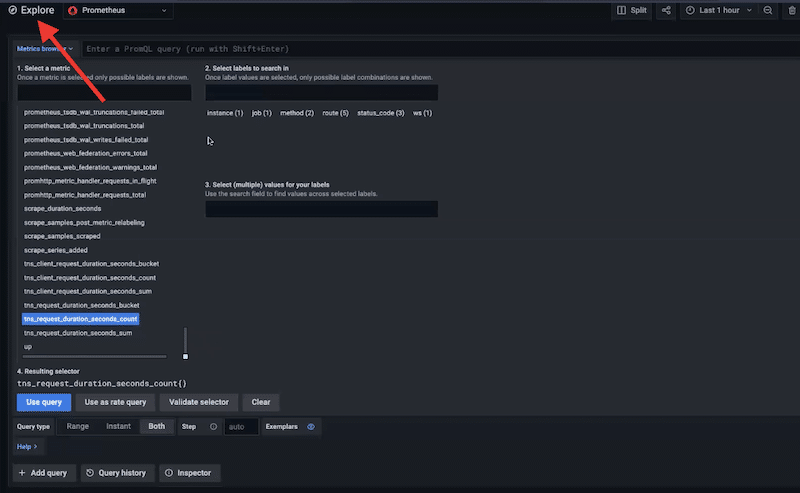
- Once you successfully add a metric’s data source, go to the Explore icon.
- The Explore option will show you all your metrics. From this menu, you’ll be able to configure your queries and start visualizing your metrics.
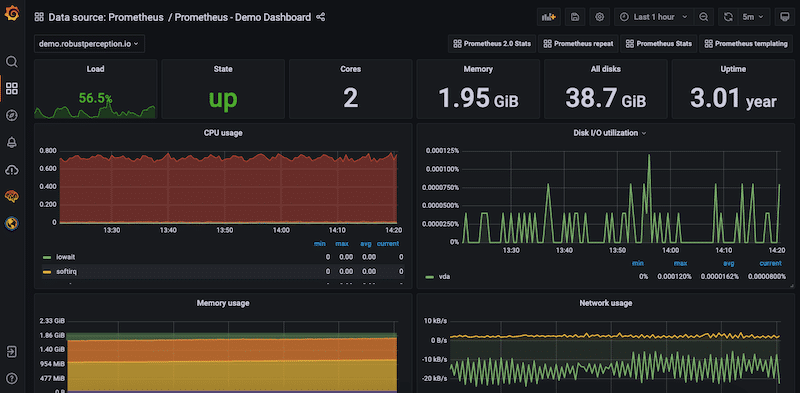
- Once, you customize your dashboard, you’ll be able to view your metrics in real-time, as shown in their Live Grafana Demo.
Grafana Pros and Cons
Although Grafana can collect and store metrics as any observability platform would, its strengths are found in its visualizations and customizable dashboards.
Pros:
- Easily integrate to Prometheus and Graphite data sources.
- Many plugins are available for almost any storage array or operating system.
- Free and open-source. If you want more, get the pro or advanced plan.
- Highly customizable software. Customize alerts, data sources, dashboards, notifications, and more.
- Grafana is the king of data visualizations. It graphs metrics coming from any data source.
- Send alerts and notifications to collaboration channels.
Cons:
- The highly customizable properties of Grafana make it challenging and time-consuming at the beginning.
- No data storage. If you also want to keep track of historical data, you’ll need a third-party storage solution.
- You’ll need to be skilled in programming languages like JSON and SQL to get the most out of Grafana.
Grafana Pricing
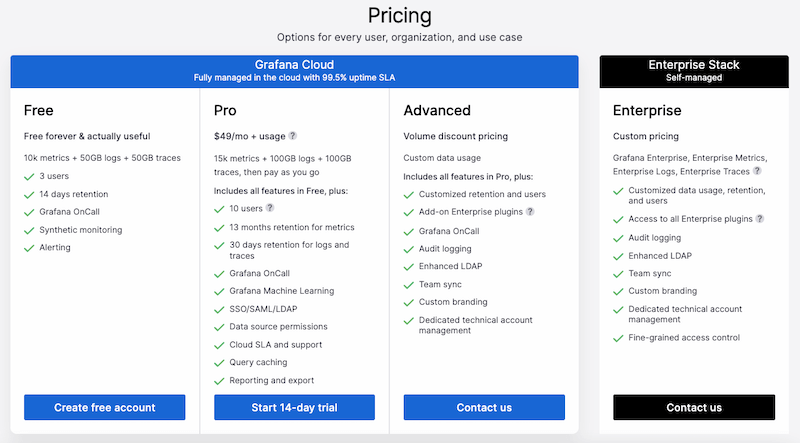
Grafana’s price is based on four different plans. As of February 2022, the prices are as follows
- Free ($0 forever),
- Pro ($49/month +usage),
- Advanced (volume discount pricing), and
- Enterprise (contact them).
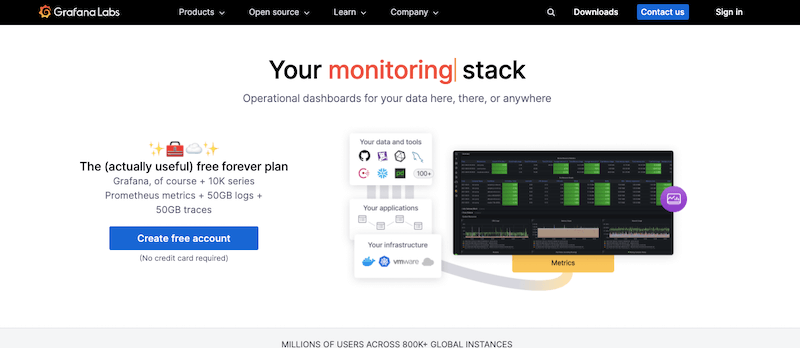
An excellent way to start with Grafana is to get the Free Forever plan. It allows you up to 10,000 series metrics, 14-day data retention, 50GB of logs and traces, up to three team members.
If you want to test the Professional Grafana Cloud, Grafana allows you to try a 14-day trial. This trial will enable you to test up to 15k metrics, 100GB logs + 100GB traces; for more, you pay as you go. Plus, Grafana pro allows up to ten team members and thirteen months retention for metrics.
Grafana Alternatives
- Site24x7 – FREE TRIAL Emerges as a strong alternative to Grafana, offering a comprehensive monitoring solution with user-friendly analytics for IT infrastructures and applications. Its capabilities to provide detailed insights on network performance, server health, and application reliability, along with advanced analytics and cloud infrastructure monitoring, make it an excellent choice for those seeking an integrated and holistic monitoring approach. Start a 30-day free trial.
- Datadog A cloud infrastructure and application monitoring as a Service offering. It has been recognized by Gartner as a leader in the 2021 Gartner Magic Quadrant for APM. Datadog integrates with many different tools so that you can see across your systems, applications, and services. Datadog offers a 14-day free trial.
- Kibana A free and open-source data visualization and search tool. It sits on top of the Elastic Stack, covering three open-source projects: Kibana, Logstash, and Elasticsearch. Kibana gets the data indexed in Elasticsearch and creates visualizations and charts to help with monitoring, managing, and securing the Elastic Stack cluster. Get a free Elastic Cloud Trial.
- Dynatrace A leader in automatic and intelligent observability. They provide an all-in-one cloud infrastructure and Application Performance Monitoring (APM) platform, including AIOps, DEM, and Automation. Dynatrace is also a leader in the 2021 Gartner Magic Quadrant for APMs. Sign up to get a 15-day free trial.
- New Relic One An all-in-one observability platform designed for Dev and Ops teams. It focuses on monitoring, debugging, and improving the performance and availability of your infrastructure, applications, and services. Sign up to get a New Relic perpetual free license.
- AppDynamics an APM, by Cisco, and full-stack observability platform. The APM provides real-time insights to improve the health and performance of your applications. The full-stack observability keeps track of business, user, application, infrastructure, network, and security. Subscribe to get a 15-day trial.
- Graphite An open-source monitoring tool that stores, retrieves, shares, and graphs metrics. With Graphite, you can track the performance of applications, services, websites, networks, and businesses. Graphite can be used together with Grafana since they can be easily integrated and complement each other. Learn how to install Graphite.
- Prometheus An open-source event monitoring and alerting tool. Prometheus and Grafana are more complementary than alternatives; however, you can still use one without the other. Prometheus is one of the best to collect time-series data and store it. However, it doesn’t have the flexibility to create charts and visualizations that Grafana does. Download Prometheus for free.
- Tableau A robust data visualization platform used for Business Intelligence (BI). It transforms raw data into a human-readable format and creates visualizations in the form of dashboards and worksheets. Tableau is famous for its data blending, real-time analysis, and data collaboration. Sign up to get a free Tableau trial.
Grafana Review and Alternatives FAQs
What are some use cases for Grafana?
- Monitoring and visualization of IT infrastructure, including servers, networks, and applications
- Business intelligence and analytics, including data visualization and exploration
- IoT data visualization and analysis
- Logging and data analysis
What data sources and backends does Grafana support?
Grafana supports a wide range of data sources and backends, including time-series databases such as Prometheus, Graphite, and InfluxDB, as well as relational databases such as MySQL, PostgreSQL, and Microsoft SQL Server. It also supports cloud-based data sources such as:
- Amazon Web Services (AWS), Google Cloud, and Microsoft Azure.
- What are some popular Grafana plugins?
- Worldmap Panel: for displaying data on a world map
- Zabbix Plugin: for integrating Grafana with Zabbix monitoring
- Pie Chart Panel: for displaying data in a pie chart
- Alertmanager Plugin: for integrating Grafana with Prometheus Alertmanager
- Table Panel: for displaying data in a table format
How can I get started with Grafana?
You can download Grafana from the official website and install it on your own infrastructure. Once installed, you can configure data sources, create dashboards, and set up alerts and notifications. There are also many resources available online to help you learn Grafana, including documentation, tutorials, and community forums.

