![]()
Monitoring MySQL
with PRTG

Comprehensive monitoring of your MySQL databases
All important SQL queries at a glance, at all times
Prompt notifications in the event of errors
Less downtime
Optimized performance
MySQL monitoring with PRTG
Jump to the topic of your choice
- What is MySQL?
- The advantages of MySQL
- MySQL performance: The basis for a number of other servic
- Why PRTG is the ultimate MySQL monitoring tool
- Switching to PRTG is safe and easy
- How to monitor your MySQL database with PRTG
- Configuring the MySQL sensor is quick and easy
- PRTG is a comprehensive database monitoring tool
What is MySQL?
MySQL is an open source database management system based on structured query language (SQL). Along with being available for free, MySQL has the advantage that is runs on almost all platforms. MySQL is one of the most widely used database systems in the world, and many dynamic websites are built around it. Along with the open source variety, there is also a commercial version of the database system. To use MySQL for a commercial product, you will need to purchase a license.
MySQL has a pluggable storage engine architecture that allows to select an individual storage engine like InnoDB or MyISAM.
The advantages of MySQL
Large market share
MySQL boasts the largest market share of any open source database. Consequently, there is no shortage of books, articles, and support on MySQL.
Simple administration
Compared to other databases, setting up and administrating MySQL is easy. Tools such as MySQL Administrator are available to help DBAs to get started.
High speed
One of the biggest advantages of MySQL: It’s lightning quick! Thanks to its simple structure, MySQL is extremely efficient when it comes to resources and uses nearly no memory.
MySQL performance: The basis for a number of other services
If your database runs at a snail’s pace, returns errors for certain queries, or is not available at all, then the performance and quality of all applications dependent on that database will also suffer. To ensure your applications are always available and can be accessed as quickly as possible , you will need to monitor your MySQL databases. By doing so, you will create, by way of your database, the basis for the availability and performance of all your services in the tiers.
Why PRTG is the ultimate MySQL monitoring tool
![]()
Less downtime
If your website, online store, or web application relies on a MySQL database and something goes wrong with this database, then the site itself will suffer: it may be displayed incorrectly, certain parts may not be available, or it may not load at all.
PRTG lets you keep a constant eye on the availability of your MySQL database. With PRTG, you will reduce database downtime and be able to immediately react to disruptions. As a result, you will enjoy greater customer satisfaction and improved worker productivity.
![]()
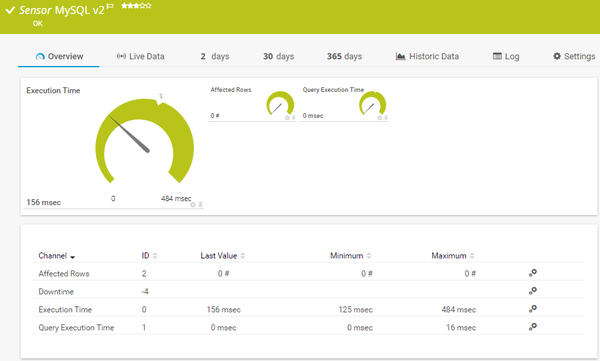
A concise overview
The comprehensive MySQL monitoring tool PRTG not only monitors the availability of your databases, but also other MySQL performance data. To do so, PRTG automatically queries databases and measures the time required for establishing a connection, executing an SQL query, handling a transaction, and disconnecting. Your PRTG dashboard provides easy-to-read stats on the total request time.
![]()
A detailed look
PRTG also lets you monitor specific datasets from your MySQL database. You can, for example, have certain information from your online store or ticket database displayed. To do so, simply define your own SQL queries in PRTG and monitor their return values.
Along with these return values, PRTG MySQL Monitor will show you the execution time of the query and how many rows were queried in the data tables. Use customizable threshold values to trigger automatic alerts and receive notifications, such as when an item in your online store is about to run out of stock.
![]()
Custom reports
One of the many useful PRTG features is the creation of custom reports. You’re free to configure the content of your reports any way you please, and can then call up the reports "on the fly” or create them automatically (daily, weekly, or monthly), before having them sent by email, for example.
PRTG allows you to create reports with all the data that is important for your work. The reporting feature is also the perfect way to keep your colleagues and superiors in the loop. Simply choose the relevant information and have the reports sent to the corresponding managers automatically. For example, you can forward the most important website stats to the marketing team or have the number of open tickets sent to the support team automatically.
![]()
Built-in alarm feature
PRTG MySQL monitoring software includes an alarm feature. If your database is unavailable or if certain queries do not return the desired values (or return incorrect ones), then you can choose to be notified by PRTG automatically.
This alert may take the form of an email, SMS, or push notification to your smartphone. You’ll be informed promptly, before the problem escalates. Thanks to the PRTG API, you can also create user-defined notifications and have scripts or HTTP actions executed automatically.
Enjoy the feeling of complete control with PRTG!
PRTG lets you keep a constant eye on your MySQL databases – even while on the go
Set up PRTG in minutes and use it on almost any mobile device.


Switching to PRTG is safe and easy
There are many MySQL server monitoring tools on the market. PRTG has the following advantages:
![]()
No hidden fees
With a license you can use PRTG in its entirety. Included are all sensors, as well as the notification system. We offer the utmost in transparency during the purchasing process. The free trial version comes with 100 free sensors, and during the trial you can also try all the sensors PRTG has on offer.
![]()
Ease of use
Open source tools like Nagios have certain advantages. But they also come with the drawback that you have to develop a great deal on your own if you hope to enjoy sophisticated monitoring solutions. With PRTG, you get comprehensive, professional software with speedy support.
![]()
Extensive monitoring
Many administrators use a variety of different monitoring tools for special situations. Managing such a combination of tools takes time and energy. And that translates into countless working hours which could be spent more efficiently. Moreover, you usually don’t get a concise overview.
John Krull, CTO, Oakland Unified School District, USA
“Our network engineers really love PRTG, because of its customization”
Trusted by 500,000 users and recognized
by industry analysts as a leader

“Fantastic network and infrastructure monitoring solution that is easy to deploy and easier still to use. Simply the best available.”

“Software is absolutely perfect, Support is superior. Meets all needs and requirements, this is a must have solution if you are needing any form of monitoring.”

“The tool excels at its primary focus of being a unified infrastructure management and network monitoring service.”
How to monitor your MySQL database with PRTG
All it takes are a few short steps to get started with PRTG MySQL Monitor.
PRTG comes with a pre-defined sensor for MySQL monitoring. In general, you can start using the sensor
immediately to monitor some basic information regarding your database, such as availability and execution time.
For a more detailed look, add your own SQL queries by way of a separate file
Configuring the MySQL sensor is quick and easy
![]() How PRTG defines sensors
How PRTG defines sensors
In PRTG, “sensors” are the basic monitoring elements. One sensor usually monitors one measured value in your network, e.g. the traffic of a switch port, the CPU load of a server, the free space of a disk drive. On average you need about 5-10 sensors per device or one sensor per switch port.
![]()
Create an SQL query
Use self-defined SQL queries to monitor a variety of KPIs, such as:
- The number of website visitors
- Sales figures from the online store
- Open tickets for customer support
The possibilities are virtually endless. The only requirement: You must define an appropriate SQL statement.
Here is an example of what this might look like:
SELECT count(idorder), sum(value), avg(value), GROUP_CONCAT(customer SEPARATOR ', ') from test.order
![]()
Save the script
Save your entire SQL statement in a separate query file on your hard drive in the PRTG program folder. Be sure to use the .sql file extension for the file and select the following path:
C:\Program Files (x86)\PRTG Network Monitor\Custom Sensors\sql\mysql
![]()
Create the sensor in PRTG
Before adding the sensor to PRTG, check to make sure your environment meets the requirements (for more information, see our manual). Be especially careful to enter the correct access data in the device’s settings, as the device will represent your database in PRTG.
Click on “Add sensor”, on the device which is to receive the sensor, search for MySQL and choose the MySQL v2 sensor. In the dialog box that follows, enter the sensor name and the name of the database that is to be monitored.
Then choose the SQL file which contains your SQL statement (from step 2) and configure the sensor however you please. Decide, for example, if you simply wish to monitor the query execution time or if you would also like to analyze and process data table values. If you choose the latter, then specify which values should be read from the table.
PRTG makes your job easier
Our monitoring software frees you to focus on other tasks by promptly notifying you of potential issues.
![]()
Save effort
PRTG gives you one central monitoring tool for your servers and entire network. Enjoy a quick overview of your whole infrastructure via our dashboard and app.
![]()
Save time
Getting started with PRTG is a breeze. Setting up or switching from another network monitoring tool is easy thanks to the auto-discovery and pre-configured device templates.
![]()
Save money
80% of our customers report substantial cost savings with network monitoring. Your costs of licenses will likely pay for themselves within weeks.
PRTG is a comprehensive database monitoring tool
PRTG not only supports MySQL, but is also suitable for monitoring other database software and your SQL server. Preconfigured sensors are available for all the major database environments, including Microsoft SQL, Oracle SQL, and PostgreSQL. And our ADO SQL Sensor can be used with almost any other database system. This sensor will monitor any data source that is available via OLE DB or ODBC.
Bring your monitoring experience to the next level with our PRTG product extensions
Enhance the functionality of Paessler PRTG & benefit from an extended feature set for data export and advanced database monitoring.
Data extraction for easier monitoring data analysis
- Export raw monitoring data from PRTG & store it in your relational database – no programming skills needed
- Have all important data available in a single database
- Generate your own analyses & reporting using third-party tools
Database monitoring with extended database support
- Monitor the health & performance of databases that go beyond the standard PRTG set
- Use predefined SQL queries for easier setup of your database monitoring
- Manage and test database queries & share them in your team
We asked: would you recommend PRTG?
Over 95% of our customers say yes!
Paessler AG conducted trials in over 600 IT departments worldwide to tune its network monitoring software closer to the needs of sysadmins.
The result of the survey: over 95% of the participants would recommend PRTG – or already have.

Create innovative solutions with Paessler’s partners
Partnering with innovative vendors, Paessler unleashes synergies to create
new and additional benefits for joined customers.


UVnetworks
UVexplorer integrates tightly with PRTG to bring fast and accurate network discovery, detailed device inventory, and automatic network mapping to the PRTG platform.

ALSO INTERESTING:
Network Manager: PRTG monitors all your network activities (via SNMP, NetFlow, IPFIX, and other protocols), hardware like routers or NAS devices, and your web servers in real time. Even remote networks can be monitored by PRTG.
Email monitoring: Here you will learn all you need to know about email monitoring with PRTG, such as how to use Round Trip sensors to monitor Microsoft Exchange Server and which are the best metrics to monitor.
Linux network monitoring: PRTG monitors networks running on Linux in real-time and keeps a constant eye on metrics like bandwidth and disk usage or uptime and performance of your servers.
Server Monitoring: PRTG is the perfect tool to monitor all key metrics of your servers, manage your resources and to optimize your overall network performance.
“Easy to implement and configure with good technical support.”
R. v. S., ICT Manager at Heinen & Hopman Eng BV

PRTG: The multi-tool for sysadmins
Adapt PRTG individually and dynamically to your needs and rely on a strong API:- HTTP API: Access monitoring data and manipulate monitoring objects via HTTP requests
- Custom sensors: Create your own PRTG sensors for customized monitoring
- Custom notifications: Create your own notifications and send action triggers to external systems
- REST Custom sensor: Monitor almost everything that provides data in XML or JSON format
Still not convinced?
![]()
More than 500,000 sysadmins love PRTG
Paessler PRTG is used by companies of all sizes. Sysadmins love PRTG because it makes their job a whole lot easier.
Still not convinced?
![]()
Monitor your entire IT infrastructure
Bandwidth, servers, virtual environments, websites, VoIP services – PRTG keeps an eye on your entire network.
![]()
Try Paessler PRTG for free
Everyone has different monitoring needs. That’s why we let you try PRTG for free. Start now with your trial.
|
PRTG |
Network Monitoring Software - Version 24.2.94.1400 (April 10th, 2024) |
|
Hosting |
Download for Windows and cloud-based version PRTG Hosted Monitor available |
Languages |
English, German, Spanish, French, Portuguese, Dutch, Russian, Japanese, and Simplified Chinese |
Pricing |
Up to 100 sensors for free (Price List) |
Unified Monitoring |
Network devices, bandwidth, servers, applications, virtual environments, remote systems, IoT, and more |
Supported Vendors & Applications |
|
Combining the broad monitoring feature set of PRTG with IP Fabric’s automated network assurance creates a new level of network visibility and reliability.