
Our funding comes from our readers, and we may earn a commission if you make a purchase through the links on our website.
Dynatrace vs Datadog
UPDATED: April 4, 2024
Today's software development is all about speed and quality. You must deploy software faster than your competitors, fail faster, and reinvent yourself more quickly. To achieve speed, Toil must be eliminated. Toil is defined as manual, repetitive procedures that have no long-term value and scale up as demand grows, which is why developers and operators should concentrate on their key responsibilities.
A developer and an operator's task is to create and maintain the application. Therefore, both must pay attention to how the app reacts to various scenarios.
What Do Dynatrace And Datadog Do?
One of the hottest categories of the market is cloud computing. Unfortunately, the margin for error on hosted apps has become razor-thin as cloud infrastructure like Microsoft, Amazon, and Google has become the backbone of many computing environments. If a robust solution is unavailable for even a short time, it might spell disaster—or, at the absolute least, irate clients.
With the rise of cloud computing, there has been an increase in the need for cloud infrastructure monitoring to ensure that everything is running well.
Datadog (DDOG) and Dynatrace are two newcomers to the market (DT). Let's look at these two monitoring tools and evaluate which one appears to be the superior investment right now.
Dynatrace Product Highlights
Dynatrace is an application monitoring solution that assists customers with effective performance monitoring and constant system availability. The tool is quick and dependable, and it makes extensive use of digital apps to stay current with technology. Every transaction is tracked and logged, allowing them to see how it progresses from browser to database.
Key Features of Dynatrace
- Automatic Discovery: Dynamically maps and visualizes your environment, offering insights into all components and their interactions.
- AI-Powered Analysis: Leverages artificial intelligence to automatically detect and diagnose issues, reducing manual effort.
- Full Stack Depth: Provides deep monitoring capabilities across the entire technology stack, from application to infrastructure.
- User Experience Tracking: Captures user interactions to identify experience issues and optimize performance accordingly.
- Real-Time Performance Metrics: Delivers immediate access to performance data, enabling swift decision-making and issue resolution.
The infrastructure is also kept an eye on. If there are any performance concerns, the program examines the infrastructure for servers, databases, and codes to determine what is causing the problem. Due to its intricate nature and more advanced technology, Dynatrace is difficult to comprehend. Nevertheless, this is an application performance management tool in its purest form.
Pros:
- Self-Configuring Monitoring: Automates the setup process, significantly reducing the complexity and time required for deployment.
- Proactive Problem Resolution: Identifies and diagnoses issues before they impact users, enhancing overall system reliability.
- Comprehensive Coverage: Offers extensive visibility into every layer of the technology stack, ensuring no component is overlooked.
- User Experience Insights: Provides detailed analysis of user behavior, helping to refine and improve application performance.
- Instantaneous Data Access: Ensures critical performance metrics are always at your fingertips for timely analysis and action.
Cons:
- Learning Curve: The wealth of features and data available can overwhelm new users, requiring a period of acclimatization.
This APM tool can be used with any application that provides end-to-end transaction information to check and monitor performance on a big scale. All of this information is saved on a server. As a result, anytime the application's performance issues develop, it's a good idea to review the logs and see what's going on. This transaction history tracing will allow you to see the specifics of the transactions and the external services linked to them.
Datadog Product Highlights
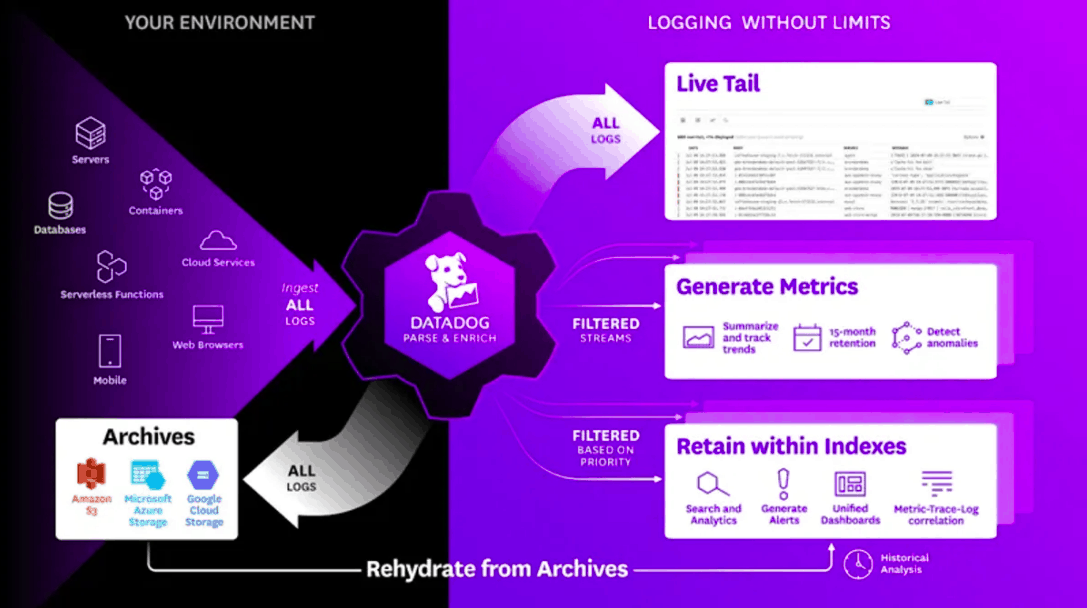
Datadog is a next-generation SaaS-based server, application, database, and service monitoring and analytics solution. It can diagnose problems and improve end-to-end application performance. The tool aids in the collection of log events from a variety of apps, services, and systems. It allows users to collect statistics on delay and error distribution from all parts of the development stack.
Key Features of Datadog
Root Cause Identification: Enables swift pinpointing of issues within complex systems by analyzing performance metrics.
Metric Correlations: Automates the detection of anomalies across thousands of metrics, simplifying fault identification.
Comprehensive Documentation: Offers detailed guides and information, empowering users to resolve queries independently.
Real-Time Dashboards: Provides immediate access to data, ensuring teams can monitor full-stack observability effectively.
Advanced Alerting: Utilizes AI to notify teams of critical issues, enhancing application performance insights.
Datadog's accessible dashboards ensure that data is available to teams when they need it and that it can be viewed in real-time to give full-stack observability. With its advanced alerting feature, the tool assists in notifying relevant teams about issues. It monitors user activity and runs AI-powered tests utilizing machine learning to discover business-critical faults and abnormalities, providing insights into application performance.
Pros:
Versatile Monitoring: Facilitates comprehensive tracking of user interactions and network performance through customizable templates and widgets.
Holistic Network Insights: Offers a complete view of network performance, including both internal and external monitoring capabilities.
Immediate Updates: Reflects network changes in near real-time, keeping administrators informed.
Scalable Solutions: Supports business growth with flexible monitoring options and pricing.
Cons:
Trial Limitations: A more extended trial period would be beneficial for thorough evaluation.
The Datadog Agent is open-source, and the source code may be found at DataDog/datadog-agent on GitHub. Transport Layer Security (TLS) and HTTP Strict Transport Security are used to protect any data exchanged between Datadog and Datadog users (HSTS). The Datadog program is unreachable if encrypted communication is disrupted.
Feature Comparison: Dynatrace Vs. Datadog
| Feature | Dynatrace | Datadog |
|---|---|---|
| API | Yes | Yes |
| Data Export | Yes | Yes |
| Data Import | Yes | Yes |
| External Integrations | Yes | Yes |
| Multi-User | No | Yes |
| Notifications | Yes | Yes |
| Malware Protection | No | No |
| Bug Tracking | No | No |
Dynatrace Vs. Datadog Head-to-Head
Now that we have discussed both the software in detail let’s look more into their features.
User Interface
An APM tool's dashboard is a crucial component. They give users a visual representation of application performance and track and evaluate essential performance parameters used to monitor the application, business, and specific processes.
Copy, import, and export are all available in Datadog dashboards. Screen boards and time boards are the two types of dashboards available in the tool. Screen boards are constantly updated and can contain various things such as photos, graphs, and logs. To debug issues, time boards automatically offer either fixed or real-time data.
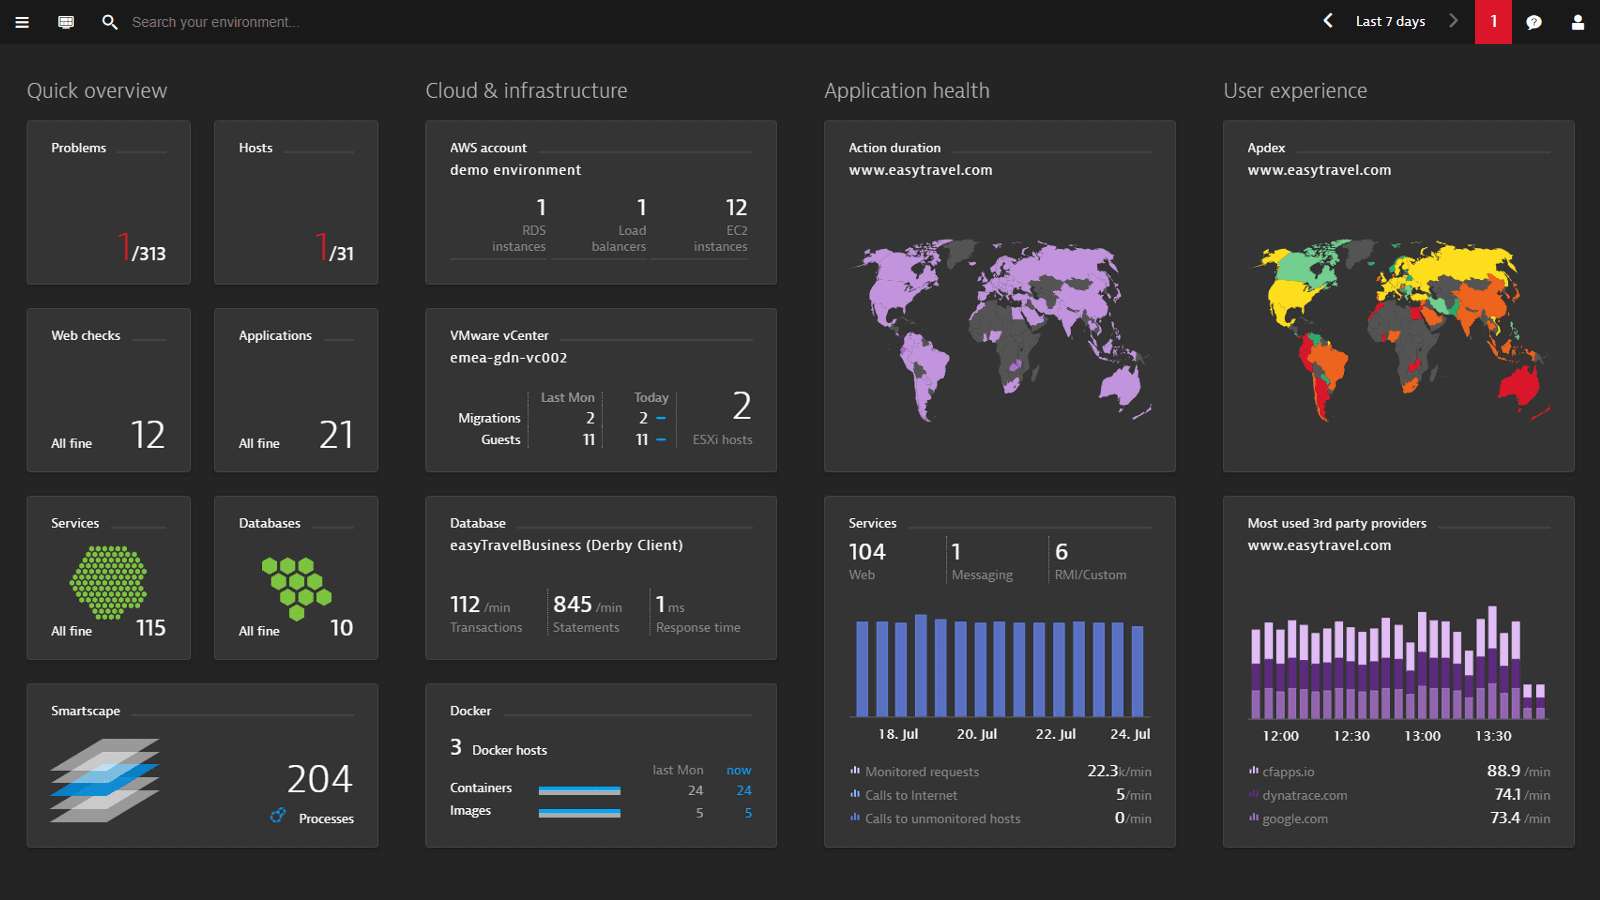
Each Dynatrace dashboard has tiles and charts that can be customized, modified, and positioned to match your specific requirements. In addition, many preloaded tiles are available and several customizable tiles that you may use to visualize the most critical metrics to the dashboard users. For example, to see a list of monitored entities, select any dashboard tile that reports on monitored entities in your environment (hosts, processes, or services).
Database Monitoring Capabilities
A monitoring tool's objective is to track how an application behaves throughout its life cycle. The initial step in observing is to install the monitoring agent and configure the required metrics you want to watch (you don't want to monitor everything). Next, you should track the main metrics that characterize the user experience and the resources and components whose absence could affect the user experience.
Dynatrace finds databases and assists in lowering overhead costs. Users can take a deep dive into each SQL statement level and perform a detailed analysis. It also allows users to locate expensive statements (those that can read a large amount of data) and deduce the source of slow-performing statements. It automatically detects databases used by Java, PHP, Node.js, and.Net applications, removing the need to configure new or existing database instances. Dynatrace categorizes database activity to provide you with a better understanding of how a database is used. Its live view feature displays a database in real-time, classifying it as Sessions, Wait for states, slow queries, and Locks.
All of your databases' query metrics and plans can be viewed and explained in one location with Datadog Database Monitoring. Database Monitoring allows you to immediately identify costly and slow queries and delve into specific execution details to identify bottlenecks. Furthermore, the correlation of query and host metrics makes it simple to recognize and comprehend the influence of resource limits on database performance.
Installation
On a Linux server, installing the Dynatrace and Datadog agents is highly similar and straightforward. However, Dynatrace needs more resources to isolate a tenant's environment, but Datadog separates in a different approach.
Datadog supports all major operating systems including, Debian, Ubuntu, Amazon Linux, CentOS/Red Hat, Fedora, and SUSE. If you look closely, you'll notice that they all download the same script, and I'm not sure why they don't designate it as Linux.
Nonetheless, it appears that Datadog can be deployed in more agents, but a closer check reveals that Dynatrace can also be installed on z/OS.
In general, both are simple to install in mainstream operating systems. In addition, on z/OS-based mainframes, Dynatrace OneAgent can also be installed.
Reports
The general environment (Dynatrace score), applications, services, and infrastructure are all included in the reports. In addition, Dynatrace calculates a score for each report segment to show you how well your monitoring stack components performed over the previous week.
You don't need to sign in to Dynatrace to share service quality reports with others. Non-Dynatrace users receive a message with a private link that allows them to see the report without signing into Dynatrace when you share a report with them.
Datadog Reporter allows you to schedule reports and have them emailed to you at a specific time. You can choose from your existing dashboards, add the URL to the reporter web application, and specify the mailing interval. Your users will receive the report as an attachment in their email, which they may open to view. There is no limit to the number of reports you can create and submit right now.
This integration will create a new dashboard named Datadog Reporter in your Datadog instance. You may directly access the application by navigating to the dashboard and registering a new user from that iFrame. In the DD Reporter program, your Datadog account will not work. You'll need to create a new account.
Plugins
Dynatrace integrates with the below-mentioned applications and business systems:
Slack
PagerDuty
ServiceNow
OpsGenie
ManageEngine AlarmsOne
HipChat
VictorOps
Amazon EC2
Datadog has the following integrations:
| Amazon
Cacti CouchDB Docker Google Cloud Platform Microsoft IIS MySQL Nagios |
Airbrake
Cassandra Centos Fabric GitHub Jenkins MongoDB New Relic |
Apache
CHEF Capistrano Debian Git Java MemCached Node |
OS Support
Dynatrace is available on-premises or as SaaS. Operating systems are Macintosh, Windows, Android, and iOS.
Datadog agents are accessible for various platforms, including Apple Mac OS X, Microsoft Windows, Ubuntu, Debian, CoreOS, Fedora, Docker, Puppet, Chef, etc.
Support
Both Dynatrace and Datadog provide 24/7 Live Support and are also offer Multi-Platform Support.
Training
These instructor-led live Dynatrace training sessions, available online or onsite, explain how to utilize Dynatrace to efficiently diagnose an organization's applications, services, and infrastructure across various platforms and hardware through engaging hands-on practice.
Datadog offers training through webinars and a learning center. Datadog training is available both online and offline.
Cost
Dynatrace has three price plans: enterprise, self-service, and webscale, all dependent on consumption. For additional information about the vendor's pricing, contact them directly.
Datadog offers one cost-free bundle and two priced plans:
Free: $0 per host per month
Pro: $15 per host per month
Enterprise: $23 per host per month
Dynatrace Vs. Datadog: The Verdict
Datadog and Dynatrace are basically “Performance Monitoring” applications. Firms like Airbnb, Facebook utilize Datadog, and Spotify, whereas Dynatrace is used by SAP Hybris, ruxit, and useinsider.
Similarly, Dynatrace is ideal for those who want a more straightforward AI for managing whatever they’re using the host for through automated features. Meanwhile, Datadog is more suited to companies in the Computer Software industry.
In conclusion, both tools are excellent and have unique uses that they work best with!
Dynatrace vs Datadog FAQs
What is Dynatrace?
Dynatrace is a cloud-based software intelligence platform that provides application and infrastructure monitoring, automation, and intelligence for cloud-native and hybrid environments. Dynatrace uses artificial intelligence to deliver real-time insights into application performance and user experience.
What is Datadog?
Datadog is a cloud-based monitoring and analytics platform that provides real-time visibility into infrastructure, applications, logs, and user experience. Datadog uses machine learning and analytics to deliver insights and performance metrics to help IT teams identify and resolve issues quickly.
What are the differences between Dynatrace and Datadog?
While both Dynatrace and Datadog provide monitoring and analytics capabilities, there are some key differences between the two platforms. For example:
- Focus: Dynatrace is primarily focused on providing APM (Application Performance Management) capabilities for cloud-native and hybrid environments, while Datadog provides broader monitoring and analytics capabilities for a wide range of IT systems and applications.
- AI capabilities: Both Dynatrace and Datadog use artificial intelligence and machine learning to provide insights, but Dynatrace is known for its AI capabilities, which allow it to deliver real-time insights into application performance and user experience, and detect anomalies and issues automatically.
- Integrations: Datadog has a larger ecosystem of integrations with other tools and platforms, while Dynatrace has fewer integrations.
- Cost: The cost of Dynatrace is generally higher than that of Datadog.
Which platform is better, Dynatrace or Datadog?
The choice between Dynatrace and Datadog depends on the specific needs and requirements of the organization. Dynatrace is a good choice for organizations that need advanced AI and automation capabilities for APM in cloud-native and hybrid environments. Datadog is a good choice for organizations that need a broader range of monitoring and analytics capabilities for a wide range of IT systems and applications.

