
Our funding comes from our readers, and we may earn a commission if you make a purchase through the links on our website.
The Best Windows Server Uptime Monitoring Tools
UPDATED: March 23, 2023
No matter how big your brand is or what your website does, the only purpose behind getting digital is to attract more potential customers to your business. But what if your website is too slow? No visitor will prefer to stare at the monitor all the time and wait for the website to run. There can be uptime issues within your network responsible for an unreliable server and a slow website. It is best to set a command center or allot a monitoring team to detect and diagnose uptime and solve the related uptime issues. Simultaneously, keep an eye on the device and update data visualizations automatically.
A one-second delay in website loading may drive away your traffic, increase your bounce rate and reduce conversions. Various aspects might affect the loading of your site. However, we have different ways to track your uptime and fix the issue to keep visitors satisfied.
Although there are many useful tools built into Windows for monitoring uptime, getting an enterprise-wide view of all server availability requires more comprehensive software.
Here is our list of the best Windows Server uptime tools:
- SolarWinds Network Performance Monitor – FREE TRIAL This network monitoring and management system provides more than just availability tests. IT can query servers running Windows Server or Linux across a network or across the internet. While watching over server connectivity, the system also makes constant checks on network device statuses. Runs on Windows Server. Download a 30-day free trial.
- Site24x7 Website Monitoring – FREE TRIAL A cloud-based service that offers availability and performance testing for servers, networks, websites, and cloud resources. Start a 30-day free trial.
- ManageEngine OpManager – FREE TRIAL A network and server monitor that includes availability checks for servers and network devices and can monitor multiple sites across the internet. Available for Windows Server and Linux. Start a 30-day free trial.
- UptimeRobot An online website availability tester and SSL checker that is available in free and paid versions.
This post will show you how to check System Uptime in Windows Server 2012, 2016, and 2019.
Check Uptime in Windows Server 2016 and 2019
There are several ways to check uptime in Windows servers in 2016 and 2019.
Check Windows Uptime with Net Statistics
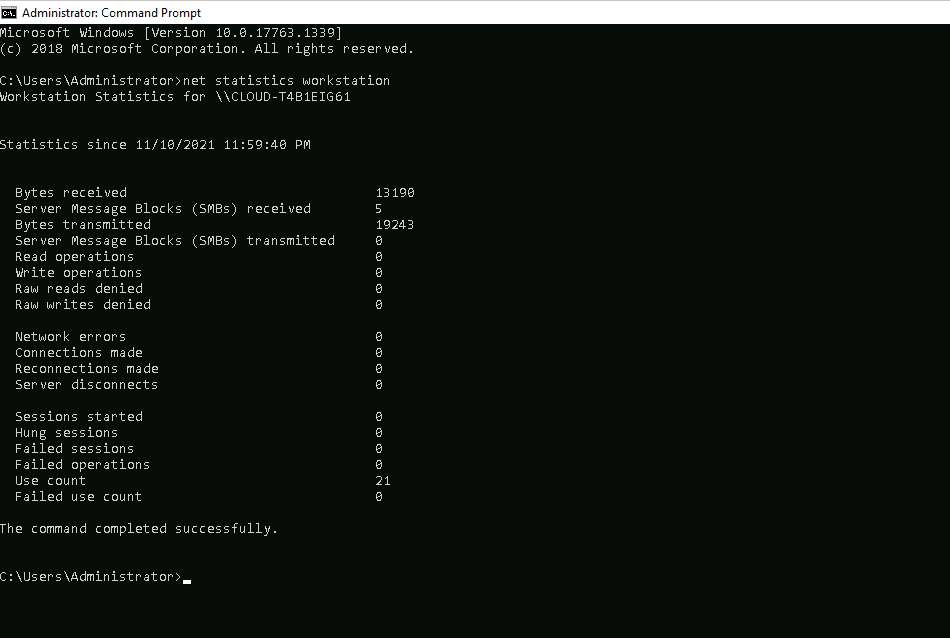
You can quickly check the system uptime using the Net Statistics utility. The net stats command provides general information about your system, including system uptime.
Open the command-line interface and run the following command to check uptime in Windows:
net statistics workstation
You should see your system uptime on the following screen:
Check Windows Uptime with SystemInfo
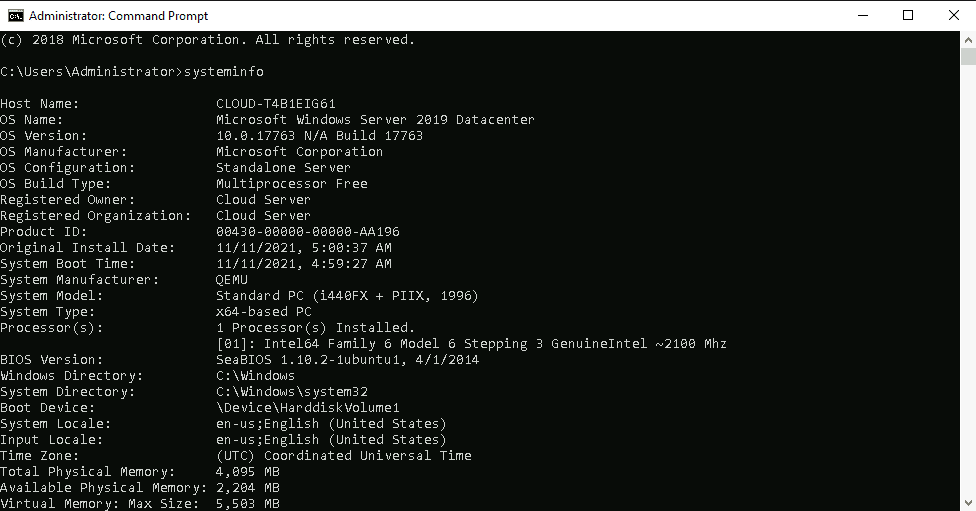
The systeminfo is another command-line utility that displays the last boot time or uptime of your windows system.
Open the command-line interface and run the systeminfo command as shown below:
systeminfo
You will get the following screen:
Check Windows Uptime with Uptime.exe
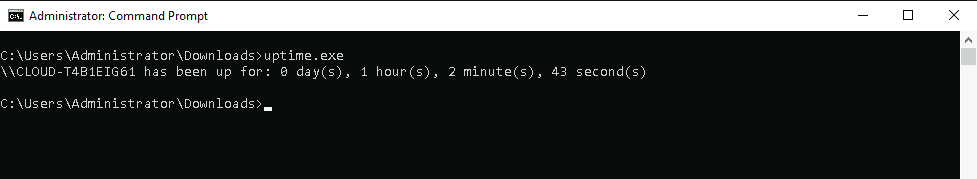
Uptime.exe is another utility that retrieves and displays the uptime of your windows system. By default, this utility is not included in the Windows server 2016 or 2019. Instead, you will need to download it from the internet.
After downloading uptime.exe, place it inside the Downloads directory.
Next, open the command-line interface and run the uptime.exe as shown below:
uptime.exe
You should see your Windows system uptime on the following screen:
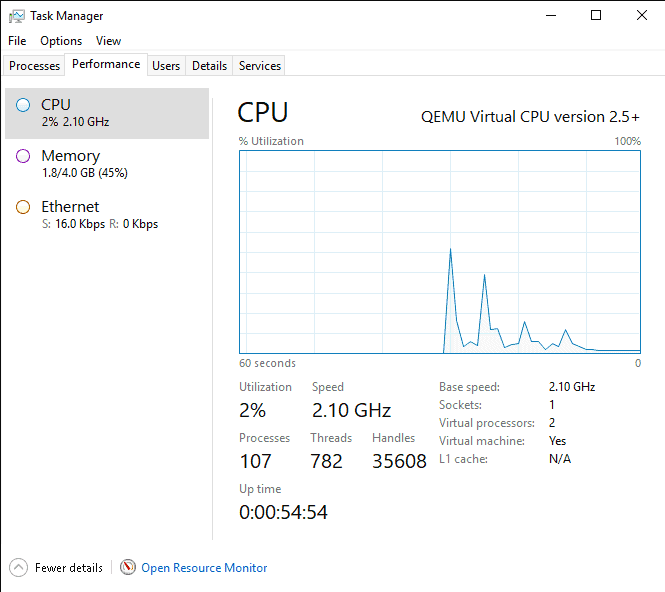
Check Windows Uptime with Task Manager
You can also check your Windows system uptime using the Task Manager.
To open a Task Manager, right-click on the taskbar and click on the Task Manager => Performance tab. You should see the system uptime inside the CPU windows:
Check Uptime in Windows Server 2012
There are several ways to check uptime in Windows server 2012
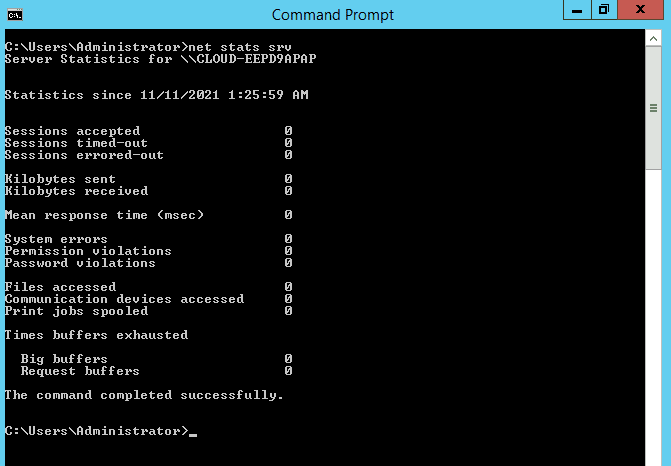
Check Windows Uptime with Net Stats Srv
In Windows Server 2012, you can use the net stats srv command-line tool to display the system uptime.
Open the command-line interface and run the following command:
net stats srv
You should see the system uptime on the following screen:
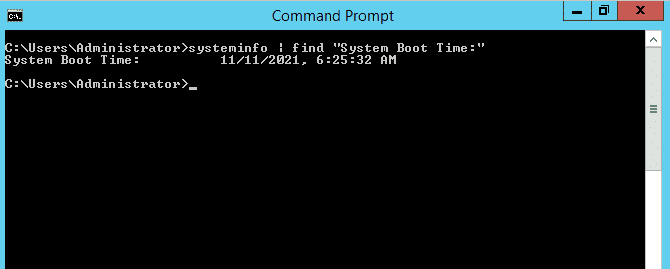
Check Windows Uptime with Systeminfo
The systeminfo command is also used to retrieve the system information, including system boot time.
Open the command-line interface and run the following command:
systeminfo | find "System Boot Time:"
You should see the system uptime on the following screen:
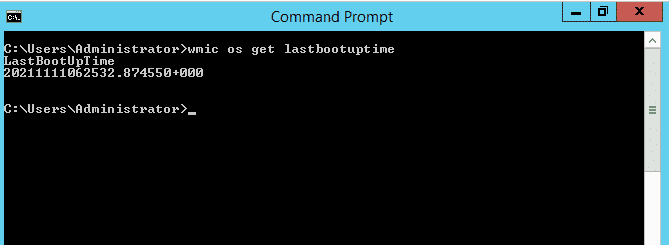
Check Windows Uptime with WMIC
WMIC provides a command-line interface to display the last boot time of the server.
You can run it using the argument os get lastbootuptime as shown below.
wmic os get lastbootuptime
This will return the last boot time of the server as shown below:
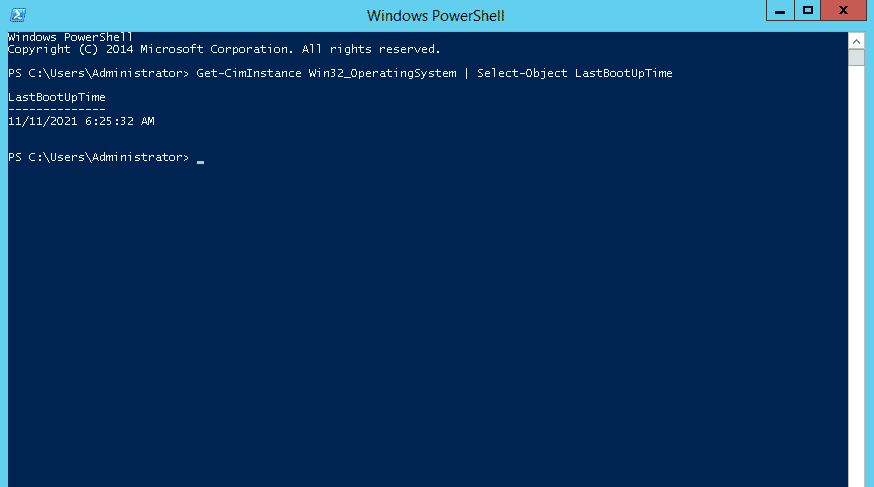
Check Windows Uptime with PowerShell
You can use PowerShell and querying WMI to retrieve the system uptime.
Open the PowerShell window and run the following command:
Get-CimInstance Win32_OperatingSystem | Select-Object LastBootUpTime
You should get the last boot time of the server as shown below:
The best Windows Server Uptime monitoring tools
Our methodology for selecting Windows server uptime monitoring tools and software
We reviewed the various Windows server uptime monitoring tools analyzed the options based on the following criteria:
- Amount of integrations offered
- Ease of use
- Amount of resources the tool uses in the background
- The techniques used to monitoring uptime and its level of accuracy
- Graphical interpretation of data, such as charts and graphs
- A free trial period, a demo, or a money-back guarantee for no-risk assessment
- A good price that reflects value for money when compared to the functions offered
Here are some of the top windows uptime monitoring software and tools currently in practice by experts.
1. SolarWinds Network Performance Monitor – FREE TRIAL
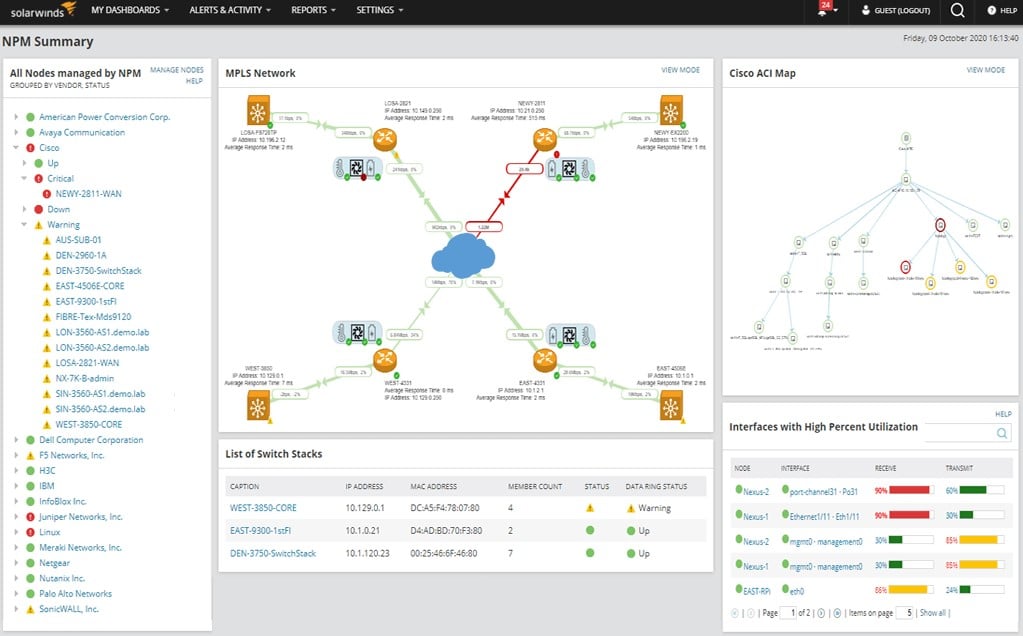
SolarWinds Network Performance Monitor helps detect, diagnose, and resolve network performance issues and outages faster. Thus, making it a prompt choice for uptime monitoring tools on network devices. SolarWinds Network Performance Monitor is an excellent tool for large and enterprise networks with the best alerting and autodiscovery features. It uses SNMP polling to verify network status and monitor the device and connections. Further, the tool is best if you are willing to reduce downtime, improve operational efficiency and troubleshoot for on-premises, hybrid, and cloud services.
Key Features:
- Practices critical path hop-by-hop analysis to feeze troubleshooting network.
- It provides comprehensive performance analysis and insights.
- It helps monitor and display response time and network device performance.
- Timely provide alerts and reports for better operational efficiency.
Why do we recommend it?
We recommend NPM network monitoring software because it gives a clear picture of your Cisco ASA system's health and performance. It helps monitor VPN tunnels for smooth site-to-site connectivity. Visualizing data through auto-generated maps makes it easier to understand and solve problems, enhancing overall network management.
Dashboards do not restrict you to only managing networks in SolarWinds Network Performance Monitor. Analyze your performance and traffic, view a network topology map, cross-stack network data correlation, get more insight into the health and performance, find the configuration details of your device and applications, and more with SolarWinds Network Performance Monitor. The autodiscovery feature in this tool helps keep you up-to-date on the status information. Further, it has a scalable pricing structure.
Who is it recommended for?
NPM network performance monitoring is recommended for anyone experiencing network issues or slowdowns. It helps identify and isolate issues causing service disruptions swiftly. It is ideal for monitoring the health and performance of all elements in application delivery, ensuring a seamless user experience.
Pros:
- Takes a holistic approach to server performance and health monitoring
- Supports auto-discovery that builds network topology maps and inventory lists in real-time based on devices that enter the network
- Supports both SNMP monitoring as well as packet analysis, giving you more control over monitoring than similar tools
- Uses drag and drop widgets to customize the look and feel of the dashboard
- Robust reporting system with pre-configured compliance templates
Cons:
- Designed for IT professionals, not the best option for non-technical users
You can register for a free quote and start of by downloading a 30-day free trial.
EDITOR'S CHOICE
SolarWinds Network Performance Monitor (NPM) stands out as the top choice in network diagnostics due to many reasons. It offers continuous monitoring of device performance and availability to have proactive troubleshooting. This tool helps detect and solve server issues instantly with its intelligent network alerting feature. You will get an instant prompt to notify users when crucial performance metrics surpass critical thresholds. Overall, SolarWinds NPM has been proven to be a reliable tool for maintaining optimal network performance and addressing challenges efficiently.
Download: Get a 30-Day Free Trial
OS: Windows
2. Site24x7 Website Monitoring – FREE TRIAL
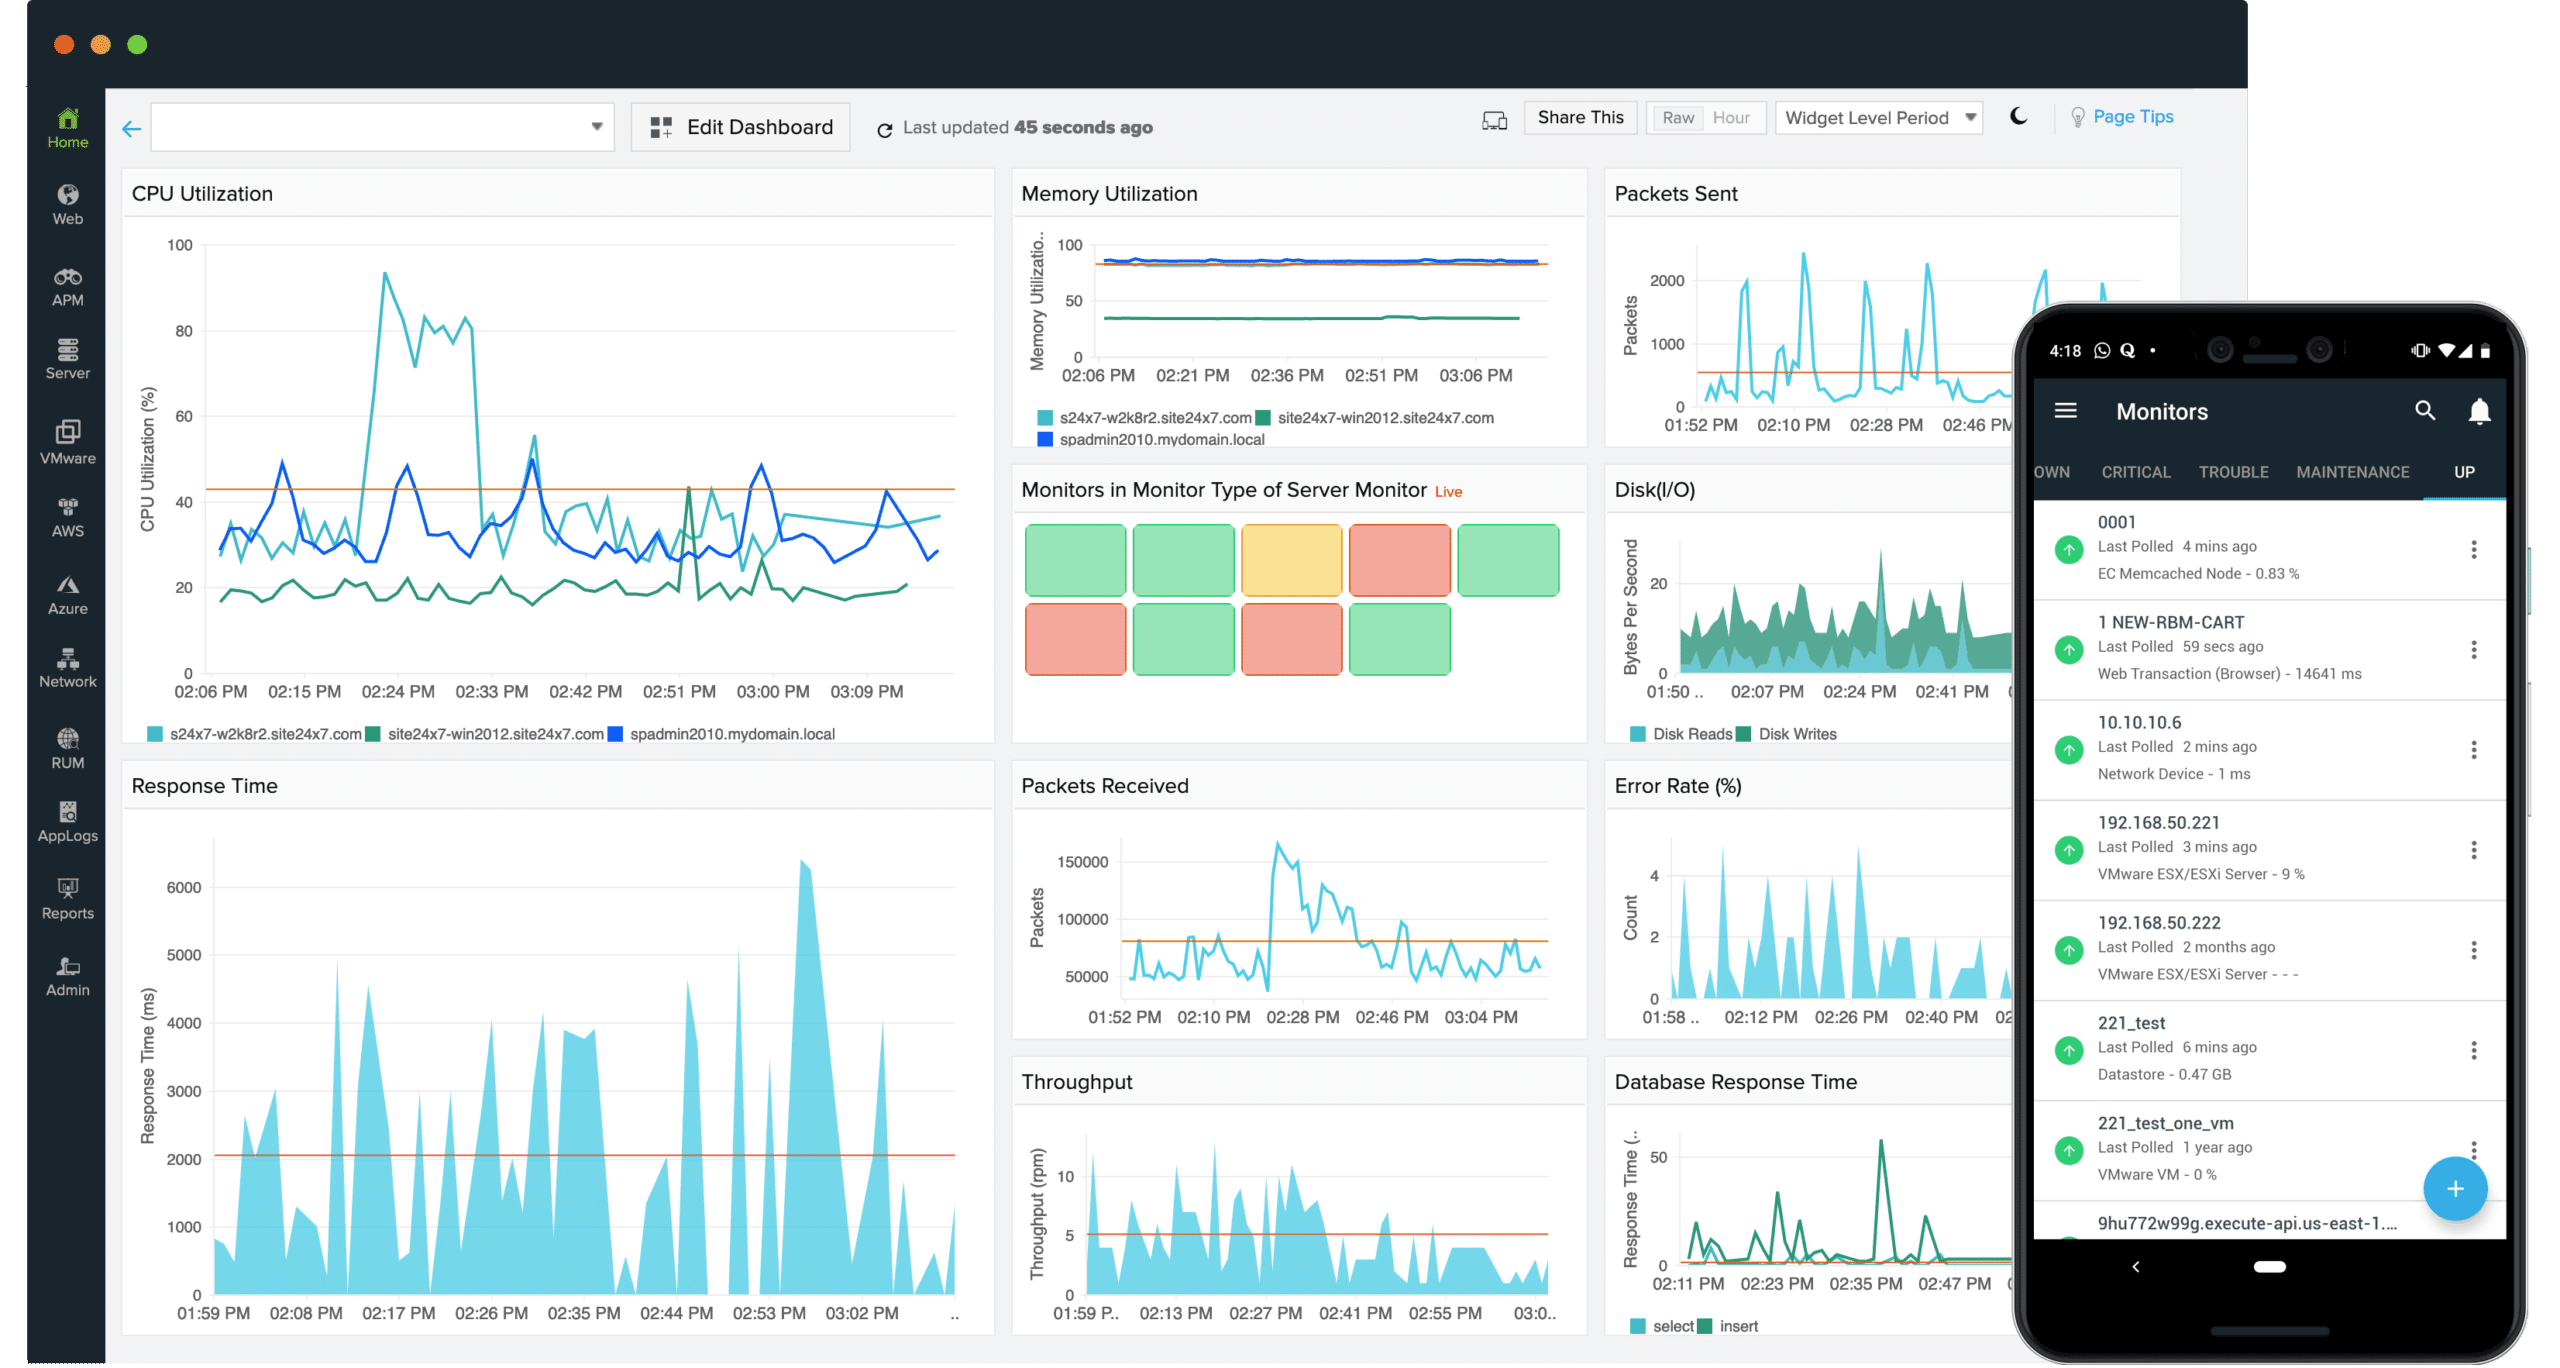
Site24x7 Website Monitoring is an All-in-One Monitoring Solution for DevOps and IT Operations. With this Uptime Monitoring Software, you can monitor a website, a server, a cloud, a network device, an application, or any real user with Site24x7. The tool is highly beneficial for DevOps as it helps reduce downtime and promptly notify customers on detecting an issue. Also, the software is available in both free versions (limited functions) and paid versions. For example, in the free edition, you can keep track of only five servers.
Key Features:
- Site24x7 supports network and server monitoring.
- It helps detect and diagnose application servers and app components responsible for creating errors.
- In addition, it helps troubleshoot cloud app performance and virtualization platforms.
- Uses application logs to collect, consolidate, index, locate, and troubleshoot bugs.
However, the paid version comprises many features, including device status examination, tracking traffic volumes, and creating a network topology map.
Why do we recommend it?
Site 24×7 is a top server monitoring tool for getting detailed insights into application, mail, web, virtual, and database servers. It offers over 80 performance metrics and a complete inventory report to prevent outages and performance issues. If you want to ensure optimal server performance, you can start monitoring 5 servers at just $9 per month.
Who is it recommended for?
This server performance monitoring tool is recommended for IT professionals and system administrators. It's used by experts to monitor server health, track key metrics like CPU usage and memory, forecast disk usage, and analyze network traffic. Overall, it is the perfect choice for ensuring optimal server performance and planning for resource utilization.
Pros:
- Offers a specific package for real user monitoring
- Offers a host of out-of-box monitoring options for infrastructure, servers, and applications
- Allows administrators to view dependencies within the application stack, good for building SLAs and optimizing uptime
- Offers root cause analysis enhanced by AI to fix technical issues faster
Cons:
- Site24x7 is a feature-rich platform with options that extended beyond databases management, may require time to learn all options and features
Website Monitoring starts at around $10/month on the Starter package. They also have PRO, Classic & Enterprise Packages with different pricing to suit your needs. You can start a 30-day free trial.
3. ManageEngine OpManager – FREE TRIAL
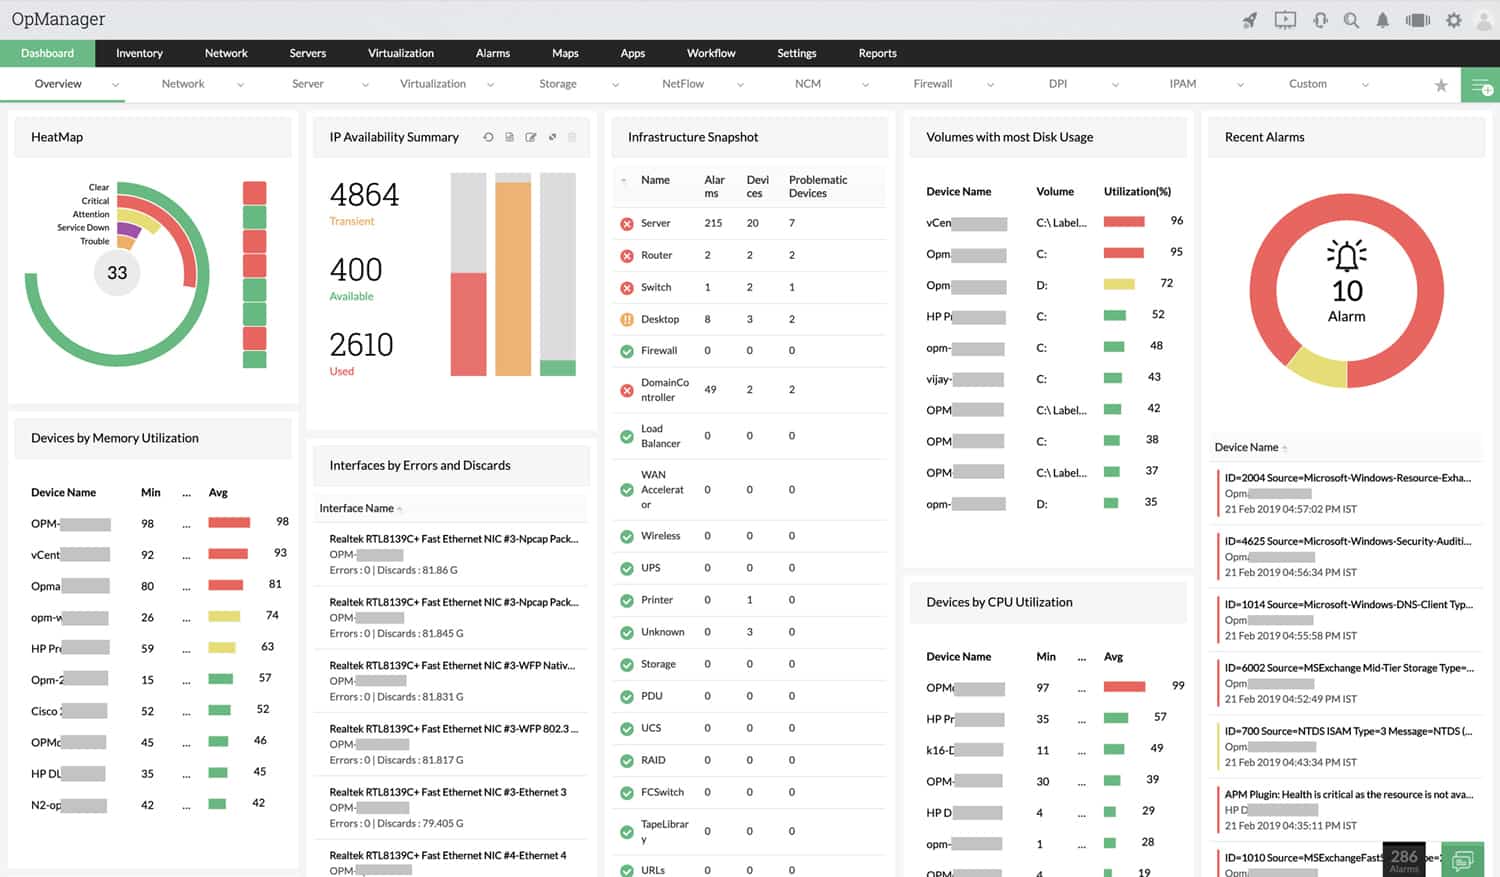
ManageEngine OpManager tracks the network devices and servers via the Simple Network Management Protocol (SNMP). In addition, it comprises autodiscovery and alert features. Also, the tool locates network devices and attached equipment through the Ping management and SNMP routines to further create a device inventory.
Key Features:
- ManageEngine OpManager provides critical insights on router performance.
- Frequently monitors WAN link availability.
- The tool supports VoIP Monitoring and Network Mapping.
- Tracks system resources and collect performance data via SNMP, WMI, or CLI protocols.
- It helps monitor tape libraries and detect fault conditions.
Why do we recommend it?
We recommend ManageEngine OpManager for its reliable uptime monitoring. With a ping every two minutes, OpManager quickly identifies unavailable devices, providing IT admins with a dependable way to ensure device availability globally. It is one of the trusted tools to monitor networks that uses ICMP ping for efficient device polling.
Who is it recommended for?
This tool is recommended for system administrators and IT experts because it helps with proactive server health tracking. It communicates with servers using protocols like WMI and SNMP to fix the faults quickly and restore server uptime. It also provides comprehensive reports that offer insights into server performance and fault nature, aiding in efficient system management.
Pros:
- Offers on-premise and cloud deployment options, giving companies more choices for install
- Can highlight interdependencies between applications to map out how performance issues can impact businesses operations
- Offers log monitoring to track metrics like memory usage, disk IO, and cache status, providing a holistic view into your database health
- Can automatically detect databases, server hardware, and devices for real-time asset management
Cons:
- Can take time to fully explore all features and options available
Check out the detailed pricing page to see what features you get with each package. Start with a 30-day free trial download.
4. UptimeRobot
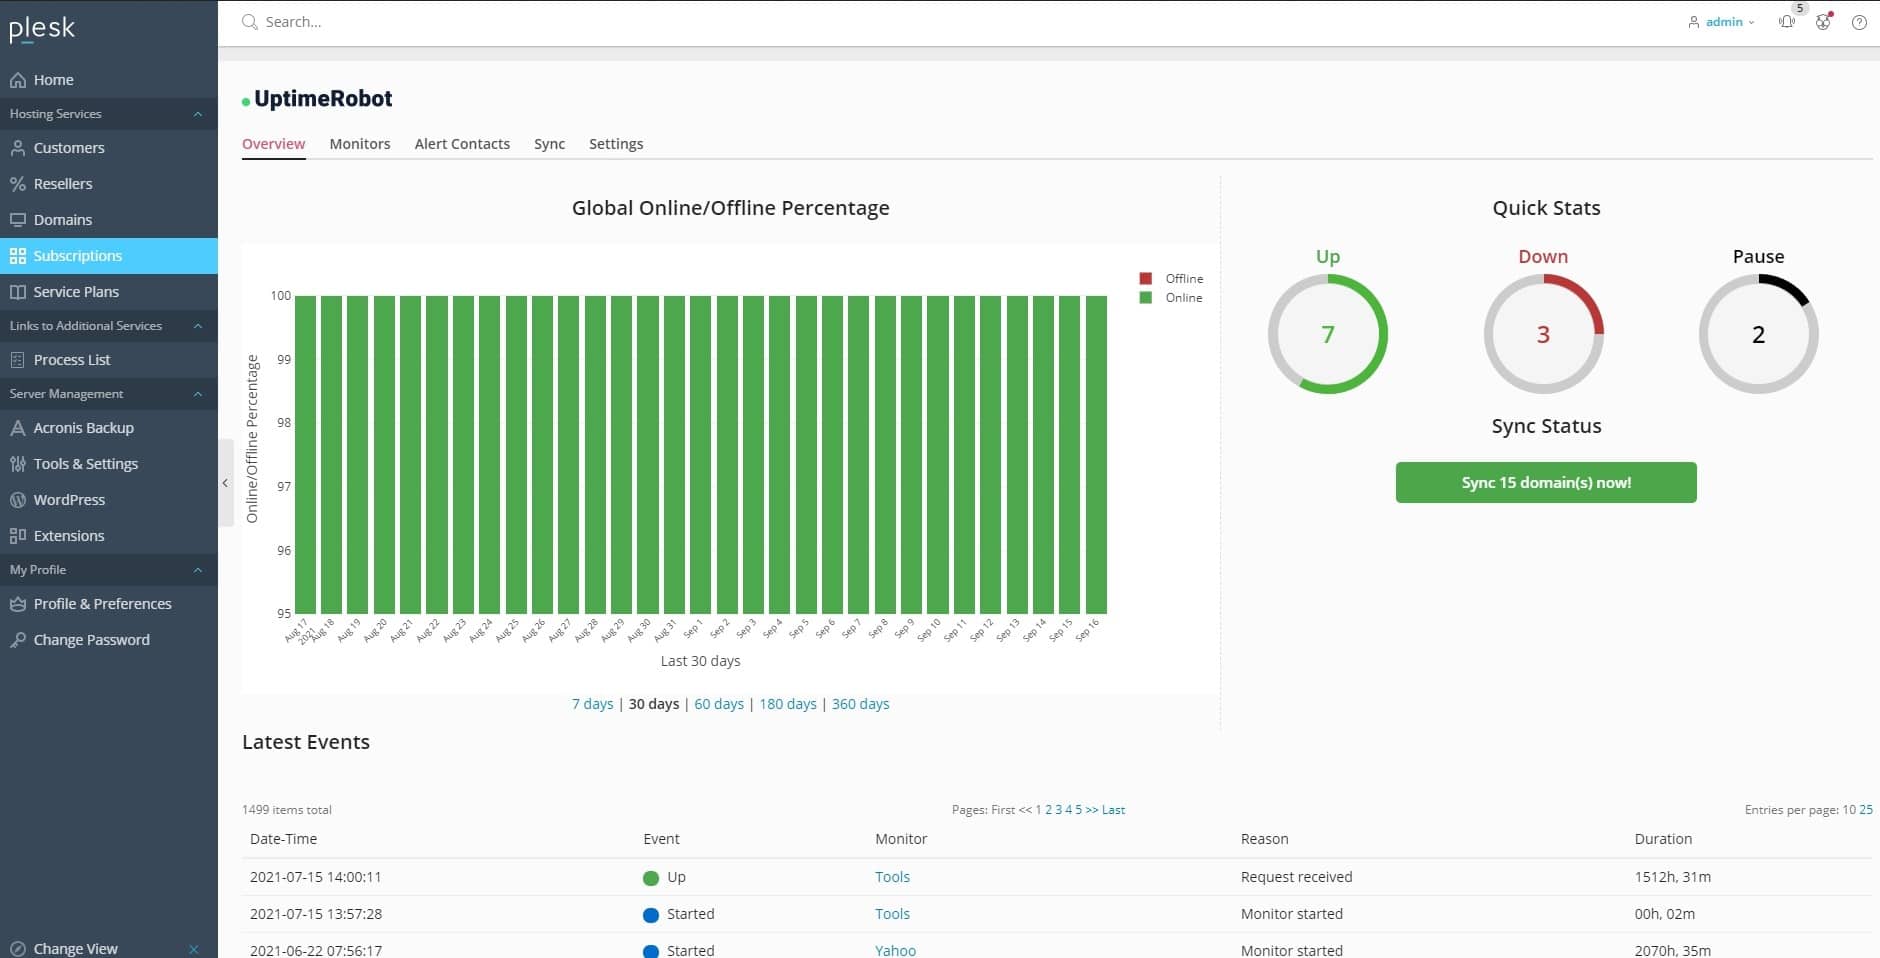
Another tool to monitor if a website is down or bug present in coding. The leading network uptime monitoring software helps schedule automatic device scans from multiple locations to monitor suspicious activities. It uses ping and port management to support uptime monitoring. It also comprises an alert system that notifies after double-checking if it is genuinely down or finds a troublesome status code. Also, the alert system can send notifications via email, SMS, voice call, and even Twitter or Slack for the expiring SSL prior 7, 14, or 30 days.
Key Features
- It provides faster Website monitoring and downtime detection.
- Timely updates or notifies about the expiration of the SSL certificate.
- It monitors and checks for the availability of network devices.
- With the port monitoring feature, you can check the specific service running on any port.
- UptimeRobot helps keep you updated on the response time and performance.
- It helps keep the customers updated about the planned outages.
Why do we recommend it?
UptimeRobot is the leading uptime monitoring service for its excellence. You can enjoy 50 monitors with free 5-minute checks. The port monitor ensures DNS connection health and also provides instant alerts via email, SMS, voice calls, or various integrations like Slack and Zapier, ensuring you stay informed about your system's status at all times.
The tool is free for only up to 50 monitors with two months of logs. There are three different packages for uptime monitoring software, including the free plan, the Pro package, and the enterprise plan.
Who is it recommended for?
It is recommended for IT professionals and system administrators. Network managers widely use it to set up maintenance windows for monitoring pauses during maintenance efficiently. By analyzing incidents closely, the tool helps reduce the risk of recurrence. It supports multi-location checks to verify incidents from different geo-locations, and prevent false positives.
Pros:
- Offers a free and paid version – great for smaller organizations and in depth testing
- Paid packages include performance monitoring – great for websites or company resources
- Offers historical data collection and reporting
- Can check 50 different metrics every 5-minute cycle
Cons:
- Better suited for website monitoring and smaller organizations
There is a Free Plan and a PRO plan that starts at $15/month. They also have an Enterprise plan where you will need to contact them for a detailed quote.
Conclusion
In the above guide, we explained how to check system uptime in Windows Server 2012, 2016, and 2019. We also suggest some of the best tools to check Windows uptime. I hope this guide helps you to check your Windows system uptime.
Windows Server Uptime Monitoring Tools FAQs
What are the key components of Windows Server uptime monitoring?
The key components of Windows Server uptime monitoring include:
- Server availability monitoring: Monitoring the availability of the server to ensure that it is up and running and providing the required services.
- Resource utilization monitoring: Monitoring the utilization of key resources, such as CPU, memory, and disk I/O, to identify performance bottlenecks.
- Event log monitoring: Monitoring the Windows event logs to identify warning and error messages that could indicate potential issues.
- Application monitoring: Monitoring the availability and performance of applications running on the server to ensure that they are functioning correctly.
How often should I perform Windows Server uptime monitoring?
The frequency of Windows Server uptime monitoring depends on the specific requirements of your environment and the size and complexity of the servers being monitored. In general, it is recommended to perform regular monitoring on an ongoing basis to ensure that servers are running optimally and to identify and resolve issues as they arise.
What should I do if I encounter a performance or availability issue with a Windows Server?
If you encounter a performance or availability issue with a Windows Server, the first step is to gather information about the issue and the environment, including resource utilization and event logs. You can then use this information to identify the root cause of the issue and take appropriate action, such as applying software updates, reconfiguring the server, or replacing hardware components. If the issue cannot be resolved, you may need to seek additional support from Microsoft or a third-party vendor.

