
Our funding comes from our readers, and we may earn a commission if you make a purchase through the links on our website.
The Best Riak Database Monitoring Tools
UPDATED: January 9, 2024
The success of non-relational databases is not surprising, and over the years, they have gained solid ground in the enterprise world. Riak is an open-source, web-scalable database based on NoSQL and Dynamo database systems. Basho Technologies developed it. The software has been designed for fault tolerance, high availability, and great scalability.
Riak is an extensively distributed database software that provides reliable and scalable performance in various operational environments. Riak is available in free as well as commercial versions. In addition, the software is available for several platforms, including enterprise, web, cloud, and mobile platforms.
Explaining Riak
Riak is distributed across many nodes and is deployed without a master instance, hence, Riak is considered a fault-tolerant database. It does not have a single point of failure. Ideally designed for distributed cloud data infrastructures, Riak provides superior performance in high-volume read-and-write applications and can build cloud file systems.
The standard version of Riak is integrated with features like multi-node clustering and MapReduce. In contrast, the enterprise version is enabled with Simple Network Management Protocol (SNMP) monitoring tools, management tools, implementation, consulting services for architecture, and 24-hour technical support, along with the features provided in the standard version.
Riak has been architected for multiple advantages:
- Availability Riak replicates and retrieves data intelligently, so it is available for reading and writing operations, even in failure conditions.
- Fault tolerance You can lose access to many nodes due to network partition or hardware failure without losing data.
- Operational simplicity You can easily add new machines to your Riak cluster without incurring a larger operational burden; the same ops tasks apply to small clusters as large clusters.
- Scalability Riak automatically distributes data around the cluster and yields a near-linear performance increase as you add capacity.
Riak uses a simple key-value model for object storage. Objects in a Riak are stored in a flat namespace called a bucket, and it consists of a unique key and a value. Thus, you can virtually keep any content you want in a Riak – images, text, XML, JSON, and HTML documents; user and session data; log files; backups; and more.
Riak provides a straightforward, RESTful API as well as a protocol buffer interface. Riak has several client libraries, including Python, Java, Perl, Ruby, Erlang, PHP, .NET, and more.
Riak Variants
Riak comes in two variants: Riak KV and Riak TS. Both variants share the same Riak Core but have different use cases.
Riak KV is a scalable, highly available, and easy-to-operate distributed NoSQL database. One of the most important things is that it automatically distributes data across the cluster for fast performance and fault tolerance. What's more, Riak KV deals with Key-Value cases.
Riak TS optimizes IoT data and time series, and it also provides faster reads and writes that help makes it easier to query, analyze, and store time and location data. As a result, Riak TS forms the foundation for reducing the complexity of integrating and implementing active workloads for Big-Data, IoT, and hybrid cloud applications with the most flexible and available NoSQL database.
The Riak principle is based on Amazon's Dynamo Paper with heavy influence from the CAP Theorem. The database is written in Erlang and has fault-tolerant data replication and automatic distribution across the cluster for resilience and performance.
Essential yet straightforward Use Cases Of Riak
- For Ads Riak has repeatedly proven that it is one of the best choices for many use cases and serving advertising content is significant. Being such a popular database, Riak does content to different web and mobile users with low latency.
- For Sessions Storage Riak was initially created to serve as a scalable session store. However, the database evolved over the years and started doing as complex session storage as well. What was the reason for this evolution? Riak includes advanced features such as MapReduce, Bitcask, and others. User and session IDs are usually stored in cookies so that Riak can serve these requests with low latency. It is thus one of the most critical use cases for Riak.
- For Sensor Data Sensor data is nothing but the output of a device that detects and responds to some type of input from the physical environment. Many devices collect and send data at a given interval, and sometimes it becomes difficult to handle that data. Riak helps you in such scenarios. It is considered one of the better options for storing sensor data.
- For Log Data Log data means the information about events that occur in an OS or other software or messages between different users of communication software. One of the ordinary yet essential use cases of Riak is storing large amounts of log data, and Riak can do the same with the help of MapReduce.
- For User Account Data Every company needs to handle user account data. It is very critical for any business. Hence, companies need a simple yet effective way to store that data. In this case, Riak can be a good storage option. Each account data in Riak could be stored as a JSON object in a bucket. What's more, object keys for the data can also be used, and to retrieve data; you can use a user ID.
Riak Database Monitoring Tools
There are many self-hosted, open-source, and service-based solutions for aggregating and analyzing statistics and log data to alert, monitoring, and trend analysis on a Riak cluster. In addition, some solutions provide Riak-specific modules or plugins.
Many of the tools mentioned below were either created by third parties or Riak engineers for general usage and passed to the community for further updates. As such, many of the below only aggregate the statistics and messages output by Riak 1.4x.
Like all code under Riak labs, the below tools are “best effort tools” and have no dedicated Riak support. However, the following are solutions that community members and customers have reported success with when used to monitor their Riak clusters' operational status.
Open source and community tools are presented along with commercial and hosted services.
Hosted Service Monitoring Tools
The following are some commercial tools for Riak database monitoring that Riak customers have reported successfully using statistics gathering and monitoring within their Riak clusters:
Site24x7 – FREE TRIAL
Site24x7 excels as a versatile tool for monitoring Riak databases. It combines comprehensive monitoring capabilities with real-time insights into Riak's performance and health. Customizable alerts and detailed reports ensure optimal operation and quick resolution of issues. Its adaptability extends beyond Riak to other NoSQL databases, positioning it as a robust solution for diverse systems and applications.
Key Features
- Real-time monitoring of Riak database performance
- Customizable alerts based on database metrics
- Detailed reports and analytics on database health
- Easy integration with Riak and other NoSQL databases
- Monitoring of cluster health and node performance
Why do we recommend it?
Site24x7 is recommended for Riak database monitoring due to its comprehensive feature set that provides real-time insights and detailed analytics. This is crucial for maintaining the high availability and performance of Riak databases, especially in distributed environments.
Who is it recommended for?
This tool is ideal for database administrators and IT professionals who manage Riak databases, particularly in environments where the high availability and performance of these databases are critical.
Pros:
- Effective real-time monitoring of Riak databases
- Customizable alerts for proactive database management
- Detailed reporting and analytics features
Cons:
- Users may require some time to familiarize themselves with its features, especially if they are new to monitoring distributed NoSQL databases
Circonus
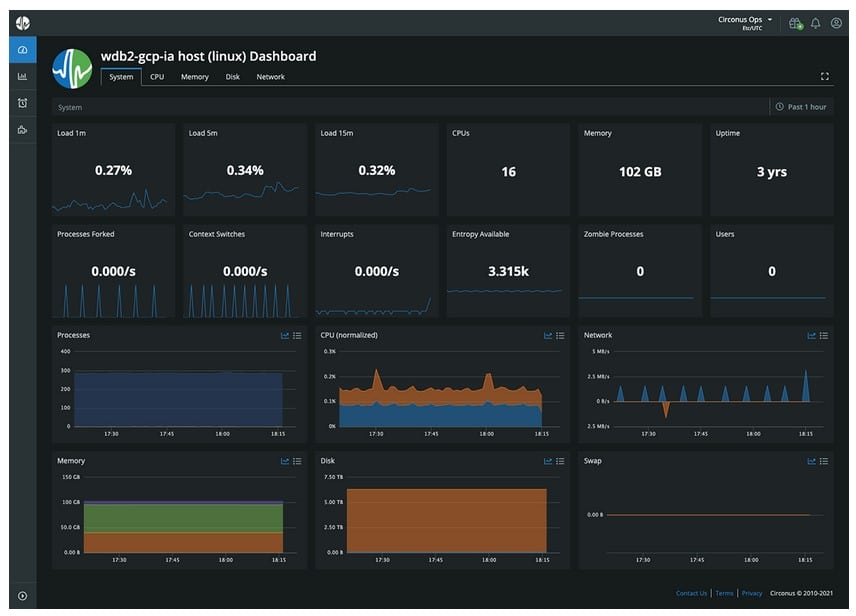
Circonus provides organization-wide monitoring, trend analysis, alerting, notifications, and dashboards. You can also use the tool to provide trend analysis and help with troubleshooting and capacity planning in a Riak cluster environment.
The tool eliminates preventable outages and downtime. Circonus also accelerates problem resolution time, deploys software faster with less risk, and consolidates monitoring solutions.
Circonus gains complete visibility into your infrastructure across on-premises, cloud, and hybrid environments. Contextual tagging, advanced analytics, and real-time intelligence help you prevent issues and reduce MTTR. Circonus also leverages dashboards, granular metrics, and data with context to quickly identify and resolve bandwidth issues and bottlenecks.
Pros:
- Excellent user interface – highly customizable and visually appealing
- Provides organizational database monitoring from a single-page
- Can monitor across different cloud, on-prem, and hybrid platforms
Cons:
- Best for larger organizations
Website Link: https://www.circonus.com/
New Relic
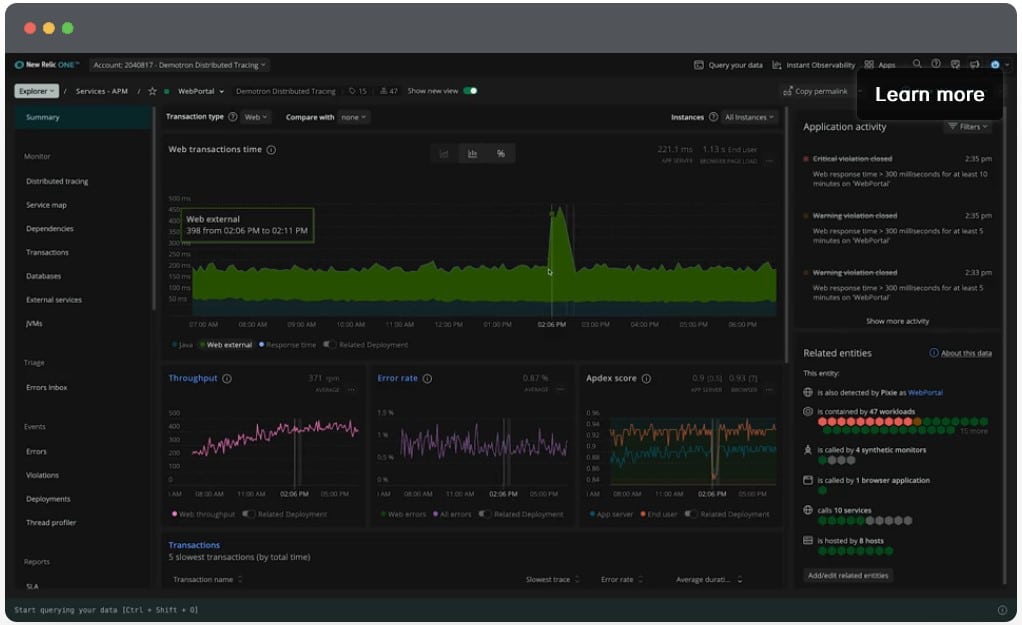
New Relic is a data analytics and visualization platform that can provide information on Riak nodes' current and past states and visualize machine-generated data such as log files.
New Relic collects all your telemetry in one secure cloud with no-tool sprawl or data silos. It is one connected experience and not a maze of charts. The tool can correlate issues across your entire stack and also debug and collaborate from your IDE. In addition, the new Relic provides AI assistance at every step.
A Riak New Relic Agent for collecting statistics from the Riak HTTP/stats endpoint is also available.
Pros:
- Can monitor data with AI assistance – eliminating false positives
- Uses anomaly detection to highlight abnormal behavior in your Azure environment
- Uses simple but intuitive admin dashboards
Cons:
- Better suited for small to medium-sized teams
Website Link: https://newrelic.com
Splunk
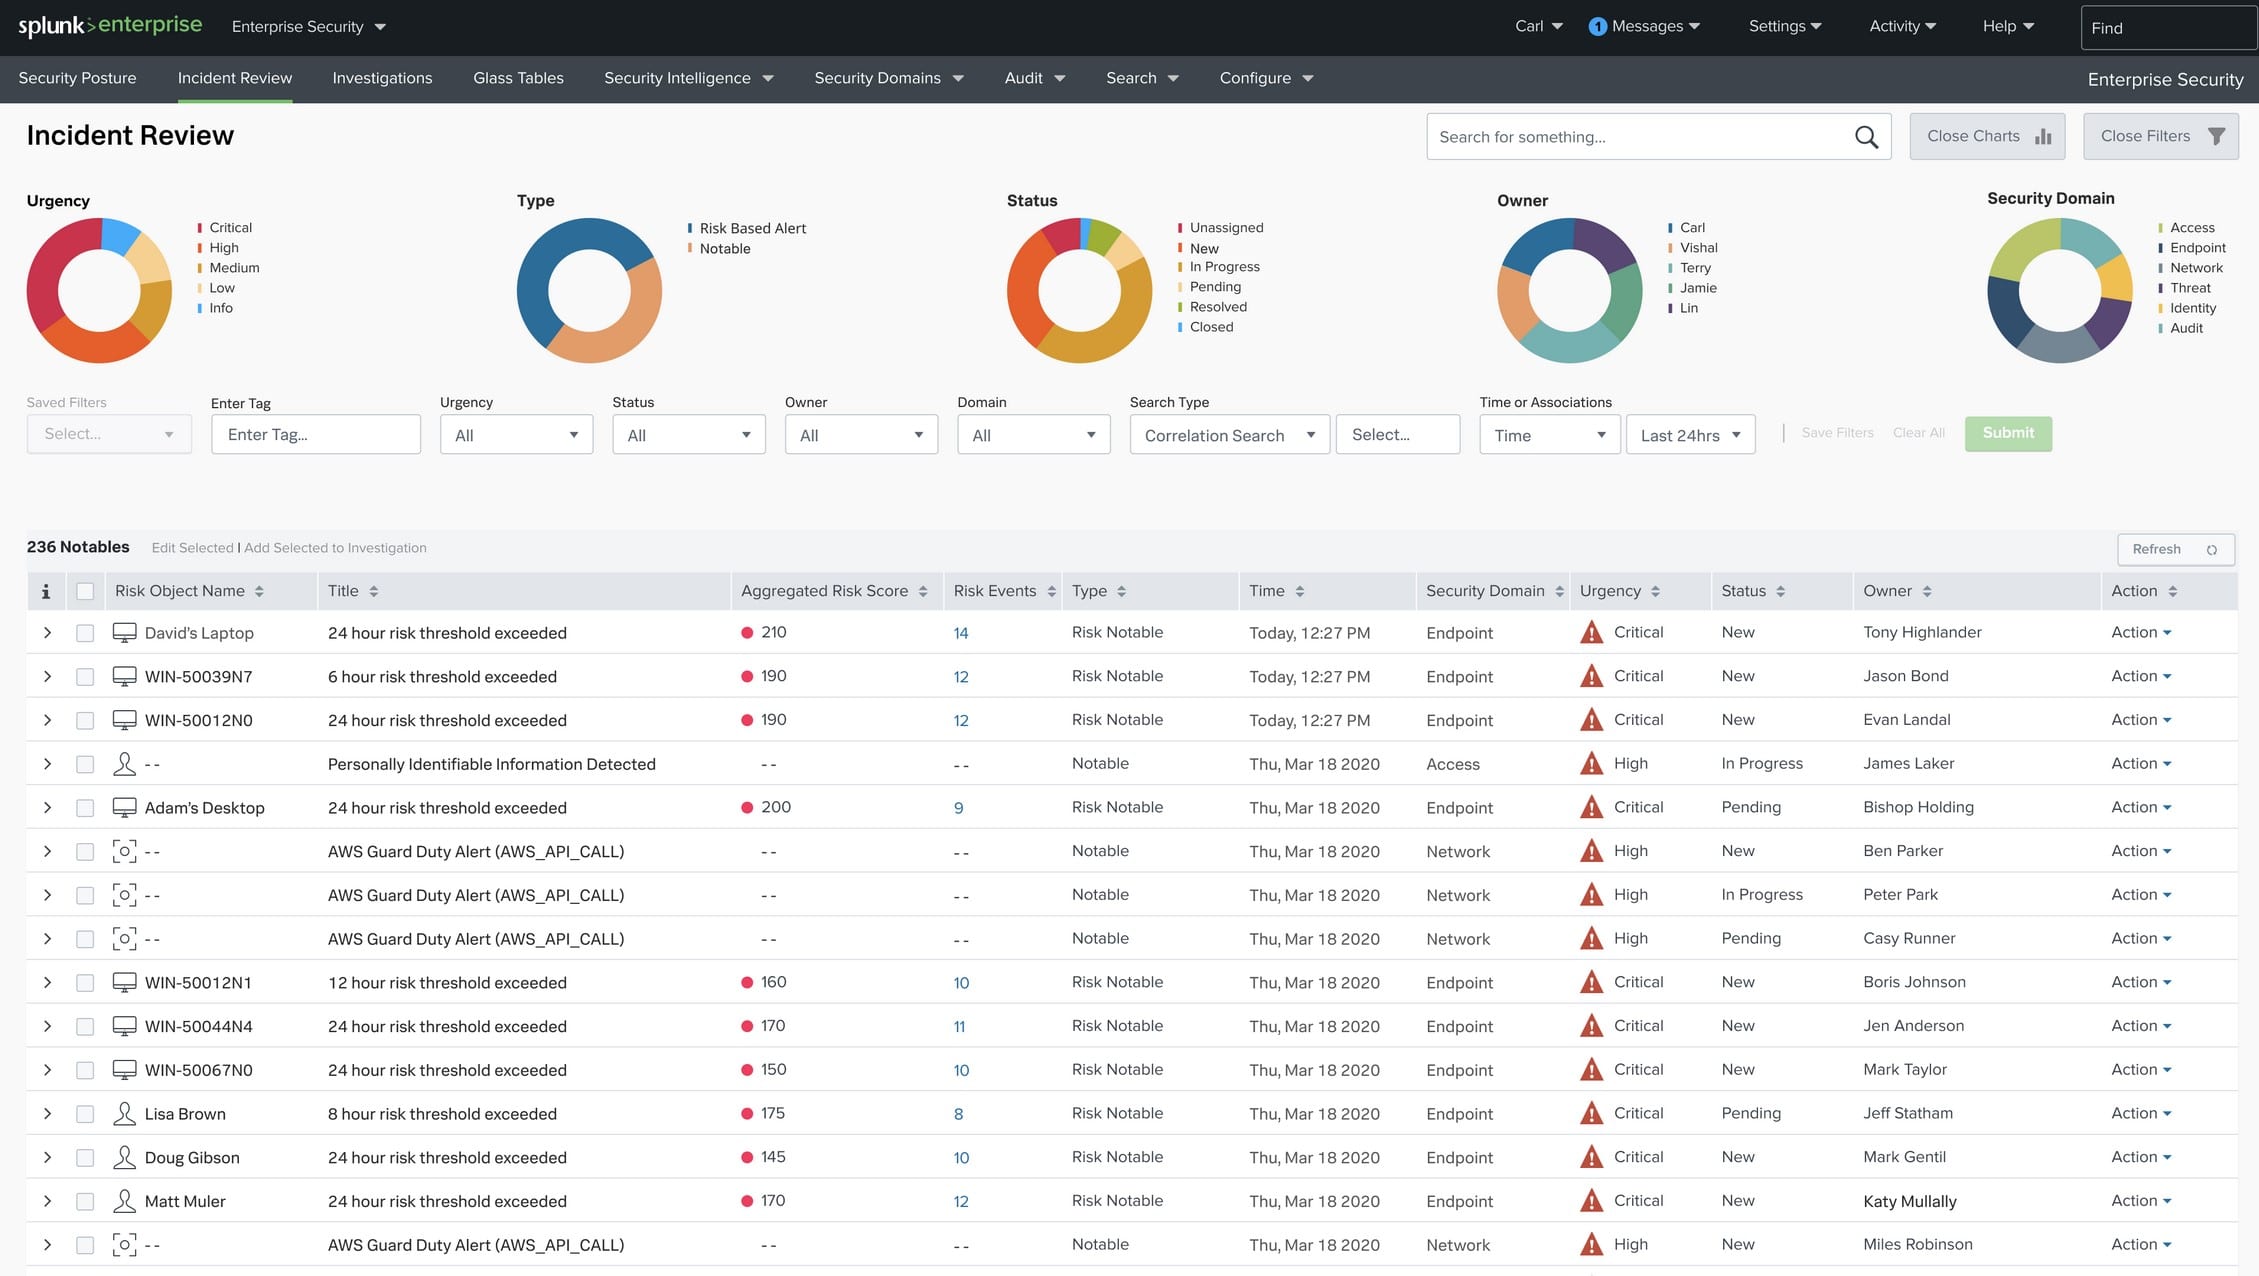
Splunk is available as downloadable software or a service and provides tools for visualization of machine-generated data such as log files. In addition, it can be connected to Riak's HTTP statistics /stats endpoint.
You can use Splunk to aggregate all Riak cluster node operational log files, including the operating system and Riak-specific logs and Riak statistics data. This data is then available for real-time graphing, search, and other visualizations ideal for troubleshooting complex issues and spotting trends.
Splunk Cybersecurity Solutions is ranked as a SIEM leader in Gartner's Magic Quadrant for the eighth time. The tool lowers data breaches and other fraud risks by 70%, and Splunk also reduces incidents and downtime by 82% with the Splunk AIOps platform. In addition, Splunk brings data to every question, decision, and action across your organization.
Pros:
- Uses excellent visuals to display collected data and insights
- Supports a multitude of environments for data collection
- Uses machine learning to identify new data sources and monitor behavior
- Caters to enterprises with excellent support and a wide range of integrations
Cons:
- Many features and services cater to large enterprise networks
Website Link: https://www.splunk.com/
Self-hosted monitoring tools for Riak
Riaknostic
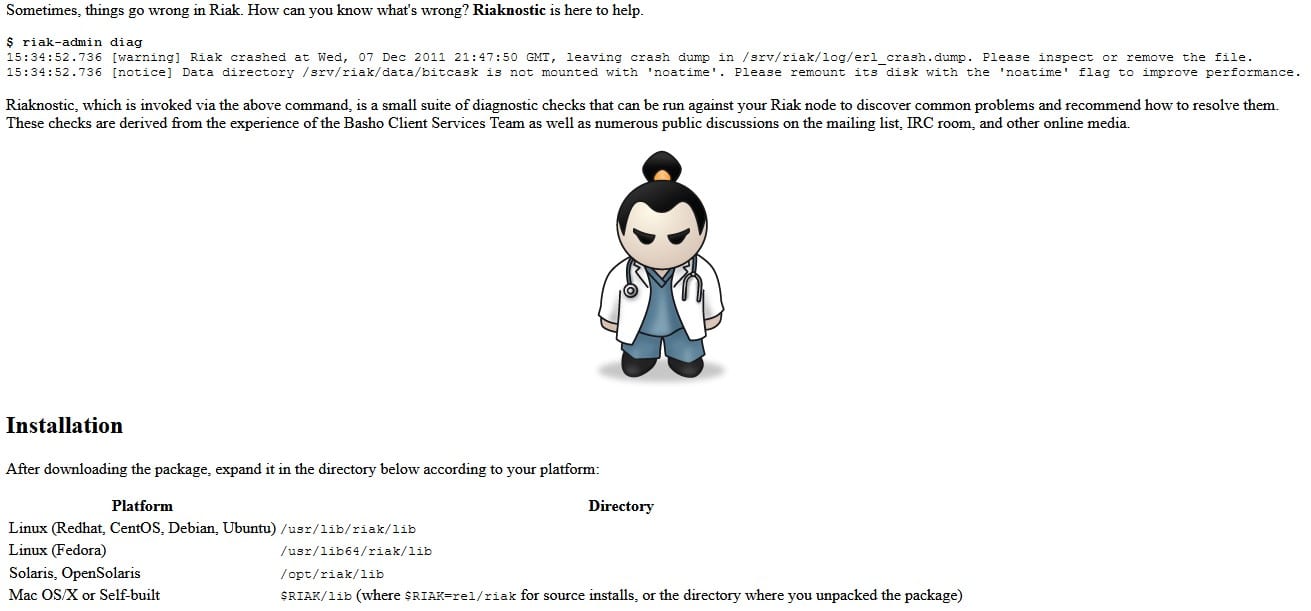
Riaknostic is a growing suite of diagnostic checks that you can run against your Riak node to discover common problems and recommend solving them. These checks are derived from the experience of the Riak Client Services Team and several public discussions in the IRC room, mailing list, and other online media.
Riaknostic integrates into the riak-admin command via a diag subcommand and is a significant initial step in the process of diagnosing and troubleshooting issues on Riak nodes.
Pros:
- Includes a suite of tools
- Based off of Riak Client Services
- Integrates into the base riak-admin command
Cons:
- Documentation could be better
Website Link: http://riaknostic.basho.com/
Riak Control
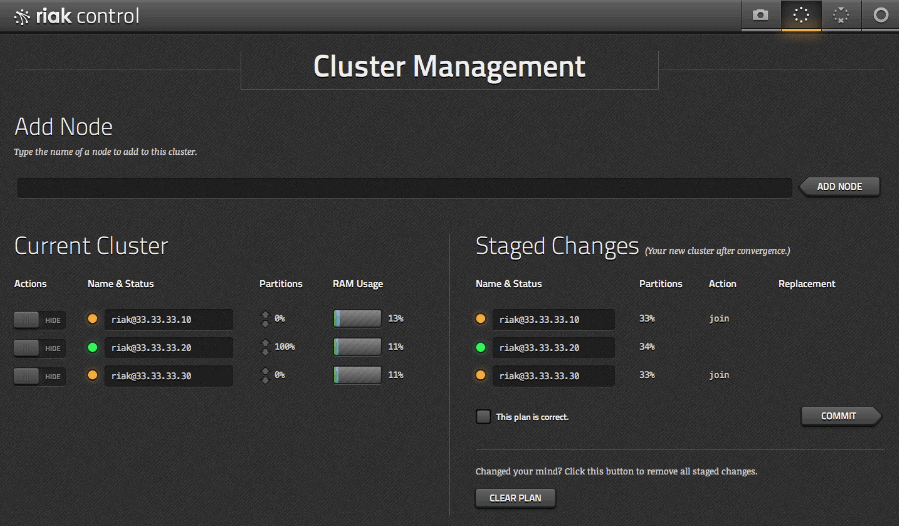
Riak Control is Riak's REST-driven user interface for managing Riak clusters. It is designed to give you a quick insight into the health of your cluster and allow for easy management of nodes. In addition, it is a web-based administrative console for inspecting and manipulating Riak clusters.
Though Riak Control is maintained as a separate application, the necessary code ships with versions of Riak 1.1 and above and requires no additional installation steps. Riak Control is disabled by default if Riak authentication is enabled. It is strongly recommended that SSL and HTTPS be configured and enabled for accessing Riak Control. Ensure to restart the node once you have enabled Riak Control for the changes to take effect.
While Riak Control does not currently offer specific monitoring and statistics aggregation or analysis functionality, it offers features that provide immediate insight into the overall cluster health, node status, and handoff operations.
Pros:
- Great interface
- Uses efficient REST API
- Monitor multiple metrics from a single pane
Cons:
- Better for larger Riak databases
Website Link: https://riak.com/riak-1-4-riak-control/
collectd
collectd gathers statistics about the system it is running on and stores them. It collects metrics from various sources like the operating system, applications, log files, and external devices and stores this information or makes it available over the network. The statistics are then graphed to find current performance bottlenecks, predict system load, and analyze trends.
Certain factors set collectd apart from similar free, open-source projects. For one, it is written in C for performance and portability, allowing it to run on systems without a scripting language or cron daemon, such as embedded systems. The tool also includes optimizations and features to handle hundreds of thousands of metrics. It also provides powerful networking features and is extensible in numerous ways.
Last but not least, collectd is actively developed, supported, and well documented. However, collectd does not generate graphs, and monitoring functionality has only been added in version 4.3 but is limited to simple threshold checking.
Pros:
- Collects metrics from the OS, application, log files, and other sources
- Completely free
- Open source transparent project
Cons:
- Lacks a large community
Ganglia
Ganglia is a monitoring system specifically designed for large, high-performance computers, such as clusters and grids. Community members and customers using Riak have reported success in using Ganglia to monitor the Riak database.
Ganglia is a BSD-licensed open source project based on a hierarchical design targeted at the federation of clusters. It leverages widely used technologies such as XML for data representation, portable data transport, XDR for compact, and RRD tool for data storage and visualization. Furthermore, it uses carefully engineered data structures and algorithms to achieve low per-node overheads and high concurrency.
The implementation of Ganglia is robust, has been ported to an extensive set of operating systems and processor architectures, and is presently in use on thousands of clusters worldwide. Ganglia has been used to link clusters across university campuses globally and can scale to handle clusters with 2000 nodes.
Pros:
- Focuses on large deployments – great for enterprise use
- Can scale to support up to 2000 nodes
- Exports data as a simple XML
Cons:
- Better suited for widescale Riak use
Website Link: http://ganglia.sourceforge.net/
Nagios
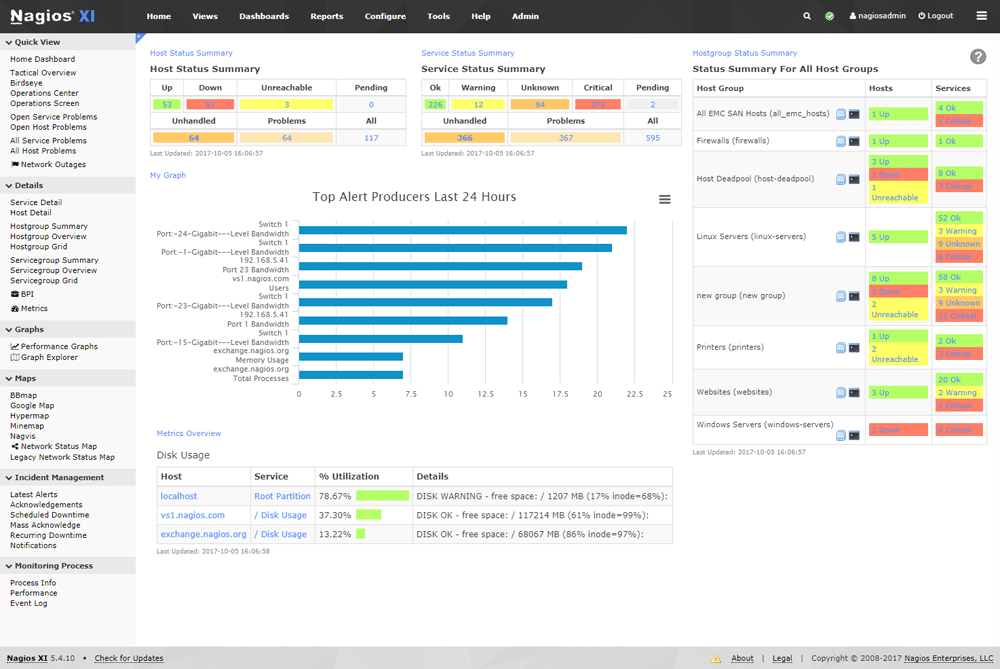
Nagios is an alerting and monitoring solution that can provide information on the status of the Riak cluster nodes and various types of alerts when particular events occur. Nagios also offers logging and reporting of events and can be used for identifying trends and capacity planning.
Nagios is known for being one of the best server monitoring tools on the market. It makes server monitoring easy because of the flexibility to monitor your servers with both agent-based and agentless monitoring. With over 5000 different add ons available to monitor your servers, the community at the Nagios Exchange has left no stone unturned.
Pros:
- Open-source transparent tool
- Simple, yet informative interface
- Flexible alerting options support SMS and email
- Robust API backend makes it a great option for developers who want to integrate their own custom applications
- Very generous two-month trial period
Cons:
- Open-source version lacks quality support found in paid products
- Installation can be technical and complex
Website Link: https://www.nagios.org/
OpenTSDB
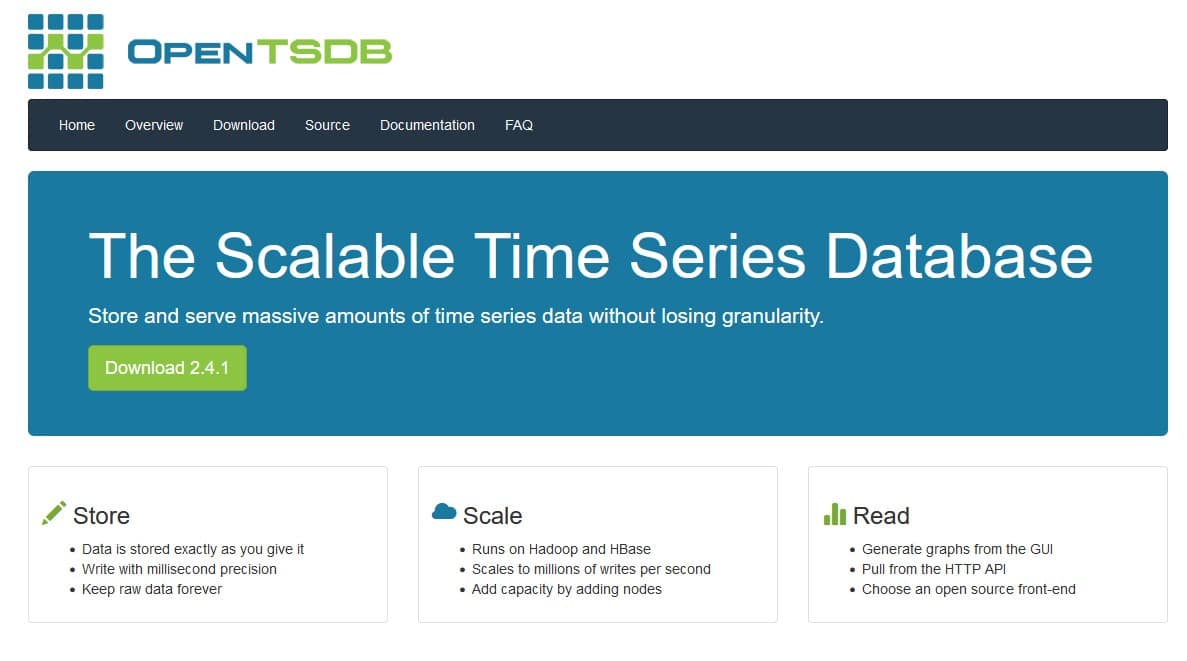
OpenTSDB is a scalable, distributed Time Series Database (TSDB) used to store, index, and serve metrics from various sources. It can collect data at a large scale and graph these metrics on the fly.
OpenTSDB stores and serves a massive amount of Time Series Data without losing granularity. Data is stored the way you give it. You can write it with millisecond precision, and you can keep raw data forever.
As for scalability, OpenTSDB runs on Hadoop and HBase and scales to millions of writes per second. The tool adds capacity by adding nodes, and you can also generate graphs from the GUI. In addition, a Riak collector for OpenTSDB is available as a part of the collector framework.
Pros:
- Can collect and store large amounts of data on the fly
- Supports native graphing
- Supports raw data review and processing
Cons:
- Graphing features could use improvement
Website Link: http://opentsdb.net/
Riemann
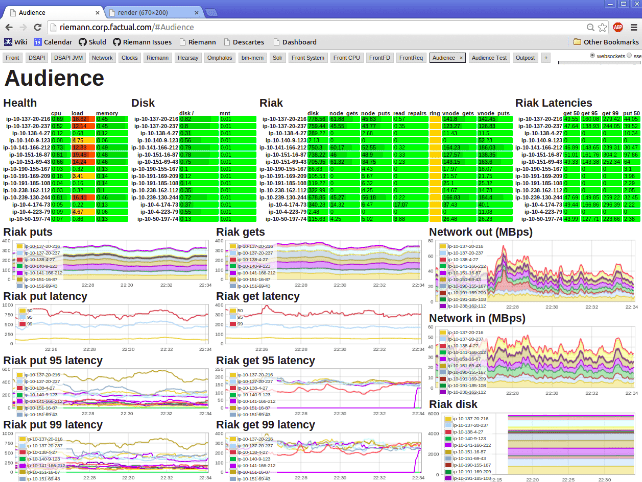
Riemann uses a powerful stream processing language to aggregate events from client agents running on Riak nodes and can help track trends or report on events as they occur. Statistics can be gathered from your nodes and forwarded to a solution such as Graphite for producing related graphs.
A Riemann Tools project consisting of small programs for sending data to Riemann provides a module specifically designed to read Riak statistics.
Pros:
- Uses stream processing language for detailed queries
- Fairly well documented and supported
- Better suited for small to medium-sized databases
Cons:
- Insights must be sent to another platform for visualization
Website Link: https://riemann.io/
Zabbix
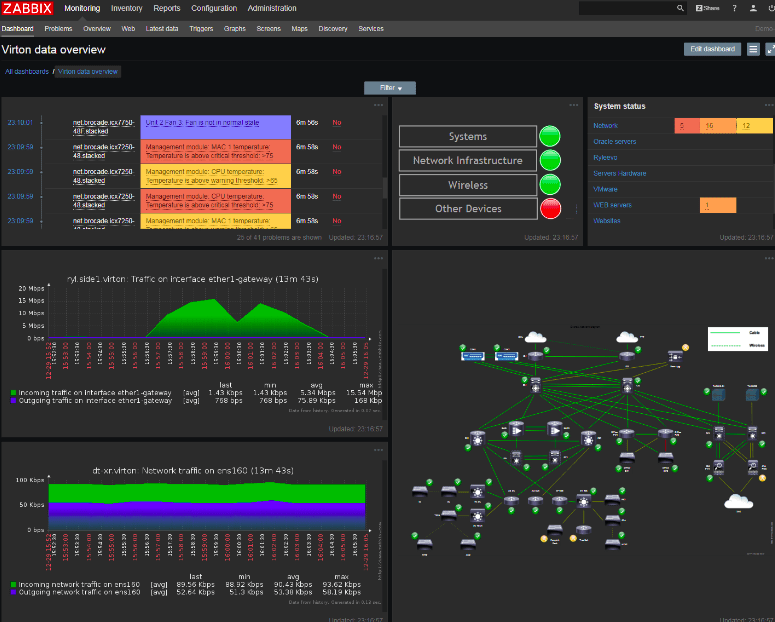
Zabbix is an open-source performance monitoring, alerting, and graphing solution that can provide information on the state of Riak cluster nodes. With the flexibility of deployment options, you are still entirely in control of your data.
Zabbix allows you to deploy and scale a distributed infrastructure from a central web UI with native encryption support between all of the components. It is very secure and safe, and Zabbix keeps your sensitive information secure by storing it in an external vault.
Backed by 250+ global partners and multiple external vendors, Zabbix delivers enterprise-level monitoring and support to customers all over the globe. In addition, it ensures 24/7 uptime and negates the risk of data loss for your Zabbix infrastructure with high availability solutions.
Pros:
- Open-source transparent tool
- Uses both SNMP and ICMP for a broader monitoring range
- Can detect new devices and configuration changes immediately
- Offers useful templates for quick insights
- Robust notification system supports SMS, email, custom script, and webhook
Cons:
- The interface isn’t as intuitive as solutions such as DataDog or Site24x7
- Would like to see better-alerting features, specifically related to reducing false positives
Website Link: https://www.zabbix.com/integrations/riak
Riak Monitoring – The Final Say
Riak database supports massive data storage and management with increased flexibility, availability, scalability, and fault tolerance compared to traditional databases. The performance of the databases defines the success of organizations in providing a 24X7 level of customer satisfaction and smooth operations of day-to-day business activities.
Riak Database Monitor helps you monitor the performance of the database and provides extensive information so that you can take the necessary steps before a breakdown of vital business processes occurs.
Data in today's world is one of the most crucial factors for any business. And as the amount of data generation increases significantly, the concern about reliable storage is also skyrocketing. While there are many databases available, Riak seems to be one of the first choices for many organizations, even though it has been a long since it was released.

