
Our funding comes from our readers, and we may earn a commission if you make a purchase through the links on our website.
The Best MRTG Alternatives for System and Network Traffic Graphing
UPDATED: January 3, 2024
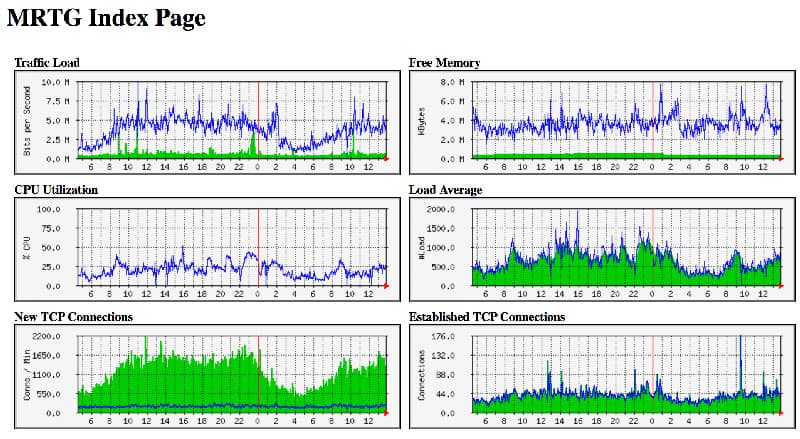
MRTG, Multi Router Traffic Grapher, is a great tool that is written in Perl that gives your details about networked devices that can be polled and monitored using SNMP.
In terms of functionality and using it to keep an eye on your traffic loads, it works well – As for other bells and whistles that many admins and engineers are looking for, it lacks quite a bit.
We want to list some MRTG Alternatives for Windows and Open-source platforms, as well as some benefits to each replacement.
Here is our list of the top MRTG alternatives:
- SolarWinds Network Performance Monitor – FREE TRIAL This comprehensive monitoring package includes autodiscovery of network devices, which leads to the creation of a constantly updated network inventory and map. Installs on Windows Server.
- Paessler PRTG – FREE TRIAL A bundle of sensors for networks, servers, and applications that you customize by deciding which sensors to turn on – its name was inspired by MRTG. Runs on Windows Server.
- ManageEngine OpManager – FREE TRIAL A monitoring package for networks and servers that produces a network map and shows live performance graphs for network device performance. Available for Windows Server and Linux.
- Site24x7 – FREE TRIAL Offers a modern, comprehensive alternative to MRTG for system and network traffic graphing. Its capabilities in providing detailed insights, advanced analytics, and real-time monitoring make it a superior choice for network administrators and IT professionals to effectively manage network traffic and system performance. Start a 30-day free trial.
- Nagios Core A free tool that monitors networks, gathering live performance data but requires a dashboard upgrade – check out the paid version, Nagios XI. Available for Linux.
- Cacti A free tool that shows live network activity and performance in a series of graphs, just like MRTG. Available for Windows and Linux.
- Zabbix An attractive, free monitoring system for networks, servers, and applications that is open source, so you can customize it if you want. Available for Windows, Linux, macOS, and Unix.
- Munin This free tool for Linux and Unix is based on a program written by MRTG’s creator and it provides live performance graphs of network performance.
Some reasons that network engineers are looking to switch away from MRTG and find a suitable alternative are:
- Lack of Updated and Intuitive Graphical Interface
- Expand-ability and Scaling to multiple system types
- Flexible Alerting and Notification System
- Additional Monitoring Options
- Intuitive and Easier Installation, Configuration and Updating
- Better Support, Community and Active Forum
- Consistent Software Updates
These are just a few reasons why folks are looking for replacements to MRTG. Below you'll find a quick list of the best software packages that we think would be suitable for traffic and system monitoring.
The Top MRTG Alternatives/Replacements
Our methodology for selecting MRTG alternatives
We reviewed various MRTG alternatives and analyzed the options based on the following criteria:
- Support for various data collection methods (Netflow, sFlow, etc.)
- Reporting and alert capabilities
- A facility to analyze network performance over time
- Graphical interpretation of data, such as charts and graphs
- A free trial period, a demo, or a money-back guarantee for no-risk assessment
- A good price that reflects value for money when compared to the functions offered
We'll break this up into 2 categories – First we'll cover Windows alternatives and then Open-source versions. Some of the package listed below have FREE or Freeware versions available for use with either a Time limit or Certain number of Sensors/Devices your allow to monitor.
1. SolarWinds Network Performance Monitor – FREE TRIAL
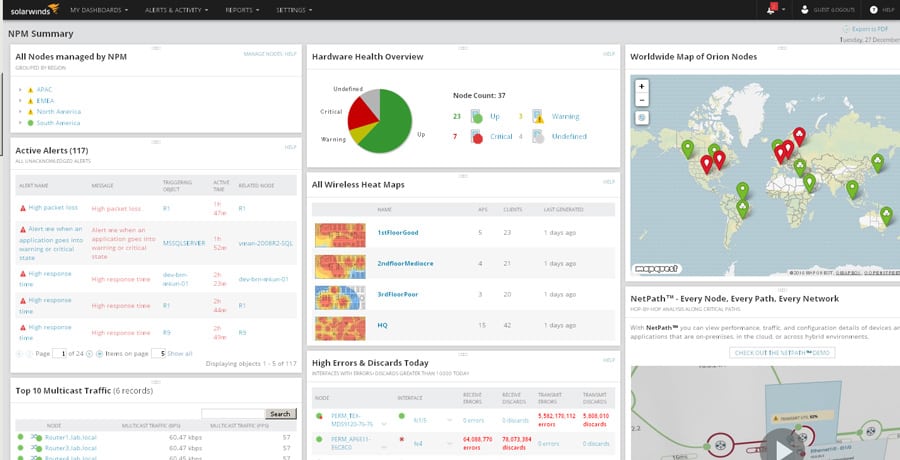
SolarWinds NPM is another Excellent option to MRTG, considering there vast Market share and constant updates to NPM, its no wonder they are at the head of the game in terms of Network Monitoring and Management.
SolarWinds has integrated proprietary technologies into their Network Performance monitoring software that gives you an in-depth look into your network and bandwidth and lays it out for you in a way that is easy to digest and take action.
Some features of NPM include the following:
- Hop by Hop (Netpath) Analysis and Graph of traffic
- Wifi and Wired Network Mapping (Dynamic)
- Wireless (wifi) Network Monitoring
- Capacity Forecasting, Alerts and Reports
- Performance and Availability Monitoring for detecting Faults
- Easy Installation with Automated Network Discovery/Mapping
- Easy to Use Interface with is Customizable
- Packet Capturing and Packet Sniffing (Netflow, sFlow, jFlow, Netstream and IPfix compatible)
- Hardware Monitoring, Alerting and Notifications
- Low Minimum system requirements to Run NPM (Deploy on Test VM if necessary!)
Why do we recommend it?
SolarWinds Network Performance Monitor is recommended for its comprehensive network monitoring capabilities, including advanced features like Hop by Hop (Netpath) Analysis, dynamic network mapping, and packet capturing. Its intuitive interface and customizable dashboard make it ideal for in-depth network analysis and performance optimization.
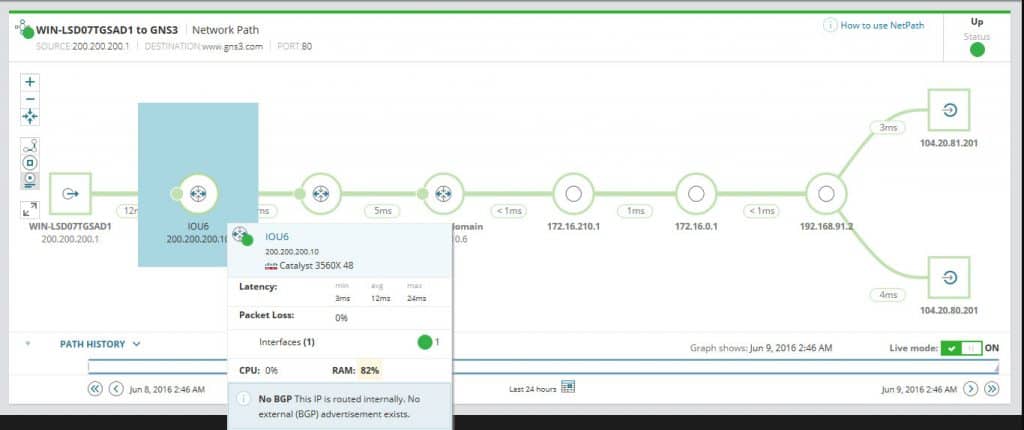
There NetPath feature helps you analyze and pinpoint issues at each “hop” in your network. This takes all the guess work out of finding which node is bogging down your bandwidth and helping your drill down the critical path of your network traffic. From there, you can solve the issue quickly and move onto optimizing your network speeds in order to provide the best user experience for your users.
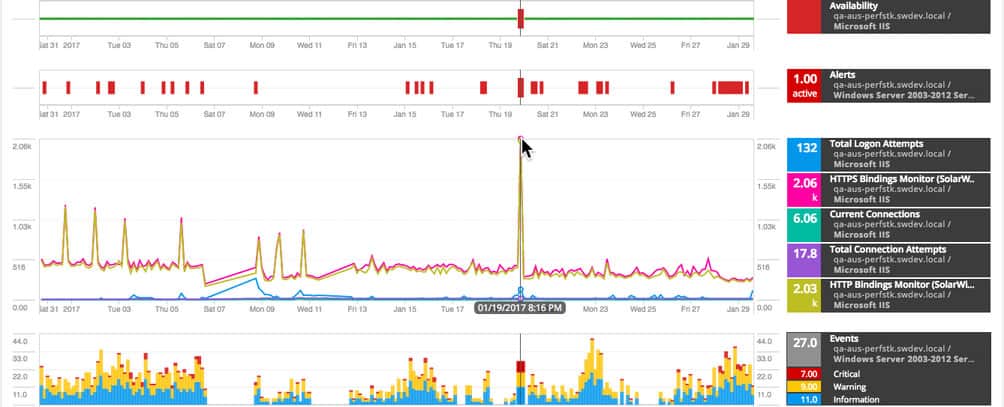
Netpath is one of the most visual and intuitive ways to spot a bandwidth bottleneck in your network – with info such as Utilization rates, latency in milliseconds, packet loss, error rate, and hop count, you can drill down to see where the issue is immediately. See Image below for a detailed screenshot of how Netpath looks:
Who is it recommended for?
This tool is ideal for system administrators and IT professionals in medium to large enterprises who require detailed network monitoring and management, especially those who need to pinpoint and resolve network issues efficiently.
Pros:
- Supports auto-discovery that builds network topology maps and inventory lists in real-time based on devices that enter the network
- Has some of the best alerting features that balance effectiveness with ease of use
- Supports both SNMP monitoring as well as packet analysis, giving you more control over monitoring than similar tools
- Uses drag and drop widgets to customize the look and feel of the dashboard
- Tons of preconfigured templates, reports, and dashboard views
Cons:
- This is a feature-rich enterprise tool designed for sysadmin, non-technical users may some features overwhelming
SolarWinds NPM is one of the Top contenders for Network Graphing and Monitoring – They offer a 30-day Free Trial below – We suggest you Download and Get it installed on a Test Server or VM to really see the features we've covered above – The NetPath feature alone makes this software a game-changer!
EDITOR'S CHOICE
SolarWinds Network Performance Monitor (NPM) is our top pick for network monitoring solutions, setting a high standard in the industry. With its extensive market presence and continuous updates, SolarWinds NPM stands out as a comprehensive tool for network management and monitoring.
The integration of proprietary technologies in NPM offers an in-depth analysis of network and bandwidth usage, presented in a user-friendly manner. This ease of understanding and actionability is a significant advantage for network administrators.
Download: SolarWinds Network Performance Monitor Free Trial
OS: Windows
Official Site/Download: https://www.solarwinds.com/network-performance-monitor/registration
2. Paessler PRTG – FREE TRIAL
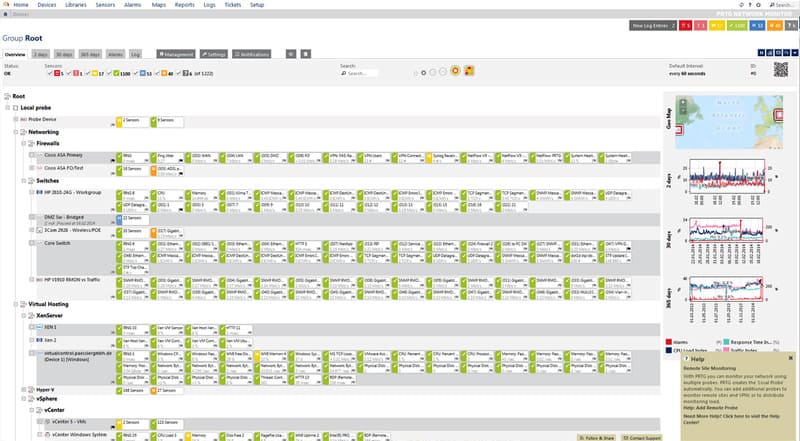
Paessler PRTG is also know as the “MRTG of Windows” as many have called it and rightfully so. It has a Fully featured graphing engine along with highly customizable traffic monitoring capabilities for almost any device you want to monitor.
Some Highlights of PRTG are as follows:
- Customizable Alerting Systems (SMS, Email, Push Notifications, Pager Alerts, Syslog/Event Log, SNMP Traps, Http/EXE Exe's, SNS Messages and Automatic Tickets)
- Mobile Apps for Monitoring on the Go (iPhone/iOS, Andorid and Windows Phones)
- Automatic Network Maps w/ over 300 Network Objects
- Monitor Cloud Services, DMZ's and other Remote Locations
- Flow Protocol Analysis (including Netflow, sFlow, IpFix, and Packet Sniffing
- WMI, SNMP and SSH probing and monitoring for Windows/Linux/Unix/Mac OSX and other Operating Systems
Why do we recommend it?
Paessler PRTG is recommended for its versatility in traffic monitoring and customizable alerting systems. The tool's ease of use, combined with support for various monitoring protocols and mobile app availability, makes it a robust solution for diverse network environments.
Its GUI is very intuitive and they provide a very reasonably priced licensing structure that many admins and engineers have chosen over other competitors. PRTG is Commercially supported and has a extremely diligent support schedule as well as a community that has backed it from its early days.
Who is it recommended for?
It is suitable for network administrators and IT managers who need a comprehensive, user-friendly tool for monitoring a wide range of network devices and services, especially in Windows environments.
Pros:
- Uses a combination of packet sniffing, WMI, and SNMP to report network performance as well as discover new devices
- Autodiscovery reflects the latest inventory changes almost instantaneously
- Drag and drop editor makes it easy to build custom views and reports
- Supports a wide range of alert mediums such as SMS, email, and third-party integration
- Supports a freeware version
Cons:
- Is a very comprehensive platform with many features and moving parts that require time to learn
As fully featured as it is, PRTG doesn't fail to surpise us with their Offering – They currently offer PRTG for free to monitor up to 100 sensors for as long as you want! You can start with a 30-day free trial to figure out your requirements.
Official Site: https://www.paessler.com/prtg
3. ManageEngine OpManager – FREE TRIAL
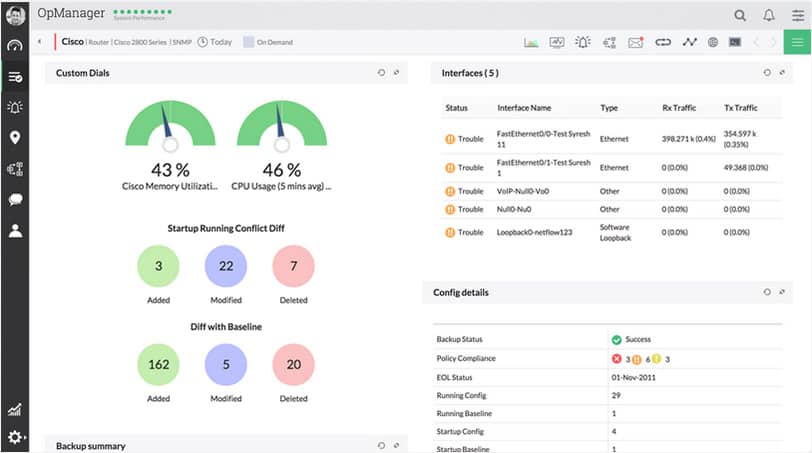
ManageEngine OpManager has come a long way in recent years and has proven to be a suitable replacement for traffic graphing and monitoring. OpManager has a great feature set that will prove to be useful in any infrastructure, including many features that MRTG lacks.
We've detailed a FULL OpManager review here, some main features of OpManager include:
- Bandwidth Analysis
- Server and Network Monitoring
- Log Management for your Perimeter Devices (Firewalls, etc)
- IP Address Management for Switches & Config Management
Why do we recommend it?
ManageEngine OpManager is recommended for its efficient bandwidth analysis, server and network monitoring capabilities, and IP address management. Its user-friendly interface and intelligent alerting system make it a valuable tool for network management.
Who is it recommended for?
This tool is ideal for IT professionals looking for a holistic network management solution that is both feature-rich and easy to use, particularly in larger networks where managing a wide array of devices is crucial.
Pros:
- Designed to work right away, features over 200 customizable widgets to build unique dashboards and reports
- Leverages autodiscover to find, inventory, and map new devices
- Uses intelligent alerting to reduce false positives and eliminate alert fatigue across larger networks
- Supports email, SMS, and webhook for numerous alerting channels
- Integrates well in the ManageEngine ecosystem with their other products
Cons:
- Is a feature-rich tool that will require a time investment to properly learn
ManageEngine OpManager also provides a limited Free version with up to 10 Devices to monitor. You can also download the 30-day free trial.
Download Page: https://www.manageengine.com/network-monitoring/
4. Site24x7 – FREE TRIAL
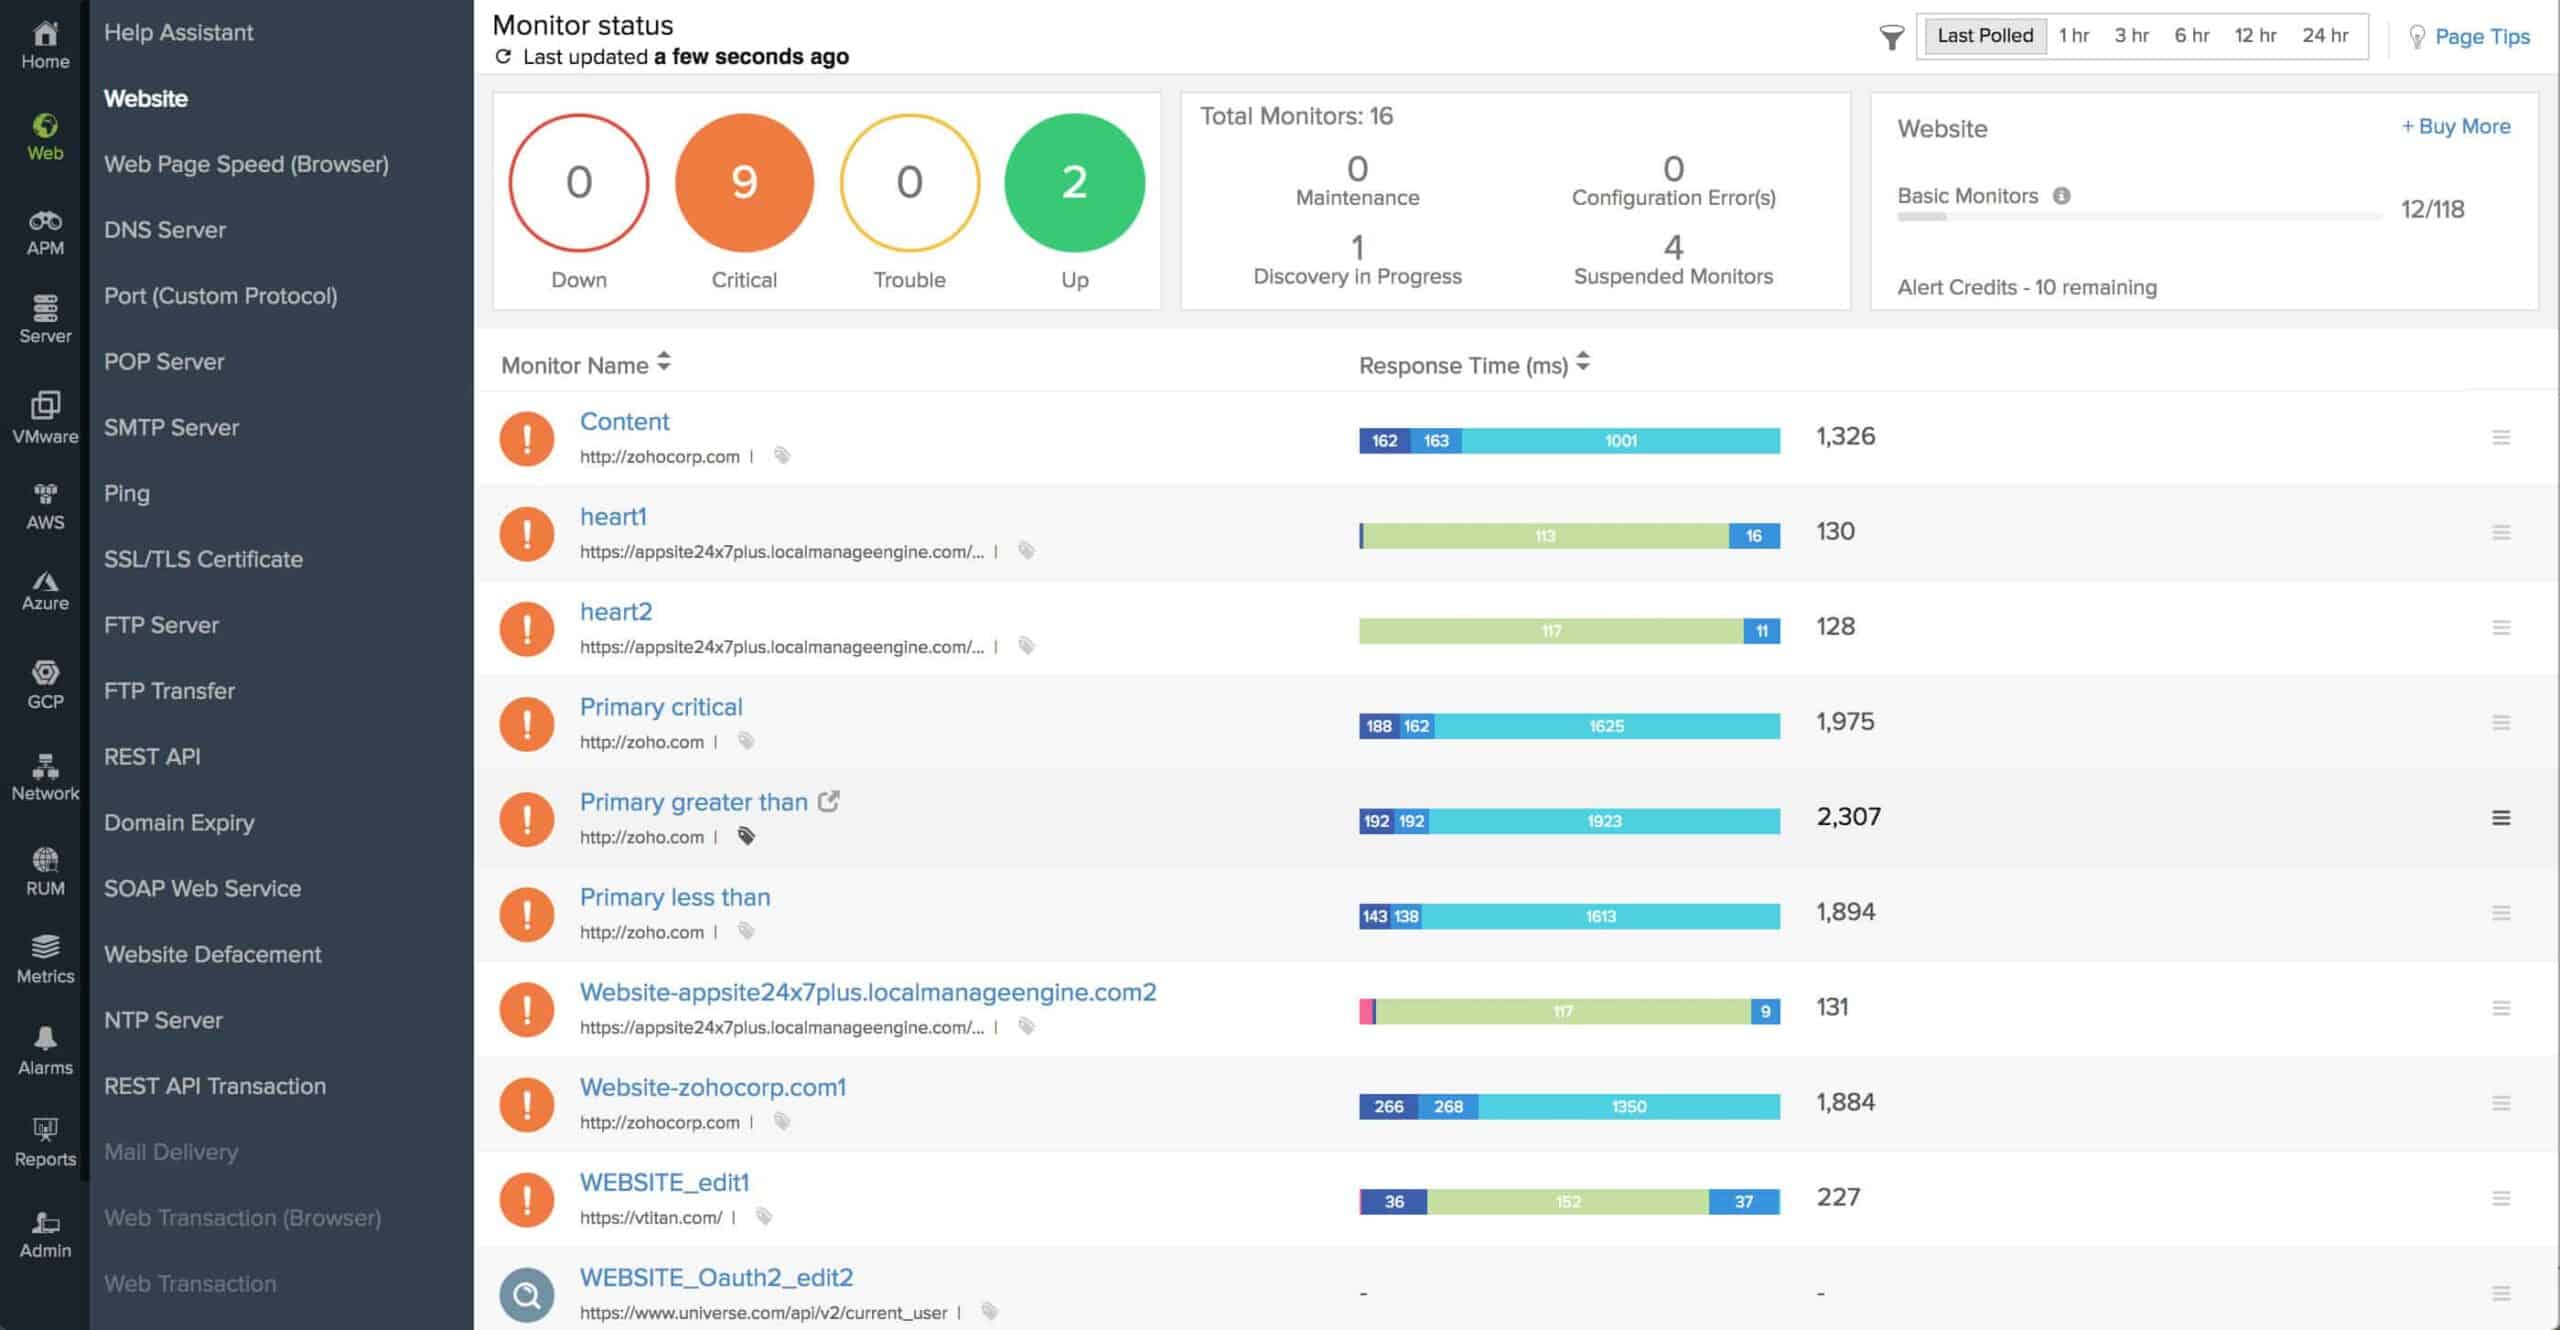
Site24x7 emerges as a robust alternative to MRTG for system and network traffic graphing. It offers a more modern and comprehensive solution for monitoring network traffic and system performance. Site24x7 excels in providing detailed insights and visualizations, making it easier for network administrators and IT professionals to understand and manage their network and system resources effectively.
Key Features:
- Real-time network traffic monitoring and graphing
- Advanced analytics for bandwidth usage and performance
- Customizable dashboards for visualizing key metrics
- Alerting system based on thresholds and anomalies
- Support for a wide range of devices and protocols
Why do we recommend it?
Site24x7 is recommended for its advanced and intuitive traffic graphing capabilities. It offers a significant upgrade over traditional tools like MRTG, with enhanced usability, real-time data, and extensive support for various network devices and protocols.
Who is it recommended for?
This tool is ideal for network administrators, IT managers, and professionals responsible for maintaining and optimizing network and system performance. It is especially beneficial for those who need detailed insights and analytics to manage complex network environments.
Pros:
- Detailed and real-time traffic monitoring and graphing
- User-friendly customizable dashboards
- Comprehensive alerting and reporting features
Cons:
- The extensive range of features may require a learning curve for users transitioning from simpler tools like MRTG
Now we'll highlight some Open-source successors that have the same or more features and options as MRTG.
5. Nagios Core
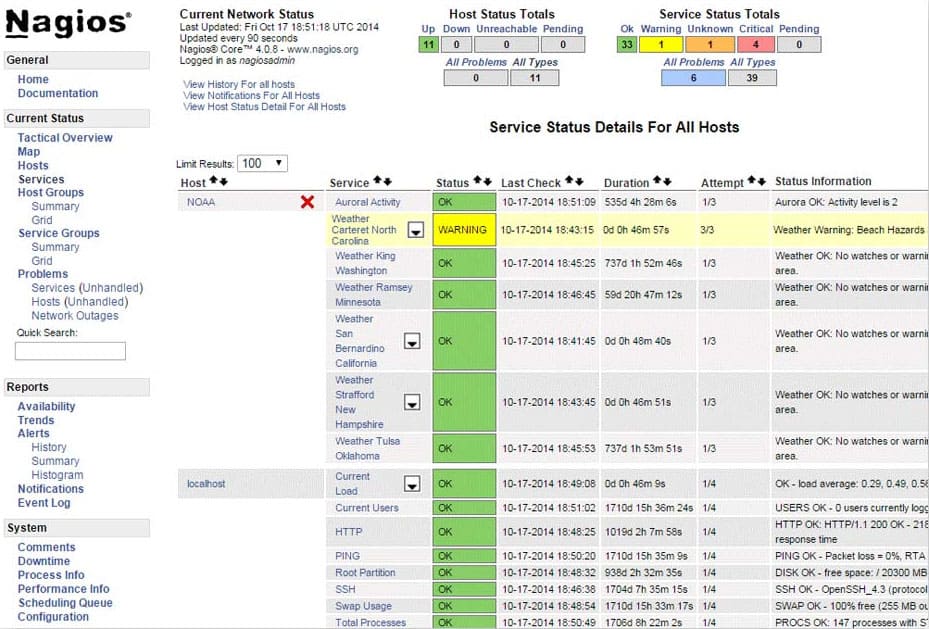
Nagios, as well-known as it is in the IT community, has a commercial version as well as a Open source version, known as the Core. Nagios has been around for some time now and has made a name for itself, so no introduction is necessary.
Some features of Nagios include (full feature list can be seen here):
- Monitor Devices using SNMP, POP3, HTTP, PING, NNTP, etc)
- Hardware Monitoring (Hard Disk Utilization/Usage, Processor Loads, etc)
- Flexible Plugin Capability for Customizing Add-on's and Plugins for additional checks
- Email/Pager or Custom defined Notifications
- Log File Rotation (Auto)
- Optional Graphical Web Interface
Why do we recommend it?
Nagios Core is recommended for its simplicity and flexibility, backed by a wide range of community-designed plugins. Its capacity for hardware monitoring and customizable notifications makes it a solid choice for open-source network monitoring.
If you want an Open-source solution but not Necessarily Nagios, we've compiled a list of the Top Nagios alternatives for you to choose from.
Who is it recommended for?
Ideal for IT administrators and engineers who prefer open-source solutions and require a customizable, straightforward interface for monitoring various network devices.
Pros:
- Simple, yet informative interface
- Flexible alerting options support SMS and email
- A wide range of community-designed plugins are available for free
Cons:
- The open-source version lacks the support found in paid products
Download: https://www.nagios.org/projects/nagios-core/
6. Cacti
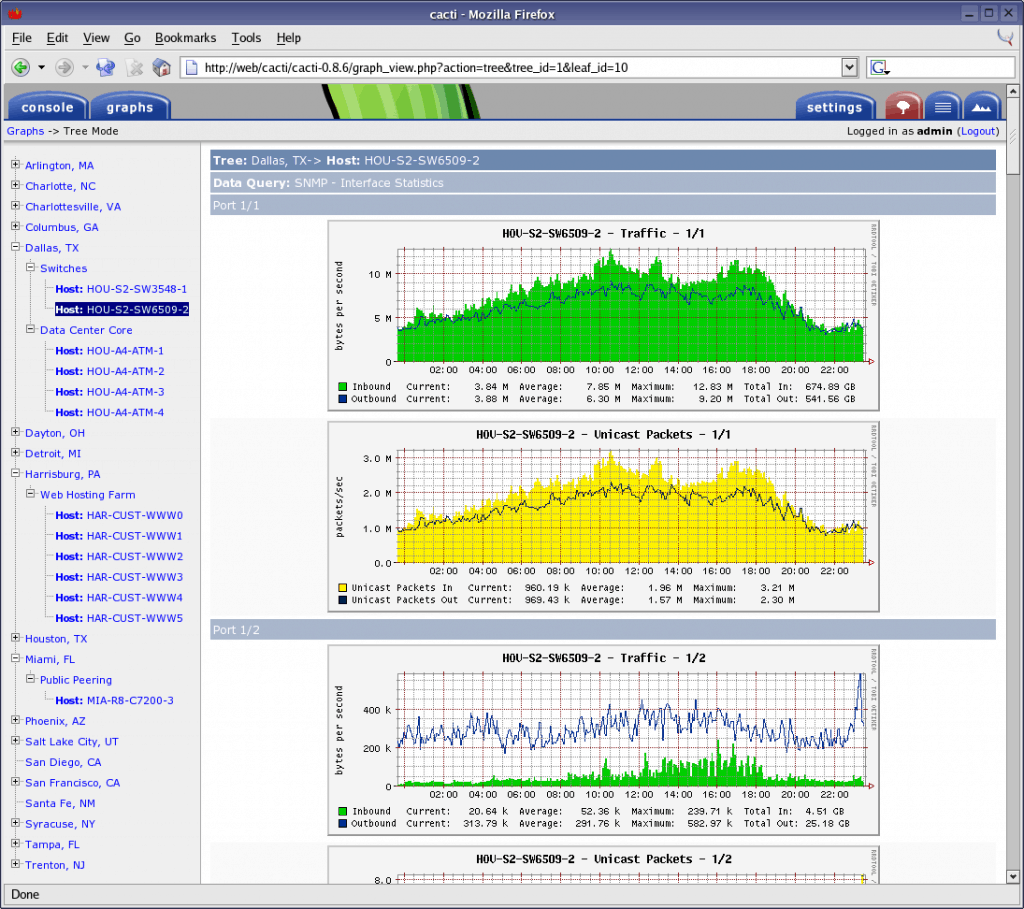
Cacti is a fairly straight-forward tool based on RRDTool for graphing out Bandwidth usage and other critical monitoring components in a simple GUI. Cacti is based on PHP and has built in SNMP support for polling devices for SNMP data and updating your RRD files.
Key Features:
- Based on RRDTool for graphing bandwidth usage
- Built-in SNMP support for polling device data
- Utilizes PHP for its framework
Why do we recommend it?
Cacti is recommended for its focus on data visualization and highly customizable monitoring features. Its simplicity and large community support make it a valuable tool for researchers and those needing detailed data collection.
Who is it recommended for?
Cacti is best suited for IT professionals and researchers who require a flexible, graph-based network monitoring tool, especially those comfortable with PHP and SNMP.
-
Pros:
- Highly customizable monitor with a focus on data visualization
- Large dedicated community of over 20,000 members
- Simple interface
- Ideal for researchers looking for more flexibility in their data collection
Cons:
- Has a steeper learning curve than competing product
You can find more information and Full Features on Cacti on their Official website here: http://www.cacti.net/features.php
7. Zabbix
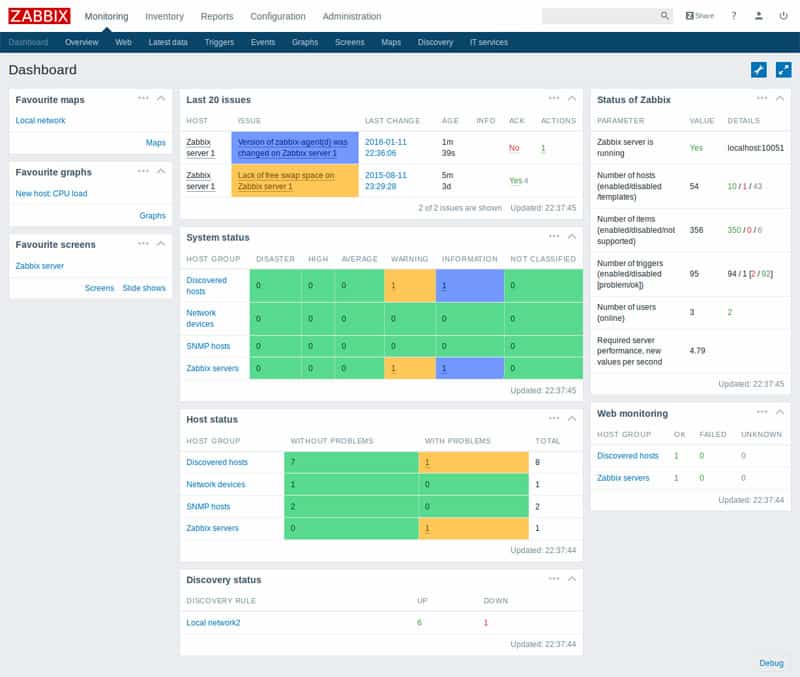
Zabbix monitoring server allows you to monitor a wide variety of systems including Linux, IBM AIX and Power8, FreeBSD, NetBSD, OpenBSD, HP-UX, Max OSX, Solaris and Windows Desktops and Server operating systems.
Key Features:
- Agentless monitoring of Network Devices
- VMware (vSphere and vCenter) monitoring
- Database Monitoring features
- Java Application monitoring (jBoss, Tomcat and Oracle App Servers)
- Hardware Monitoring
- Critical Web Services
- Highly Scalable for Enterprise Systems
- Open-source and Free for both Commercial and Non-Commercial Use
- Although it can monitor a wide-array OSes, it can be installed on all the previous operating systems Other than Microsoft. For many admins, this may or may not be an issue, depending on your abilities and skill level within a linux/unix based environment.
Why do we recommend it?
Zabbix is recommended for its open-source nature and broad monitoring range, using both SNMP and ICMP. Its capabilities for detecting new devices and configuration changes, alongside robust notification systems, make it a comprehensive monitoring solution.
Who is it recommended for?
Zabbix is ideal for network administrators who need an open-source, scalable tool capable of monitoring a diverse range of systems and devices across different operating environments.
-
Pros:
- Open-source transparent tool
- Uses both SNMP and ICMP for a broader monitoring range
- Can detect new devices and configuration changes immediately
- Offers useful templates for quick insights
- Robust notification system supports SMS, email, custom script, and webhook
Cons:
- Would like to see better alerting features
Official Website and Download information: http://www.zabbix.com/download
8. Munin
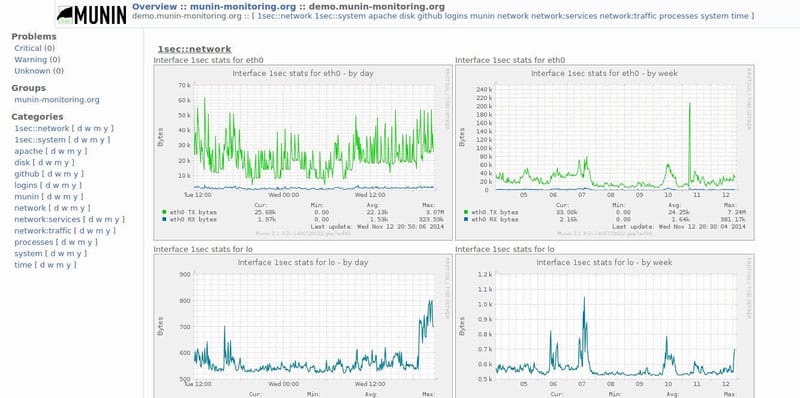
Munin, like MRTG, is written in PERL and uses the RRDTool for graphing and monitoring functionality. Available for Debian, Ubuntu, Fedora, Red Hat, Red Hat Enterprise Linux, Mandriva, Gentoo and is also available for some flavors of FreeBSD.
Key Features:
- Written in PERL, uses RRDTool for graphing and monitoring
- Free and open-source tool
- Platform-specific availability (Unix and Linux platforms only)
Why do we recommend it?
Munin is recommended for its simplicity and effectiveness in providing live performance graphs and lightweight graphics. Its ease of use makes it a practical choice for basic network monitoring.
Who is it recommended for?
This tool is suitable for IT professionals and system administrators working in Unix and Linux environments who need a straightforward, free tool for monitoring network performance.
-
Pros:
- Completely free tool
- Easy to use
- Offers live performance graphs
- Uses lightweight graphics that get the job done
Cons:
- Only available on Unix and Linux platforms
Munin can monitor almost any device you throw at it, including Sans, Servers, and most Network devices.
Official Stable Downloads: https://github.com/munin-monitoring/munin
MRTG Alternatives FAQs
What is MRTG?
MRTG, or Multi Router Traffic Grapher, is a free and open-source network monitoring tool that provides real-time traffic graphs for network devices.
What are the benefits of using an alternative to MRTG?
The benefits of using an alternative to MRTG include more comprehensive monitoring and reporting capabilities, real-time data visualization, and the ability to monitor a wider range of devices and networks.
How much does it cost to use an alternative to MRTG?
The cost of using an alternative to MRTG will vary depending on the specific tool you choose, but many alternatives to MRTG are available as commercial solutions, with pricing that is based on the number of devices and networks you need to monitor.


Download PRTG Free!