
Our funding comes from our readers, and we may earn a commission if you make a purchase through the links on our website.
The Best MongoDB Monitoring Tools

UPDATED: October 23, 2023
Monitoring your MongoDB isn’t always a simple task. While MongoDB has some decent built-in monitoring tools, they sometimes can leave DBAs with gaps in their monitoring, or a lack of big picture analytics and metrics.
In this article, we’ll be exploring the best MongoDB monitoring tools that you can use to improve your database performance, efficiency, and uptime.
Here’s our list of the best MongoDB monitoring tools:
- SolarWinds Database Performance Monitor – FREE TRIAL The best overall balance between MongoDB monitoring and scalability with other APM tools and database types. Get a 14-day free trial.
- ManageEngine Applications Manager – FREE TRIAL Supports MongoDB monitoring with advanced reporting and general health insights. Start 30-day free trial.
- Site24x7 MongoDB Monitoring – FREE TRIAL Great choice for smaller organizations who need more granular control over their monitoring budget as they scale upwards. Get a 30-day free trial.
- Paessler PRTG – FREE TRIAL Allows for detailed monitoring into MongoDB alongside other SQL-based applications. Start a free 30-day trial.
- Datadog Offers a great total APM model of monitoring that allows businesses to expand into other areas of monitoring.
- Opsview Can monitor 29 different metrics for both cloud-based and on-premises MongoDB servers.
- Nagios Keeps monitoring and add-ons simple through pre-configured features and simple wizards.
- Redgate Features scheduled reporting and root cause analysis for additional troubleshooting support
The Best MongoDB Monitoring Tools
Our methodology for selecting MongoDB monitoring tools
We reviewed various MongoDB monitors and analyzed the options based on the following criteria:
- Integration options into other platforms
- Alert and reporting capabilities
- Features that streamline the troubleshooting process (like root cause analysis)
- A facility to analyze network performance over time
- Graphical interpretation of data, such as charts and graphs
- A free trial period, a demo, or a money-back guarantee for a no-risk assessment
- A good price that reflects value for money when compared to the functions offered
1. SolarWinds Database Performance Monitor – FREE TRIAL
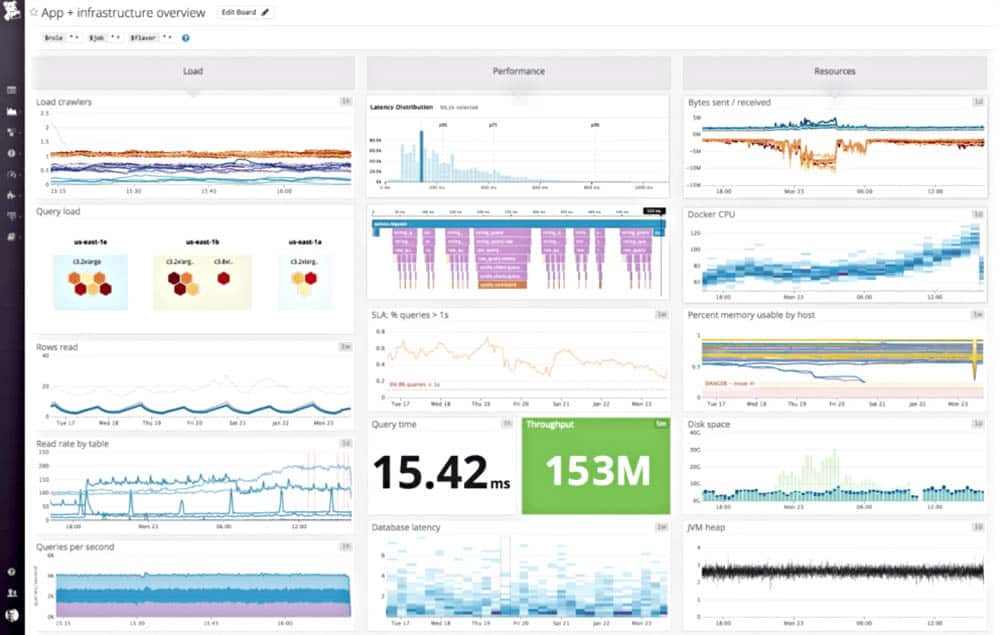
SolarWinds Database Performance Monitor (DPM) is a SaaS-based tool that provides real-time and historical performance metrics for MongoDB and other database environments. The platform features a template profile specifically for MongoDB monitoring that can help DevOps and administrators leverage a number of different tools to track metrics like latency, error rate, top queries, and latency.
Key features:
- Automated profiling analysis
- MongoDB best practice scan
- Easy onboarding and deployment
As metrics are gathered they are pulled into a fully customizable dashboard where information can be displayed through a number of different ways through the platforms widget system. The default dashboard layout displays the core key-metrics out of the box that most DBAs would want to keep tabs on.
A best practice scan can automatically be applied to your MongoDB environment that can scan the settings and configurations across multiple instances, replica sets, and the operating system to identify improvements and optimizations. Similarly, DPM continuously scans the security settings and configurations across your MongoDB deployments to identify security issues, vulnerabilities, or compliance violations.
DPM can monitor MongoDB environments in the cloud, on-premises, or across a hybrid configuration.
Pros:
- Offers simple MongoDB monitoring through an easy install
- Designed with large and enterprise networks in mind
- Supports auto-discovery that builds network topology maps and inventory lists in real-time based on devices that enter the network
- Has some of the best alerting features that balance effectiveness with ease of use
- Uses drag and drop widgets to customize the look and feel of the dashboard
Cons:
- Would like to see a longer trial period
You can test out SolarWinds Database Performance Monitor free through a 14-days free trial.
2. ManageEngine Applications Manager – FREE TRIAL
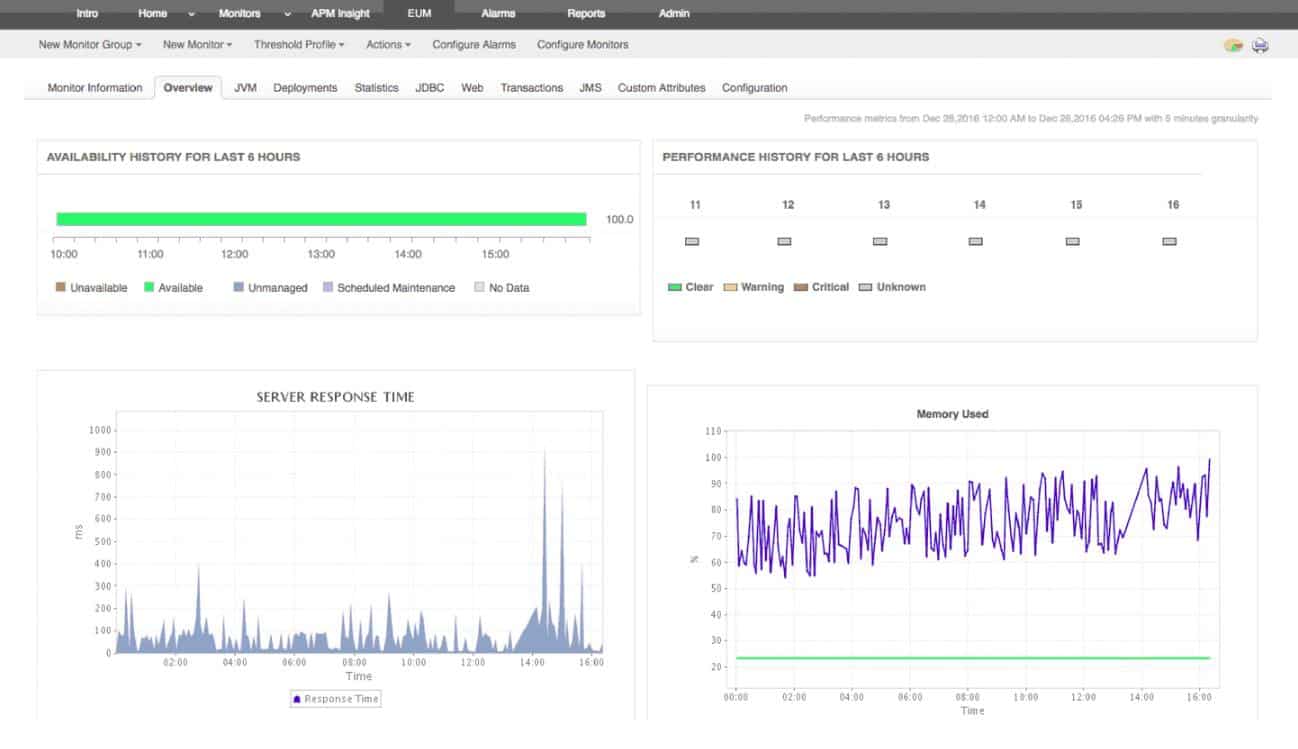
ManageEngine MongoDB Monitoring Tool – part of the Applications Manager – works to tackle both MongoDB monitoring as well as offer insight into the health of the infrastructure the database is utilizing. The ManageEngine platform helps organize and centralize key performance stats, resource utilization, and replication statistics in one place for easy access and review.
Key features:
- Flexible licensing options
- Detailed alerting options
- Log retention
The platform helps position DBAs in a more proactive state with their MongoDBs by using monitoring and alert features that give you significant warning when metrics start drifting in the wrong direction. This, paired with root cause analysis, helps drastically reduce the time it takes to resolve problems and avoid any unnecessary downtime caused by a lack of monitoring.
ManageEngine tracks metrics across the home dashboard live as well as logs them in a journal section, which acts as a historical log for auditing and review. You’ll have total visibility into different database operations such as insert, delete, update, and get more requests per second. You’ll also have a detailed look into your commits, both while they're behind a write lock and commits before a scheduled interval.
Alerts can be configured based on conditions or a threshold value to easily prevent bottlenecks when configured with enough buffers. Automation can be tied to alerts to execute scripts, allowing you to set multiple alerts based on the severity of the situation.
Pros:
- Supports multiple database types including MongoDB
- Easy to use interface automatically highlights bandwidth hogs and other network traffic outliers
- Scale well, designed for large enterprise networks
- Can view traffic on a per-hop basis, allowing for granular traffic analysis
Cons:
- Designed for enterprise use, takes time to fully explore all options available
Pricing for ManageEngine comes in three tiers, Free, Professional, and Enterprise. The free version allows for the monitoring of five apps or servers and is considered free forever. The first paid tier starts at $945 (£685) annually through the subscription model and $1895 (£1374) through perpetual licensing. You can start off with a 30-day free trial.
3. Site24x7 MongoDB Monitoring – FREE TRIAL
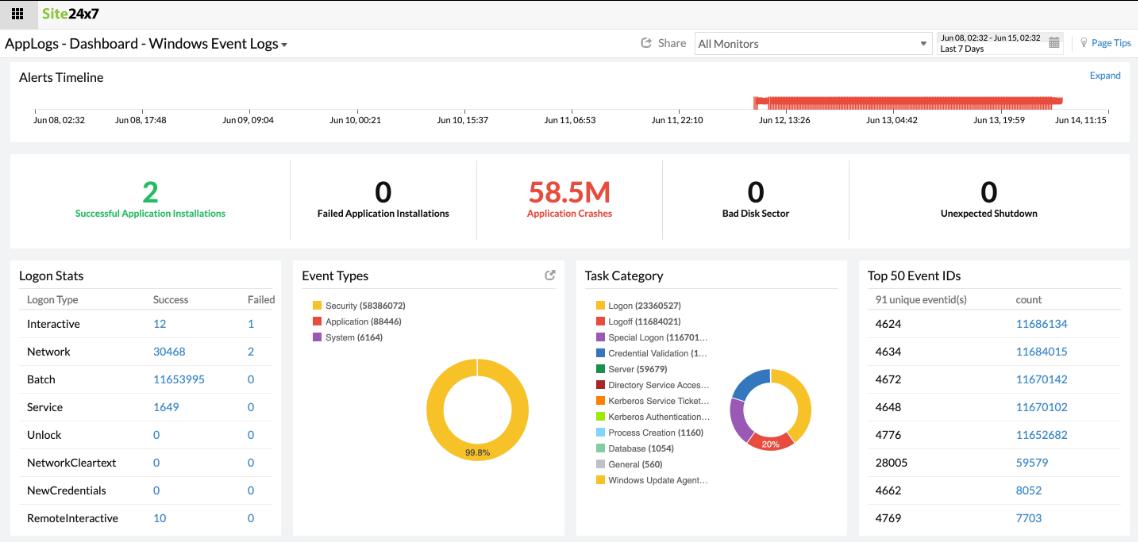
Site24x7 offers a full suite of application and server monitoring services through its cloud-based platform. While Site24x7 offers monitoring across multiple environments, its simple plugin installation makes it easy to start monitoring MongoDB alongside any other service you like.
Key features:
- Custom alarms per role, group, or person
- Total APM suite
- Flexible add-ons
The platform offers full visibility into metrics like heap usage, availability, total open cursors, and current connections. This data is collected through a lightweight Linux server monitoring agent that pulls live metrics directly from the environment it’s set to monitor.
Site24x7 currently supports over 450 vendor integrations and offers a suite of other services outside of application monitoring such as infrastructure monitoring, network monitoring, and real user monitoring.
Alerts are managed from the Alarms page and can be set to monitoring multiple thresholds or conditions in MongoDB. Alarms can be assigned to specific groups like a help desk team or individual technicians. This automatically generates an email notification to the assigned contact.
In addition to monitoring insights, Site24x7 can also act as a centralized repository for log storage and management. This can help log management across multiple databases while providing a single point of access for historical data reviews for both manual audits, and automation tools.
Pros:
- Provides additional insights via a custom MongoDB monitor
- Uses real-time data to discover devices and build charts, network maps, and inventory reports
- Is one of the most user-friendly network monitoring tools available
- User monitoring can help bridge the gap between technical issues, user behavior, and business metrics
- Supports a freeware version for testing
Cons:
- Is a very detailed platform that will require time to fully learn all of its features and options
Pricing for Site24x7 APM starts at $35.00 (£25.40) per month when billed annually and offers many different types of additional features such as added log size, network interfaces, or increased applications. You can try out Site24x7 for yourself with a 30-day free trial.
4. Paessler PRTG – FREE TRIAL
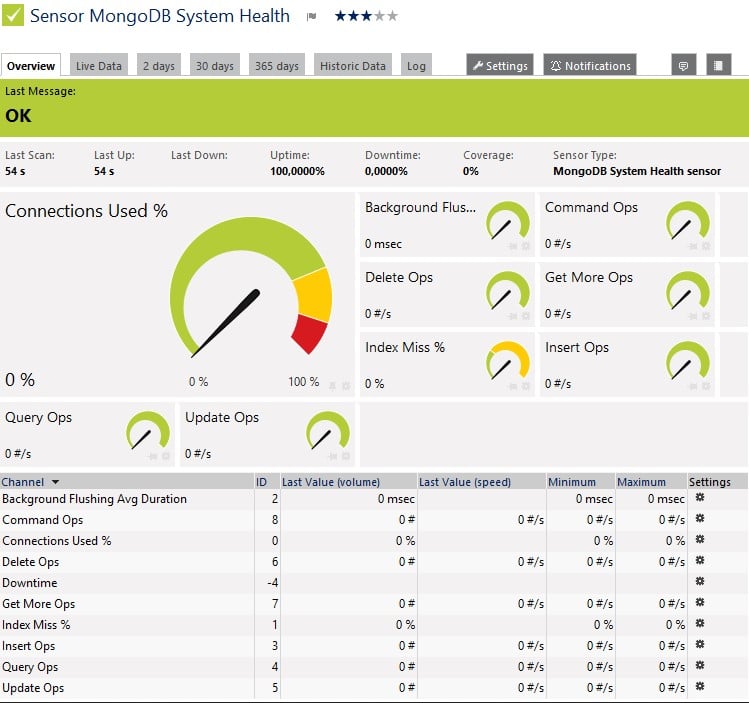
Paessler PRTG is another full-service monitoring solution that offers custom sensors to monitor specific metrics across multiple databases, servers, and applications. Its flexibility and robust monitoring capabilities make PRTG a good choice if your organization is looking to monitor other aspects of the network along with your MongoDB.
Key features:
- Freeware version
- Multiple sensors for different environments
- Flexible notification integrations
Sensors can monitor a range of health metrics in MongoDB such as query operations, used connections, missed connections, and other specific command operations per second across the database. These metrics get pulled down into the main PRTG dashboard where the information is displayed both through visualizations and a live flowing log.
Alerts can be set up to send notifications when a sensor breaches a specific threshold, changes status, or has a change in values. Creating alerts is a relatively straightforward process allowing you to get as granular as needed for certain conditions.
Alerting can be sent across a number of channels including SMS, email, SNMP, Slack, Microsoft Teams, or push notifications via the mobile app. Currently, pricing for PRTG is related to how many sensors you wish to deploy across an environment. Each sensor is able to monitor a single metric, so many times a database will need multiple sensors to report on different metrics.
Pros:
- Uses a combination of packet sniffing, WMI, and SNMP to report network performance as well as discover new devices
- Autodiscovery reflects the latest inventory changes almost instantaneously
- Drag and drop editor makes it easy to build custom views and reports
- Supports a wide range of alert mediums such as SMS, email, and third-party integration
- Supports a freeware version
Cons:
- Is a very comprehensive platform with many features and moving parts that require time to learn
There are five pricing packages available with the first being PRTG 500, which offers perpetual licensing for 500 sensors across a single server for $1750 (£1269). You can test out PRTG through a free 30-day trial. Once the trial is over your account will automatically revert to the freeware version which limits you to 100 sensors.
5. Datadog

Datadog is a cloud-based platform that offers monitoring and full-stack visibility into environments. There are no extra steps or add-ons when installing Datadog to monitor MongoDB, as its sensors are already included as a part of the base agent install.
Key features:
- Cloud-based monitoring
- Preconfigured dashboards
- Simple alerting templates
The entire platform focuses on simplifying database administration through automation and powerful visualizations or metrics that truly matter. The Datadog MongoDB integration can collect dozens of different metrics, report the status of certain events, and run a number of service checks against the database.
After the agent is installed all of these metrics will automatically populate across the default dashboard, highlighting insights like resource saturation, throughput, performance and errors, and the number of queued tasks. This breakdown makes it easy to monitor both the MongoDB as well as the infrastructure that supports it in the same place.
Creating alerts is easy and done through a four-step process that allows you to alert on specific hosts, processes, services, metrics, or any combination of their conditions together. The backend API allows for notifications to easily be ported over to Slack, PagerDuty, or any other number of messaging platforms your team may use. For larger organizations, this same API integration can be applied to popular ticketing platforms like ServiceNow, where alerts create tickets that can be handled by a NOC team.
Pros:
- Easy to use customizable dashboards and reporting for MongoDB
- Cloud-based SaaS product allows monitoring with no server deployments or onboarding costs
- Supports auto-discovery that keeps up with expanding MongoDB environments automatically
- Allows businesses to scale their monitoring efforts reliably through flexible pricing options
Cons:
- Would like to see a longer trial period for testing
Pricing for Datadog APM starts at $31.00 (£22.49) when billed annually, and includes 15-month search retention, 15-day historical search and analysis, and 15 minutes of live search tracing. You can test out Datadog for your MongoDB set up through a free 14-day trial.
6. Opsview
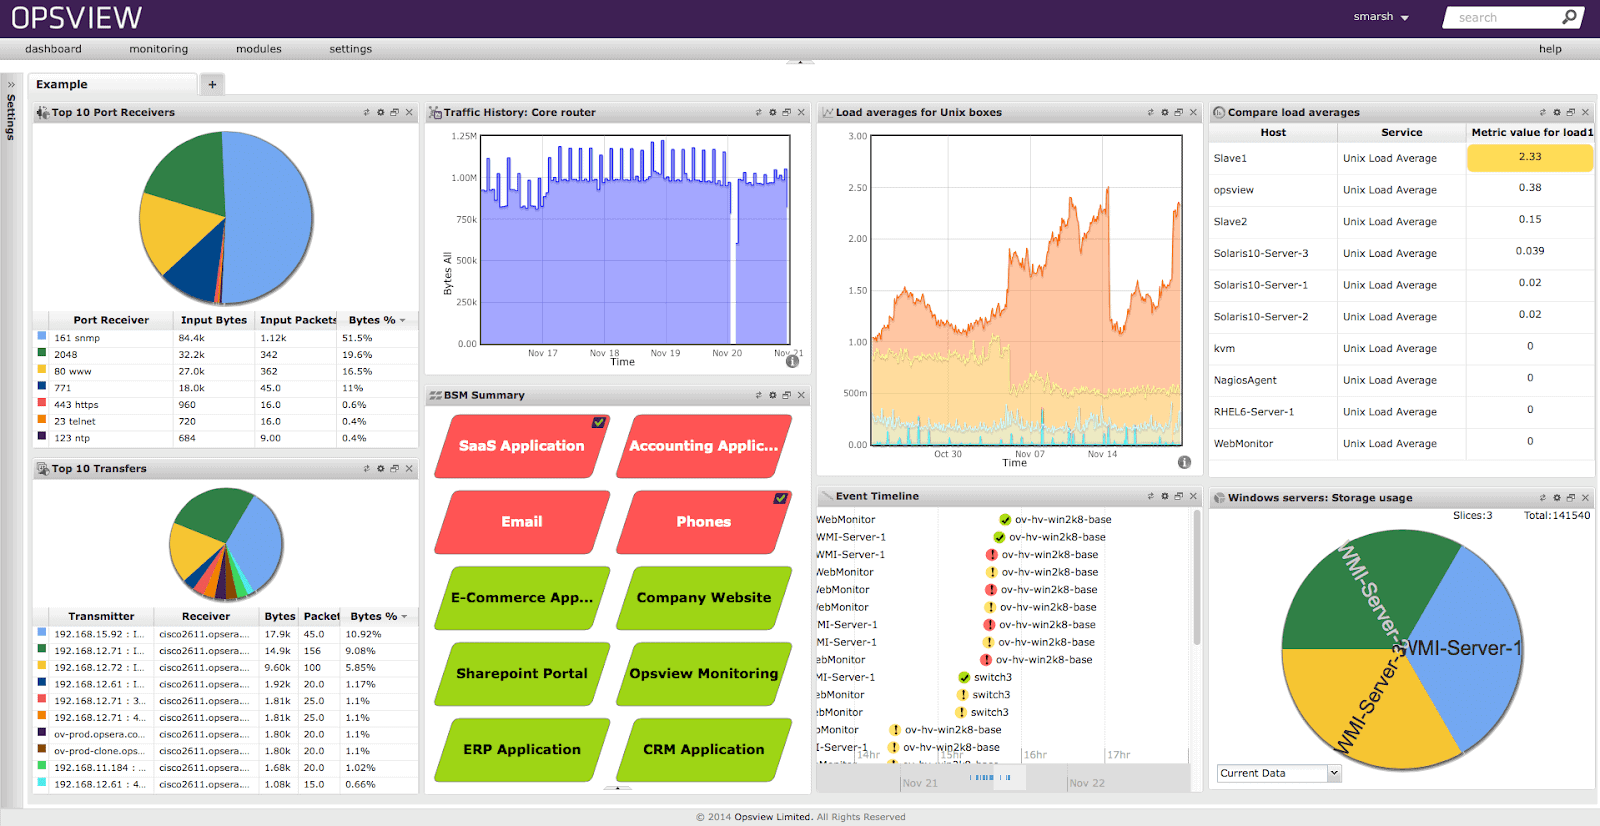
Opsview is another full suite monitoring option for MongoDB that can also offer to monitor across networks, infrastructure, and cloud services. The platform uses 29 different service queries to check the status of different metrics across the database and report them live under the reporting section and live home screen dashboard.
Key features:
- Monitoring across 29 MongoDB metrics
- Detailed alert integrations for service desk apps
- On-premises and cloud solutions
Metrics like index size, number of assets, and page faults are all recorded along with system resource insights like memory usage, and storage statistics. Installing Opsview from scratch is a straightforward process and offers deployments in the cloud for all sized organizations and on-premises deployments for businesses with more than 300 hosts.
The MongoDB monitoring is enabled through a plugin install that uses host templates for configuration. Once the new host variables are configured and authentication is completed, the system will begin pulling data from MongoDB within minutes of deployment.
Alert management is fairly detailed but still easy to set up. You can choose conditional or threshold-based alert monitors as usual, but also configure notifications to be run on either the orchestrator or the collector, which is beneficial for clustered environments. Features include intelligent alerting and simple wizard setups to help lump similar alerts together and reduce alert fatigue across helpdesk teams and DBAs.
The backend allows for API integrations into many different service desk platforms with options to customize the notifications to communicate severity, escalation, and role assignment to help desk platforms.
Pros:
- Is a comprehensive platform that supports MongoDB monitoring through a plugin
- Clean easy to use interface
- Great native reports and data visualizations
- Supports a free and paid version
Cons:
- Expandable through plugins – not the best option for companies looking for a comprehensive single tool
Currently, Opsview comes in three tiers, SMB, Enterprise, and Opsview Cloud. The SMB tier is marketed towards businesses with less than 300 hosts that need on-premises monitoring with the option for six to 12-month subscription plans starting at $1300 (£942.82) annually for 50 hosts. The other two tiers do not have pricing that is publicly available. You can test out the platform free through a product trial.
7. Nagios
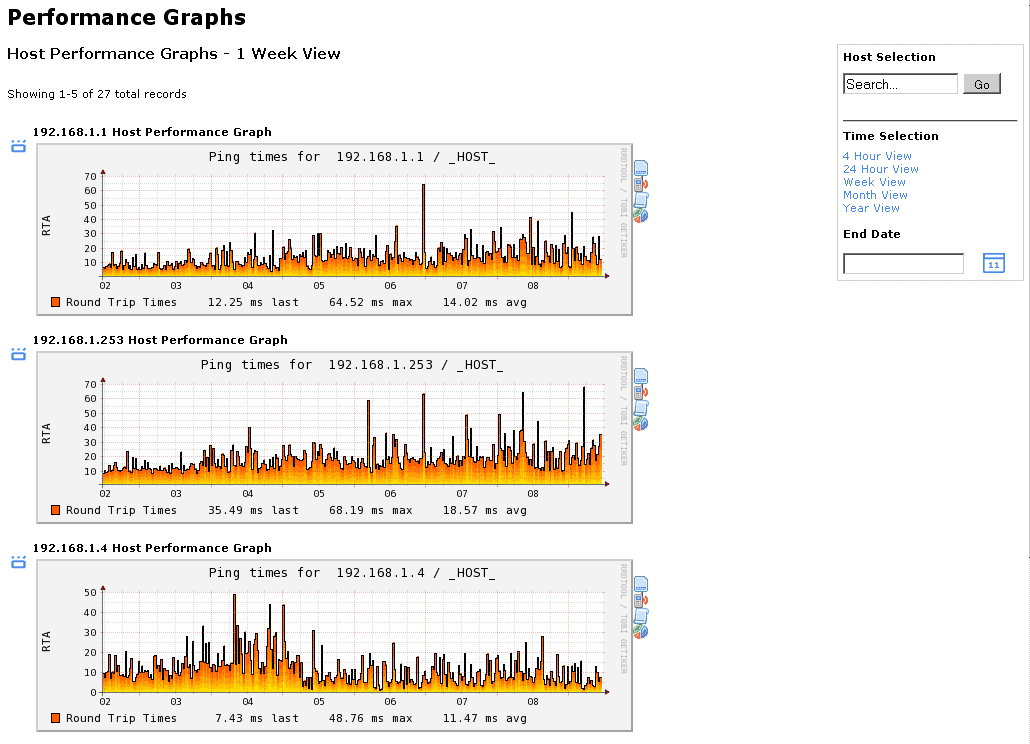
Nagios offers database and application monitoring with specific integrations that allow you to include MongoDB into their monitoring platform. The front end of the system is highly visual and helps DBAs, as well as teams, simplify monitoring to help clean up complicated monitoring tools that are scattered across an organization.
Key features:
- Simple pricing structure
- SLA reporting
- Capacity planning
Through an integration wizard, Nagios begins pulling in data from MongoDB and displaying it across preconfigured dashboards for near-instant insights. The platform does a great job at providing high-level live health metrics as well as displaying those stats to historical data for comparison. All of this data is available through the web interface and can be accessed from virtually anywhere.
Outside of just monitoring Nagios features capacity planning tools that leverage the data collected to help DBAs understand their average usage, and plan for migrations or hardware upgrades. Infrastructure can also be monitored in relation to MongoDB, where metrics like resource consumption and average usage can be reported, recorded, and monitored. The auto-discovery feature constantly monitors the environment for changes and auto-updates the inventory when new items are added or need to be decommissioned.
Everything inside of Nagios is designed to be executed with as little hassle as possible. Anything that can be packaged into a wizard format has been done for the user. The wizards strike a solid balance with convenience, while still allowing for admins to make more advanced changes if needed.
The agent is Linux-based and can be run from the MongoDB server itself. The reporting platform takes up a very small resource footprint only needing roughly 2GB of memory and 20GB of free disk space.
Pros:
- Simple, yet informative interface
- Flexible alerting options support SMS and email
- A wide range of community-designed plugins are available for free
Cons:
- The open-source version lacks the support found in paid products
Pricing for Nagios is straightforward and comes in two tiers, Standard Edition and Enterprise Edition. With Standard, you’ll receive advanced reporting, easy configuration wizards, and custom dashboards for $1995 (£1447.20) per year. The Enterprise Edition adds SLA reports, capacity planning reports, audit logging, and bulk modification tools on top of the standard edition for $3495 (£2535.33).
8. Redgate
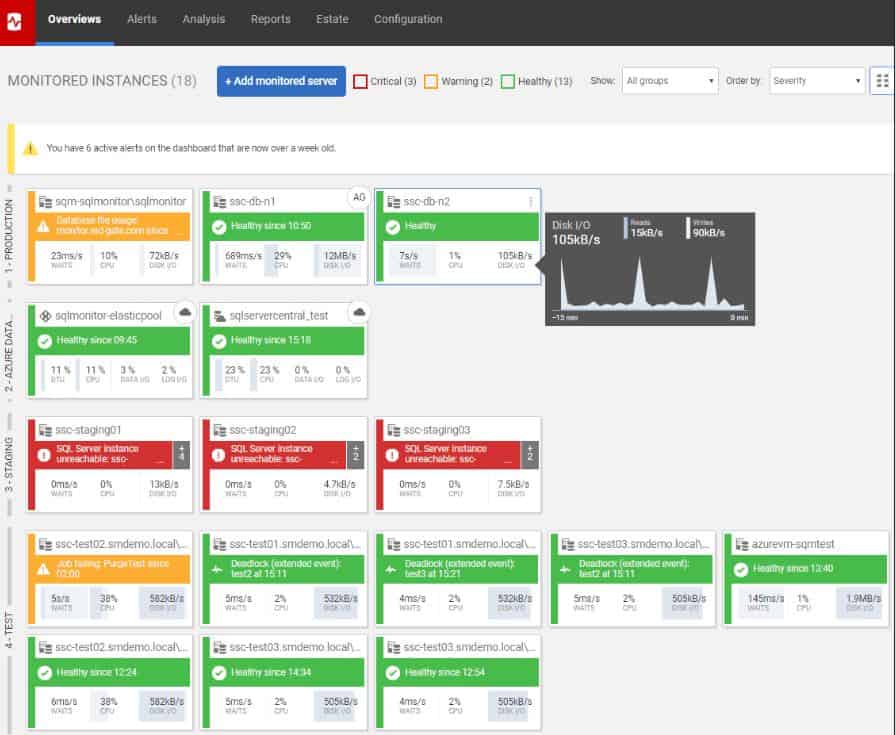
The Redgate platform offers database monitoring across multiple clouds, on-premises, or hybrid locations and leverages their cloud to monitor and centralize all server or database health metrics. Redgate is a good option for organizations who are looking to grow their network quickly over time, as Redgate can automatically discover new server instances, database expansions, or hardware resources as they are added.
Key features:
- Root cause analysis
- Schedule reporting
- On-premises and cloud monitoring capabilities
Redgate offers excellent visualizations into your MongoDB server allowing you to track infrastructure, database, and service level metrics all from a single pane of glass. The dashboard is fully customizable and uses widgets to make configuration simple. Dashboards can be saved per user, or assigned to groups to ensure all teams are measuring what matters.
The global dashboard allows for simple and high visual indicators to notice when something is wrong. As alerts go off, intelligence baseline monitoring works to display the abnormality and uses root cause analysis to help assist DBAs in pinpointing the problem.
Database deployments are also tracked which can help DBAs compare before and after performance metrics. You can integrate third-party tools using the API to integrate database changes through Redgate if needed.
The alerting section comes pre-configured with over 65 alert templates that are ready to customize and deploy. These customizable alerts let you set priorities, assign contacts, and port notifications to email or apps like Slack, PagerDuty, or the service desk platform.
Pros:
- Scalable interface, can manage multiple databases without clutter
- Best suited for multi SQL server environments
- Offers pre-configured alerts and templates specifically for SQL DBAs
Cons:
- The trial is only 14 days, could be longer
Lastly, reports can be generated and sent out on a scheduled basis and be templated to assist other network administrators or ancillary departments with separate metrics. You can test out Redgate through a 14-day free trial.
Choosing a MongoDB monitoring tool
In almost all cases SolarWinds Database Performance Monitor will provide small as well as large dev teams with all the tools they need to not only monitor their MongoDB but expand into other areas of database monitoring as well with one platform.
If your organization is looking for more of an APM tool, both Datadog and Site24x7 offer a full suite of APM and server monitoring capabilities that can monitor MongoDB environments along with their supporting infrastructure.
How do you monitor MongoDB? Do you use one of the standard monitoring tools built-in? Let us know what challenges you face in the comments below.
MongoDB Monitoring Tools FAQs
How often should I monitor MongoDB?
It's a good practice to monitor MongoDB on a continuous basis, but at a minimum, you should monitor it at regular intervals, such as once a minute or once every five minutes.
What are some common issues that can be identified through MongoDB monitoring?
Through monitoring, you can identify issues such as slow queries, high CPU usage, high memory usage, insufficient disk space, and replication lag.
How can I optimize MongoDB performance based on monitoring data?
Based on monitoring data, you can optimize MongoDB performance by identifying and resolving bottlenecks, improving indexing, tuning the MongoDB configuration, and scaling the database horizontally or vertically.

