
Our funding comes from our readers, and we may earn a commission if you make a purchase through the links on our website.
The Best MariaDB Monitoring Tools
UPDATED: October 23, 2023
MariaDB is one of the most popular open-source database servers on the planet thanks to its scalability, flexibility, and improvements over traditional MySQL databases. In this article, we’ll explore seven of the best MariaDB monitoring tools on the market, and discover how each tool works to enhance and simplify the monitoring experience. Let’s get started.
Here are our top picks for the best MariaDB monitoring tools:
- SolarWinds Database Performance Analyzer – FREE TRIAL Powerful database monitoring for multi-network database distributions. Start a 14-day free trial.
- Paessler PRTG Network Monitor – FREE TRIAL Specially designed monitors for MariaDB, ideal for larger organizations. Start 30-day free trial.
- ManageEngine Applications Manager – FREE TRIAL This monitoring system tracks application dependencies and it includes the ability to monitor MariaDB databases. Available for Windows Server, Linux, AWS, and Azure. Get a 30-day free trial.
- Site24x7 A cloud-based database monitor that offers monitoring for MariaDB along with network and infrastructure monitoring.
- Datadog One of the easiest database monitoring solutions to use with out-of-the-box reports, dashboards, and alerts.
- Opsview Measures 39 different metrics and features NOC-focused dashboards for MSPs and helpdesk teams.
- dbWatch Offers enterprise-level database monitoring for multiple platforms and network environments
The Best Tools for MariaDB Open-source Database Server Monitoring
Our methodology for selecting MariaDB monitoring tools
We reviewed various MariaDB monitoring tools and analyzed the options based on the following criteria:
- Accuracy and methods for performance monitoring
- Ease of use
- Amount of integrations and supporting features
- A facility to analyze network performance over time
- Graphical interpretation of data, such as charts and graphs
- A free trial period, a demo, or a money-back guarantee for no-risk assessment
- A good price that reflects value for money when compared to the functions offered
1. SolarWinds Database Performance Analyzer – FREE TRIAL
SolarWinds Database Performance Analyzer (DPA) is a SaaS platform that is designed to monitor a host of different database environments and offer a centralized view of database performance across multiple servers and network infrastructure.
Key features:
- Subscription-based cloud database monitoring
- Includes configuration monitoring
- Compatible with other databases alongside MariaDB
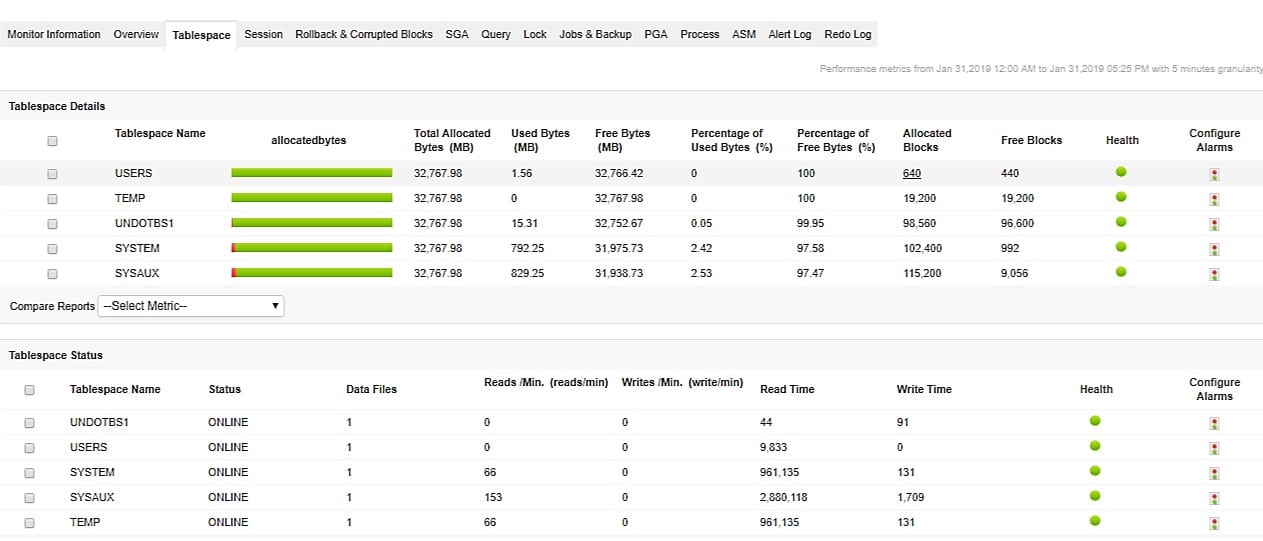
DPA collects metrics like CPU utilization, wait times, table sizes, and a number of other key metrics you’ll wish to track in your MariaDB environment. While performance can be tracked at a high level across multiple databases, it can also be narrowed down to give you a look at performance on a per-query basis. This helps monitor the database as a whole but also takes the time to perform optimizations and compare metrics before and after database changes.
SolarWinds DPA can also monitor and identify configuration changes or problems in MariaDB, helping cut down on time DBAs spend on hunting down misconfigurations, auditing changes, and troubleshooting issues in general. All insights are displayed through a customizable dashboard that can be changed and configured with modular widgets with a few clicks.
That platform has a host of integration options that all play nicely into other SolarWinds monitoring products, making this an even more powerful monitoring solution if you currently use SolarWinds in other areas of your network. At this time DPA can monitor around 10,000 different metrics for each database implementation. Like Site24x7, SolarWinds DPA works off a subscription-based model that can be subscribed to annually as well as monthly.
Pros:
- Highly intuitive DB management system tailored for medium to large size database implementations
- Monitors in real-time, offering a number of alert and notification options that can integrate into popular helpdesk solutions
- Threshold monitoring helps keep teams proactive, and fix issues before they impact performance
- Dashboards are highly customizable and be tailored to individuals or teams
- Built-in query analysis helps DBAs build more efficient queries
- Leverages machine learning to identify performance bottlenecks
Cons:
- Could benefit from a longer 30-day trial period
You can test out SolarWinds Database Performance Analyzer free through a 14-day trial.
2. Paessler PRTG Network Monitor – FREE TRIAL
The Paessler PRTG Network Monitor uses specialized sensors that are tailored to each environment, giving PRTG deep monitoring capabilities and additional insights that you sometimes don’t get with other general database monitoring systems.
PRTG is a good choice for MariaDB monitoring if you're a larger organization that is also looking to monitor additional databases, servers, or applications since the PRTG platform covers a wide variety of different monitoring needs.
Key features:
- Granular sensor configurations
- Database, server, and infrastructure monitoring
- Full suite of monitoring capabilities
Each sensor is tuned to monitor a particular metric. For example, a single sensor can monitor database size, while another sensor on the same server monitors database uptime. This allows organizations to granularly control exactly what they’re monitoring, and scale their monitoring in line with their current IT budget.
DBAs can combine MariaDB sensors with server and network monitors to provide a holistic view of the database, server environment, and supporting infrastructure. This level of monitoring is ideal for larger databases that want to measure availability and uptime, and need to pinpoint the source of slowness or outages. For example, if you deploy only database monitoring in a cloud-hosted environment you’ll have a limited view of how infrastructure outages impact your availability.
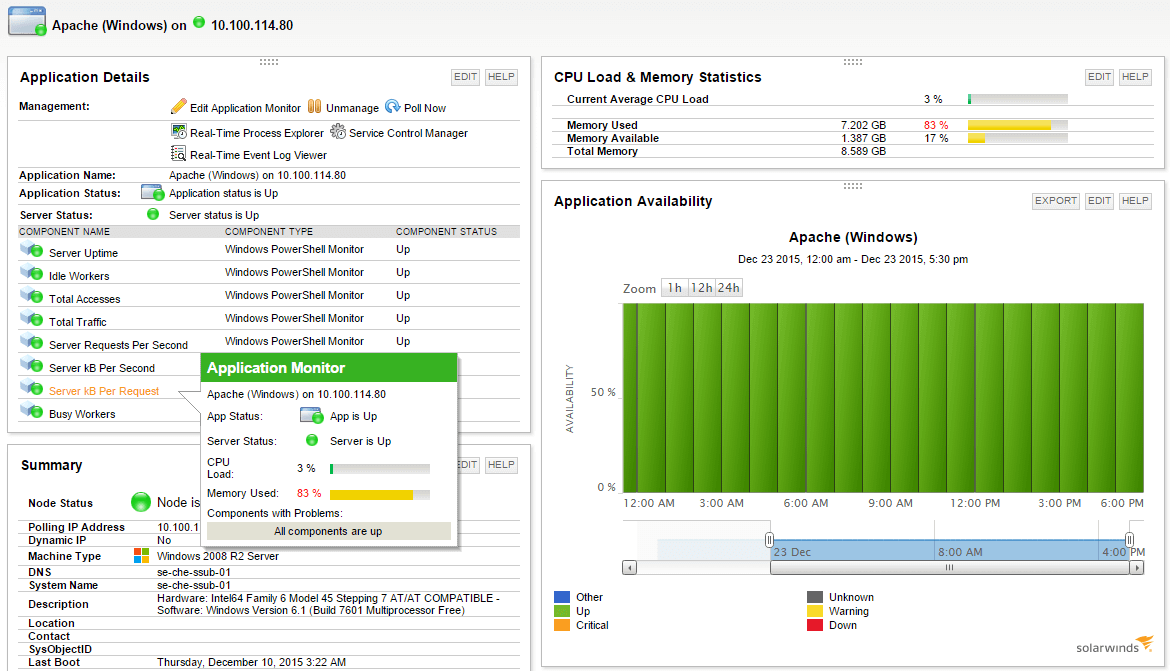
All metrics are pulled down into a simple yet informative dashboard that offers a number of premade visual gauges to give admins an at-a-glance look at the health of their MariaDB database.
Pros:
- Offers dozens of preconfigured sensors supporting multiple databases
- Full customizable dashboard is great for both lone administrators as well as NOC teams
- Drag and drop editor makes it easy to build custom views and reports
- Supports a wide range of alert mediums such as SMS, email, and third-party integrations into platforms like Slack
- Sensors can be customized, allowing you to only pull the metrics you want to monitor
- Supports a freeware version
Cons:
- Is a very comprehensive platform with many features and moving parts that require time to learn
Pricing for PRTG is highly dependent on the number of sensors you have deployed, so your total cost will correlate with how many servers you want to monitor, and how many metrics you wish to monitor on each database. Users are not charged for sensors they do not use, making this a budget-friendly way to scale monitoring across large networks.
Pricing for PTRG is divided into five tiers, starting with the PRTG 500 perpetual licensing package which includes 500 sensors for a single server installation for $1750. Packages scale in the number of sensors and offer unlimited sensors for $15500.
PRTG is available for testing through a free 30-day trial. After 30 days, your account will automatically be downgraded to the freeware version limiting you to 100 sensors.
3. ManageEngine Applications Manager – FREE TRIAL
ManageEngine Applications Manager is a software package that you can install on your server or on a cloud account. The system discovers and maps applications, which means software, middleware, and services. Among its monitoring capabilities, the tool will track activity on databases, including on MariaDB. The system can also monitor other DBMSs and even tracks different types simultaneously.
Key features:
- Live database activity
- Capacity forecasting
- Slow-running query analysis
Apart from MariaDB, this package will monitor MySQL, SQL Server, Oracle, PostgreSQL, Cassandra, Couchbase, MongoDB, and Redis. The system tracks all of the systems that access the database and examines the database objects in the contexts of the queries that run on them. This provides an opportunity to adjust the database objects, expand the database’s reserved resources, or rewrite queries to improve performance.
By linking together the applications to the resources that they need, the monitoring package can see when too many applications are launched and will result in all of them demanding the same resources at the same time. This provides predictive alerts that enable technicians to head off problems before they evolve.
It could be that you are expecting too much of your hardware. This tool is able to track the resources of servers running Windows and Linux and it also monitors services on AWS, Azure, and Oracle Cloud. It isn’t limited to monitoring the server on which the Applications manager is hosted be value it can operate across the network and the internet.
Pros:
- Predictive alerts for resource overloading
- Monitors databases on-premises and on the cloud
- Can provide an overview for a mix of DBMSs
- Customizable console screens
Cons:
- Not a SaaS package
Small businesses can access a Free edition of Applications Manager, which includes database monitoring but is limited to tracking five assets. If you want more capacity, you will need to look at the Professional edition, which is suitable for monitoring all of the applications on one site. A multi-site edition, called Enterprise is aimed at very large businesses.
The price for the Professional edition starts at $395 per year and the starting price for the Enterprise edition is $9,595 per year. The software for the Applications Manager can be installed on Windows Server, Linux, AWS, or Azure. The package is available for a 30-day free trial.
4. Site24x7

Site24x7 is a cloud-based monitoring service that covers a wide range of monitoring capabilities such as application performance monitoring, infrastructure monitoring, and database monitoring for MariaDB environments. The platform comes with multiple monitoring sensors that can work to monitor your MariaDB, the server it’s hosted on, and the network infrastructure that supports that server. This top-down approach to monitoring gives you a comprehensive view of all the factors that could impact the availability and performance of your MariaDB database.
Key features:
- Flexible pricing options
- Full monitoring suite
- Cloud-based monitoring platform
Monitoring is done through small lightweight agents that can be deployed directly on the server or launched on its own VM for monitoring across cloud, on-premises, and multi-cloud networks. If you manage multiple databases alongside your MariaDB environment, you can use the plugin library to find integrations for your other server or databases, allowing you to centralize your monitoring efforts.
Site24x7 comes with preconfigured dashboards that immediately start interpreting data as it’s being collected live. Outside of your basic database health metrics, Site24x7 offers tools to help with capacity planning, migrations, and detailed troubleshooting insights for DevOps teams. Recently the platform has begun proactive database optimization, offering intelligence best practice reports and performance optimization tips.
Robust alerting can be configured to help alert sysadmins via email, third-party app, or text. API integrations can also tap into help desk software to automatically create tickets with preselected metrics like severity and priority. Lastly, IT Automation can be deployed to automatically restart services, run database queries, or execute scripts when certain conditions are met, or thresholds are exceeded.
Pros:
- Flexible cloud-based monitoring option
- Offers a host of out-of-box monitoring options and dashboard templates
- Allows administrators to view dependencies within the application stack, good for building SLAs and optimizing uptime
- Offers root cause analysis enhanced by AI to fix technical issues faster
Cons:
- Site24x7 is a feature rich platform with option that extended beyond databases management, may require time to learn all options and features
Pricing for Site2x7 is flexible, making it a viable option for both large and small organizations who want to monitor their databases more efficiently. There are four pricing tiers that offer all-in-one options for database monitoring, log collection, and monitoring capabilities.
Server monitoring starts at just $9.00 per month when paid annually and includes 500MB of logs, monitoring across 10 servers, and one plugin for free per server. All upgrades or add-ons are modular, meaning you can choose exactly what extra features you want to pay for ensuring you’ll never pay for features you don’t use.
You can test out Site24x7 in your MariaDB environment for free through a 30-day free trial.
5. Datadog
Datadog is an intuitive cloud-based monitoring platform that is designed to do all the heavy lifting most monitoring software leaves for the admins to deal with like setting up alerts and building dashboards. The platform works to make monitoring your database as box-of-box as possible, providing report templates, pre-made alerts, and pre-configured dashboards that start working as soon as the agent has been installed.
Key features:
- DevOps-focused troubleshooting tools
- Out-of-the-box reports, alerts, and dashboards
- Simple pricing structure.
You can monitor your databases in the cloud, on-premises, or even in a hybrid cloud environment to centralize the metrics across all areas into a single place for monitoring. A wide range of integrations offer monitoring capabilities into vendor-specific environments and allow you to easily port over different metrics or alerts to third-party software in just a few clicks.
Like our previous tools, Datadog can provide a holistic look at the entire environment by offering monitoring across your MariaDB, network infrastructure, and the hardware resources of the host the database is running on. The dashboard templates allow you to cycle through views easily, so you can toggle between database-specific metrics, and then back to a top-down look of the health of the entire network environment.
The platform offers detailed tools for advanced troubleshooting and live trace analysis, striking a solid balance between proactive and reactive monitoring tools. For example, a live service map gives devs the opportunity to explore inter-dependencies and visualize bottlenecks in real-time.
Pros:
- Excellent graphic options for monitoring multiple metrics
- Highly customizable dashboards, great for NOC teams
- Cloud-based monitoring, can be accessible from anywhere
- 400+ integrations can support nearly any database deployment
Cons:
- Would like to see a longer trial period
Datadog is a SaaS product, so billing takes place either monthly or annually. The APM capabilities package for Datadog starts at $31.00 per month when billed annually and includes 15 months of metrics retention plus live and historical search analytics.
You can test out Datadog monitoring for your MariaDB database free through a 14-day trial.
6. Opsview
Opsview offers monitoring across multiple different databases, server environments, and network infrastructure. The platform can monitor over 39 metrics specific to MariaDB through the MariaDB Opspack, which is essentially a custom integration for that database type.
Key features:
- Over 39 different database metrics collected
- NOC focused dashboards
- Live process maps
The platform runs a number of different service checks such as error rate, connections, bytes sent, aborted connections, key requests, and a host of other process and service-related metrics. The platform uses a number of core features as well as add-ons that enhance the monitoring experience.
Autodiscovery work to pull in real-time database metrics live, and detect new database changes as well as the presence of any new hardware or network changes that occur when monitoring all layers of the infrastructure supporting your MariaDB database.
The dashboards are built to be customizable and work well in a NOC environment where visualizations and key insights need to be made clear at a glance. Different tabs allow you to cycle through a number of different pre-built dashboards and can be put on an interval to cycle automatically. Everything from a reporting and dashboard perspective is done through widgets which makes the setup and configuration part of monitoring simple.
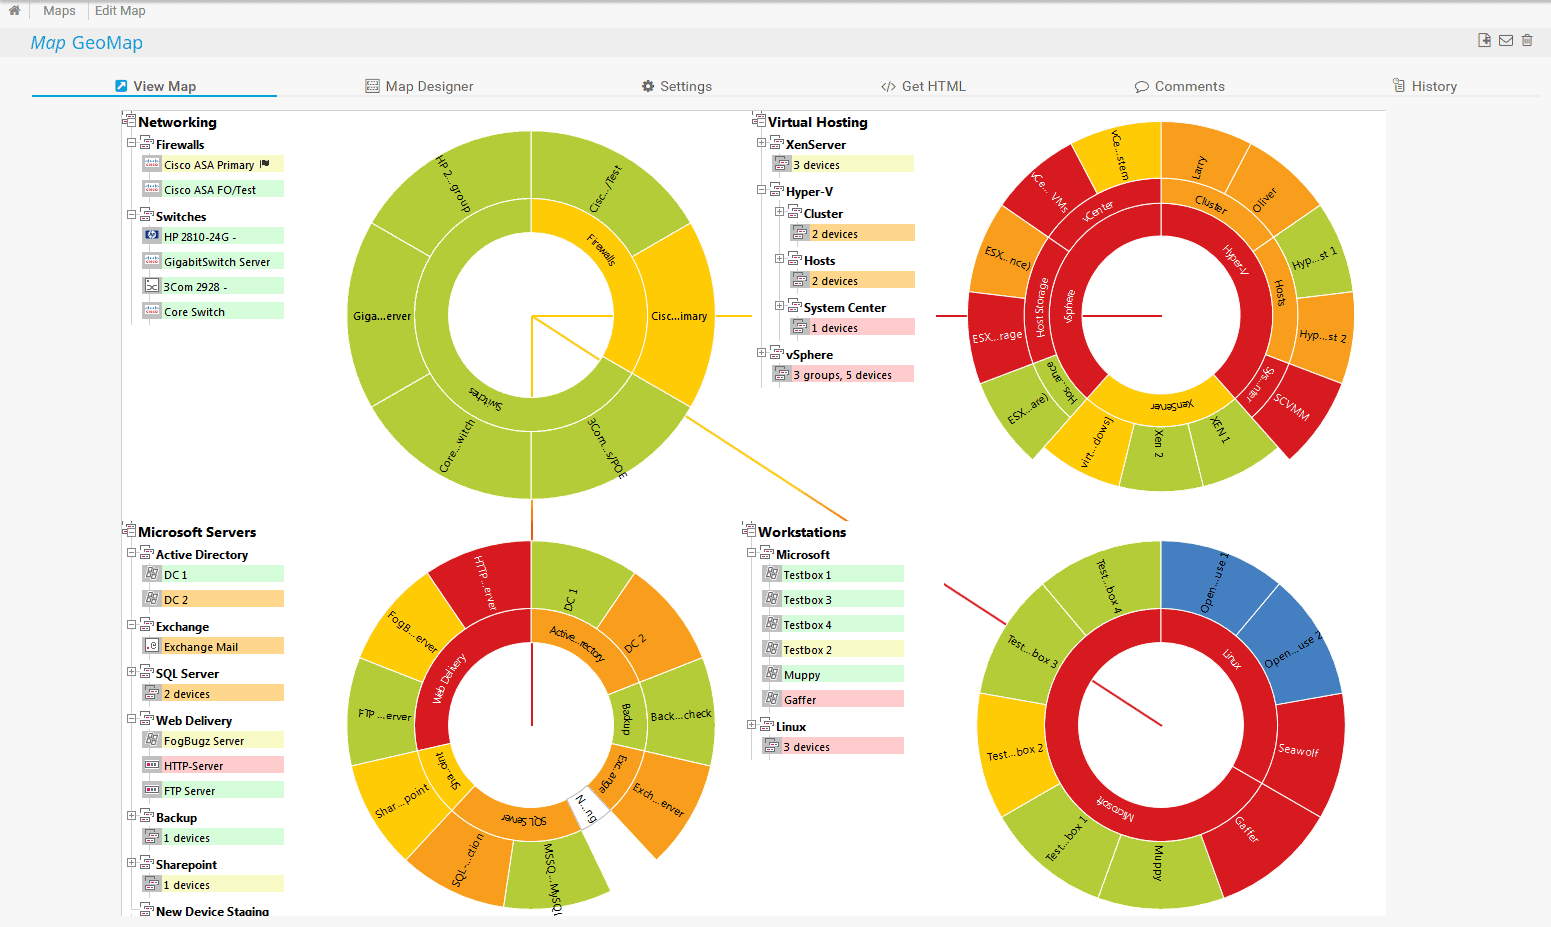
Process maps are also available for larger MariaDB environments to help teams visualize the who, what, and where of how their database resources are being utilized. This live map can help with capacity planning as well as setting priorities for exactly what parts of the database will be optimized to have the most impact.
Pros:
- Supports over 39 different monitoring metrics
- NOC and MSP focused tools and features
- Clean, easy-to-use interface
- Supports a free and paid version
Cons:
- Non-MSPs can’t take advantage of the multitenant tools
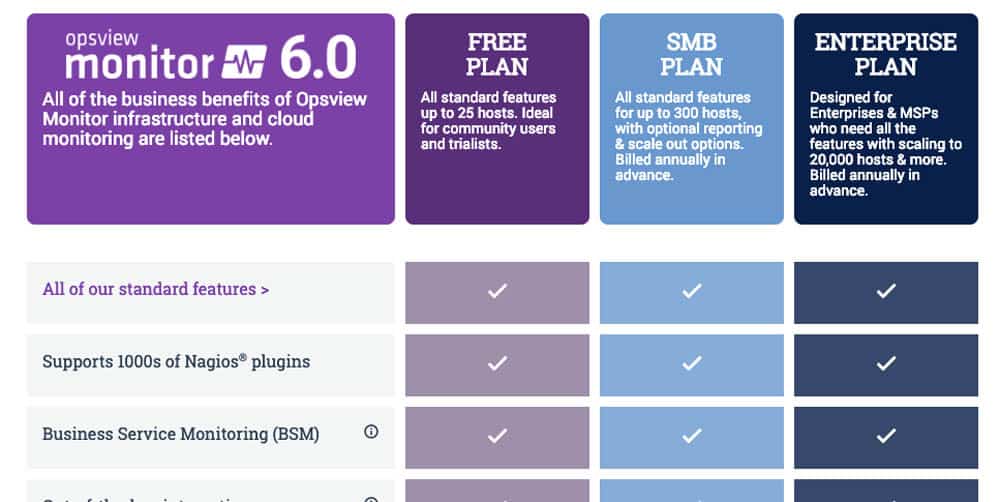
Pricing for Opsview is available in three different tiers, Opsview Cloud, Enterprise, and SMB. The SMB tier offers six-month and one-year subscription plans for organizations with less than 300 hosts for $1300 annually. The other two tiers do not publicly display their pricing plans.
You can test out the Opsview platform for yourself through a free trial.
7. dbWatch
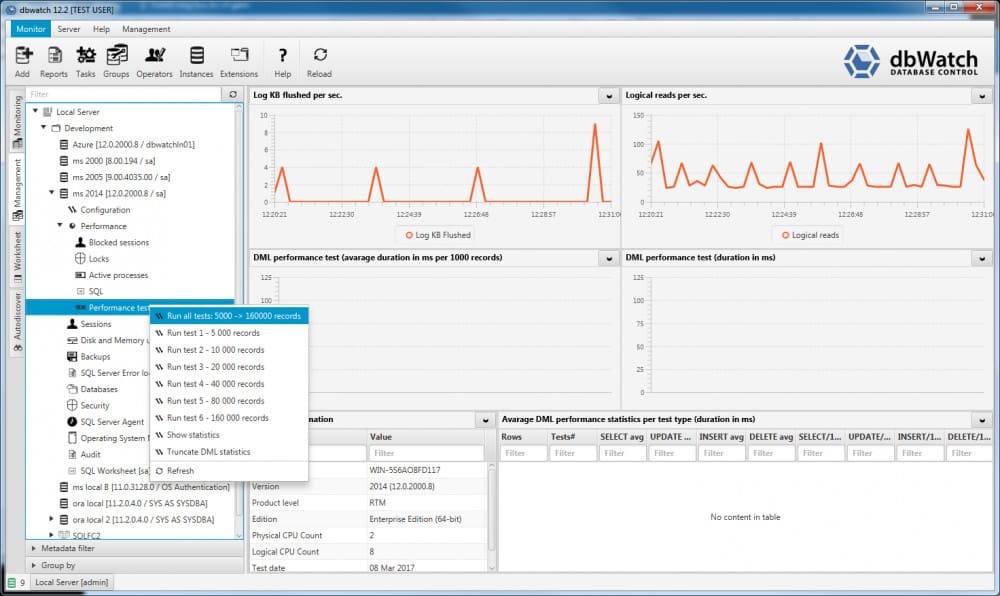
dbWatch is a platform dedicated to monitoring database performance and health no matter what platform or network environment those databases exist on. The dbWatch monitoring tools and features benefit larger database environments that may have more than one database server in the cloud or on-premises.
Key features:
- Enterprise focused
- Volume-based pricing
- Database cluster monitoring
From a single location, you’ll be able to view all of your instances providing a clear look at your overall performance and health across your database farm. This helps larger organizations eliminate the need for multiple logins to different monitors, and toggling of dashboards to rotate between views across multiple servers.
The monitors scale well and can support a few instances up to a few thousand across multi-network and cross-platform services. DbWatch specializes in providing fast ROI for larger enterprise databases by using out-of-the-box integrations, dashboards, and reports.
Pros:
- Supports multiple database types including cloud-based databases like Azure SQL
- Good option for businesses that have a large amount of SQL servers in operation
- Can proactively alert based on set thresholds
- Available cross platform on Windows, Linux, and Mac
Cons:
- Minimum license requirement of 10, not for small businesses
Pricing is currently not publicly available, however, they state that they do offer volume-based discounts as well as a free 30-day trial.
Choosing the right tool for MariaDB monitoring
We’ve narrowed down the best monitoring tool for MariaDB databases, but which is best for you?
For any sized organization, Site24x7 is going to offer the best cloud-based monitoring solution that focuses on speeding up the onboarding process and providing useful database insights as fast as possible.
For organizations that are looking to possibly expand their monitoring efforts into other areas of their network, PRTG has customizable sensors and configurations that allow for precise control over what metrics are being monitored, and what sensors you pay for.
Lastly, for extremely large enterprise-level data centers, dbWatch offers monitoring tailored to multi-site and cluster database configurations.
Do you monitor your MariaDB server? If so, what issues have you run into? Let us know in the comments below.
MariaDB Monitoring Tools FAQs
How often should I perform MariaDB monitoring?
The frequency of MariaDB monitoring depends on the specific requirements of your environment and the size and complexity of the database being monitored. In general, it is recommended to perform regular monitoring on an ongoing basis to ensure that the database is running optimally and to identify and resolve issues as they arise.
What should I do if I encounter a performance or availability issue with a MariaDB database?
If you encounter a performance or availability issue with a MariaDB database, the first step is to gather information about the issue and the environment, including resource utilization and query performance. You can then use this information to identify the root cause of the issue and take appropriate action, such as optimizing queries, reconfiguring the database, or adding additional resources. If the issue cannot be resolved, you may need to seek additional support from the MariaDB community or a third-party vendor.
What is the difference between MariaDB and MySQL monitoring?
MariaDB and MySQL monitoring are similar in many ways, as both involve monitoring the performance and availability of a database. The key difference between the two is the database management system being monitored: MariaDB is a community-driven fork of the MySQL database management system, while MySQL is a commercial product owned by Oracle.
How do I monitor MariaDB performance?
MariaDB performance can be monitored by collecting and analyzing data about the utilization of key database resources, such as CPU, memory, and disk I/O. This data can be collected using tools such as MariaDB Enterprise Monitor, Nagios, or Datadog.

