
Our funding comes from our readers, and we may earn a commission if you make a purchase through the links on our website.
The Best Mainframe Monitoring Tools
UPDATED: January 30, 2024
Mainframe monitoring is an entirely different ball game. Mainframes process high volumes of transactions and input/output operations in parallel and exceptionally quickly, and they usually serve mission-critical applications.
Organizations that invest in mainframes can’t afford to lose these machines’ valuable output and resources. An underutilized mainframe can turn out as a complete waste of money. So, mainframes must run at their peak performance; they need to be continuously and fully operational during business hours and, in most cases, running 24/7.
In this post, we’ll go through the eight best mainframe monitoring tools. With these tools, system admins should be able to continuously monitor the performance and health of a mainframe and its influence on the services and applications.
Here is our list of the best mainframe monitoring tools:
- IntelliMagic Vision for z/OS – EDITOR’S CHOICE This system will monitor your z Series IBM mainframe. It covers both hardware and software and provides alerts when problems are detected. Run it on your z/OS system or access it as a SaaS package. Access a free demo & quote.
- Datadog Infrastructure Monitoring A cloud-based observability solution with infrastructure monitoring, APM, logs management, and more. It integrates with z/IRIS software for expanded mainframe observability.
- Dynatrace Complete observability, intelligent monitoring, and automation platform capable of monitoring IBM z mainframe.
- AppDynamics by Cisco A leader full-stack observability platform that integrates with z/OS IBM z “APM Connect”.
- Pandora FMS Enterprise An all-in-one monitoring solution that uses a z/OS plugin to collect mainframe data.
- Broadcom’s CA Mainframe software A leader in mainframe operations management solutions, Broadcom provides SYSVIEW to monitor and manage various mainframe subsystems.
- Splunk Enterprise Provides organizations with observability, security, and business intelligence. It integrates with Syncsort Ironstream to monitor mainframe sources.
- BMC Automated Mainframe Intelligence (AMI) A leader in mainframe solutions, BMC AMI, provides automated intelligence to monitor the performance of z/OS mainframes.
- Instana By IBM, is an APM platform with automated, context, and actionable enterprise observability. It integrates with z/OS, db2, CISCS, and more.
The Best Mainframe Monitoring Tools
Our methodology for selecting mainframe monitoring tools
We reviewed various mainframe monitoring tools and analyzed the options based on the following criteria:
- Support for continuous monitoring and automated recovery
- Integrations with other monitoring platforms
- A facility to analyze mainframe performance over time
- Graphical interpretation of data, such as charts and graphs
- A free trial period, a demo, or a money-back guarantee for no-risk assessment
- A good price that reflects value for money when compared to the functions offered
1. IntelliMagic Vision for z/OS – GET DEMO
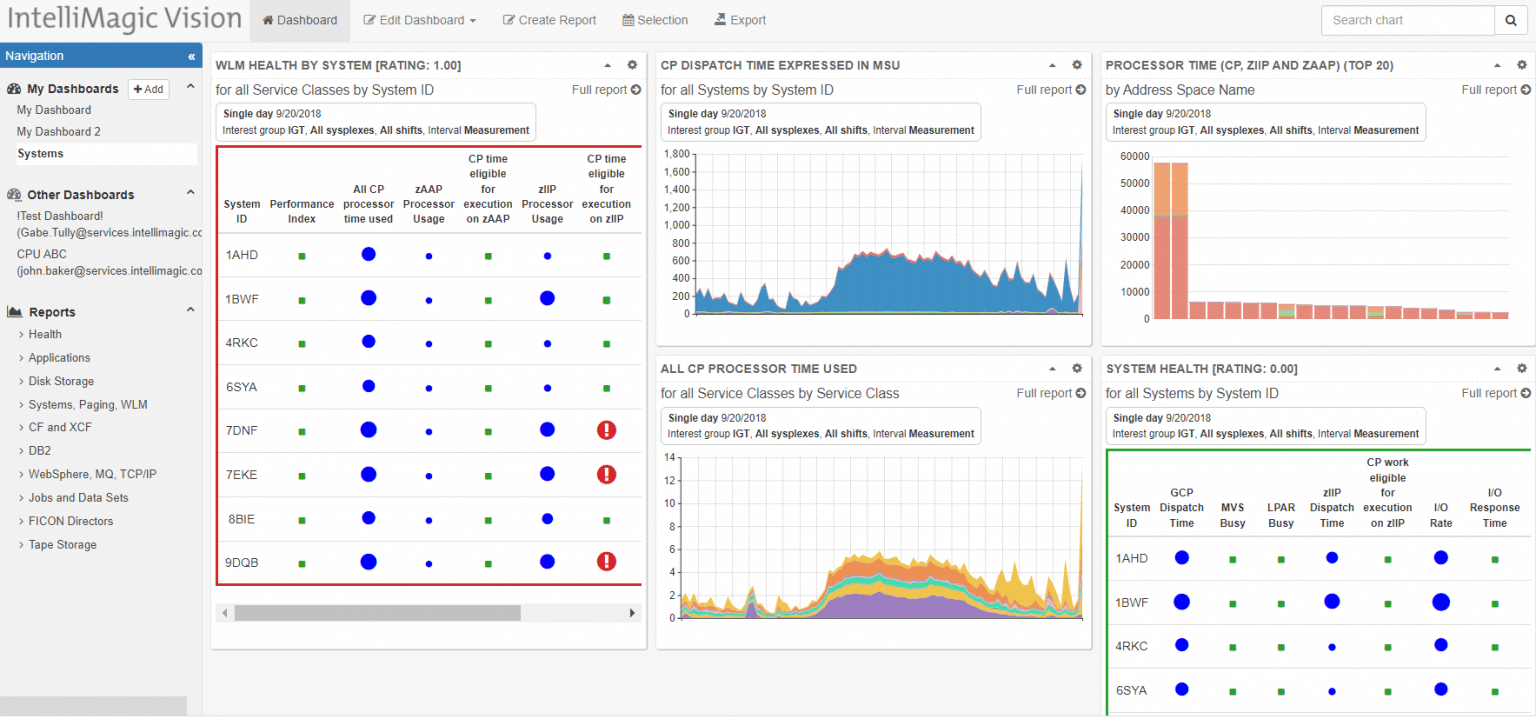
IntelliMagic Vision for z/OS is an adaptable monitoring platform for IBM z Series mainframes. The package is able to monitor the hardware as it operates and the software that runs on a mainframe. You can customize the dashboard so the exact system features that the package tracks is up to you. It is also possible to choose the format in which each metric is displayed.
Key Features
- Tracks each z/OS resource
- Links processes to resources
- Identifies resource shortages
- Forecasts resource demand
- Provides performance tuning tools
Pros:
- Anomaly detection and statistical analysis
- AI-based processes to forecast upcoming resource demand
- Analysis of SMF data
- Adjustable performance expectation thresholds that trigger alerts
- Covers DB2, CICS, and MQ
Cons:
- Doesn’t cross over into monitoring for other platforms
Although this system is limited to tracking IBM z/OS mainframes, it can also watch network activity by monitoring its own network card for network traffic. The mainframe creates its own TCP/IP “network traffic” to move data between components and these are also monitored.
Licensing and Pricing: IntelliMagic doesn’t publish a price list.
How to start? Begin your investigation by registering for a free demo and quote of IntelliMagic Vision for z/OS
EDITOR'S CHOICE
IntelliMagic Vision for z/OS is our top pick for mainframe monitoring. This package is very flexible and you decide which of the systems of the z/OS platform you want to focus on. The IntelliMagic Vision system is designed to track all of the major, important components of the mainframe and also the software that runs on the mainframes. You can collect your own widgets into a screen and adjust alert thresholds or turn them off. This is one of the few tools that was specifically designed to monitor the z/OS operating system rather than relying on a third-party server to read SNMP reports from an IBM mainframe.
Download: Get a FREE Demo
Official Site: https://www.intellimagic.com/contact/request-demo-zos/
OS: z/OS or cloud
2. Datadog Infrastructure Monitoring
Datadog is a SaaS-based observability solution. The cloud-based services range from infrastructure monitoring, APM, cloud monitoring, logs management, security, digital experience, and more. Datadog’s infrastructure monitoring platform allows system admins to keep track of servers, including mainframes and their resources. Datadog was named a Leader in Gartner’s 2021 MQ (Magic Quadrant) for APMs.
Key Features
- Integrate z/IRIS traces and metrics with Datadog.
- Monitor mainframe services and calls with mainframe traces.
- Additional dashboards for REST API and JDBC data.
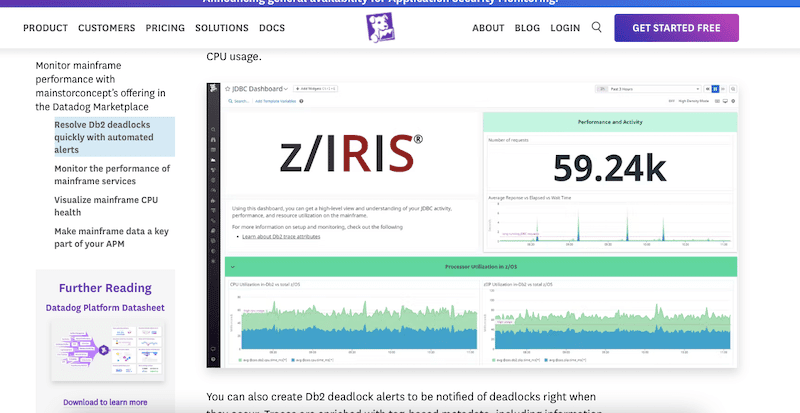
- z/IRIS tracks JDBC data processed by Db2, allowing Db2 deadlock alerts.
- Flame graphs to display information on mainframe performance and services.
Pros:
- Has an excellent interface, easy to use, and highly customizable
- Cloud-based SaaS product allows monitoring with no server deployments or onboarding costs
- Can monitor both internally and externally giving network admins a holistic view of network performance and accessibility
- Supports auto-discovery that builds network topology maps on the fly
- Changes made to the network are reflected in near real-time
- Allows businesses to scale their monitoring efforts reliably through flexible pricing options
Cons:
- Would like to see a longer trial period for testing
The Datadog Infrastructure Monitoring solution can be expanded to monitor IBM z series mainframes. The Mainstorconcept’s z/IRIS software is a mainframe observability plug-in explicitly built to provide performance monitoring mainframe data to third-party tools. z/IRIS provides IBM z/OS mainframe observability data (with OpenTelemetry) to the Datadog infrastructure monitoring solution. It provides access to vital infrastructure metrics, error messages, and alerts so that you can evaluate your mainframe’s health and its impact on apps and services. The z/IRIS solution is available in Datadog’s Marketplace.
Licensing and Pricing. Free ($0), Pro ($15 per/host per/month), and Enterprise ($23 per/host per/month).
How to start? Sign up for a 14-days free trial of Datadog.
3. Dynatrace
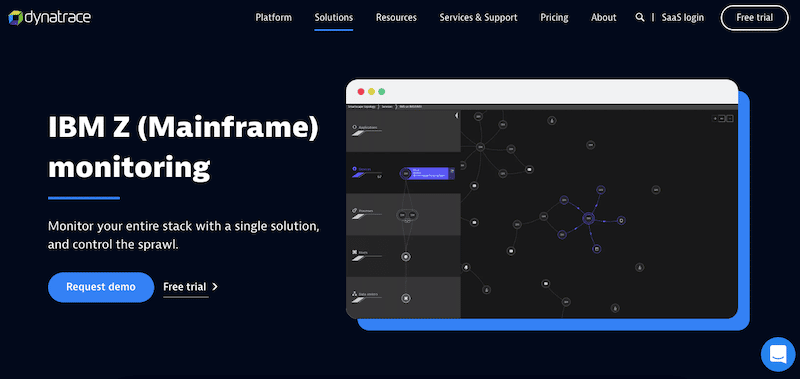
Dynatrace is all-in-one observability, AIOps, automation, and intelligence monitoring platform. It automatically discovers, maps, and monitors the entire stack. Dynatrace provides insights into the app’s performance, its underlying infrastructure, and user experience, leveraging its AI causation engine (Davis) and automation capabilities. The Dynatrace offering has been named a leader in 2021 in Gartner’s MQ for APM.
Key Features
- See the (host) physical mainframe or logical partitions.
- Dynatrace z/OS agents use Dynatrace AI and automated analysis.
- Trace every service call and transaction in the mainframe.
- Get code-level visibility into IBM CISC and IMS service.
- Monitor DB statements made to DB2 and DL/I.
Pros:
- Highly visual and customizable dashboards, excellent for enterprise NOCs
- Operates in the cloud, allowing it to be platform-independent
- Leverages AI to provide baseline analysis and detect user behavior anomalies
Cons:
- Designed specifically for large networks, smaller organizations may find the product overwhelming
Dynatrace is one of the best mainframe monitoring tools that allow IBM z monitoring. You can install Dynatrace’s OneAgent, which is responsible for collecting all monitoring mainframe data on z/OS-based IBM z mainframe platforms and achieving observability. The OneAgent for z/OS comes in five different modules, the z/OS Data Collection subsystem (zDC), zRemote, and Java code, CICS code, IMS code modules.
Licensing and Pricing: Relevant licenses are: Infrastructure monitoring (which starts at $22/month) and Full-stack monitoring (which starts at $74/month); Both allow a maximum of eight GB per host and are billed annually.
How to start? Register to Dynatrace to get a 15-days free trial.
4. AppDynamics
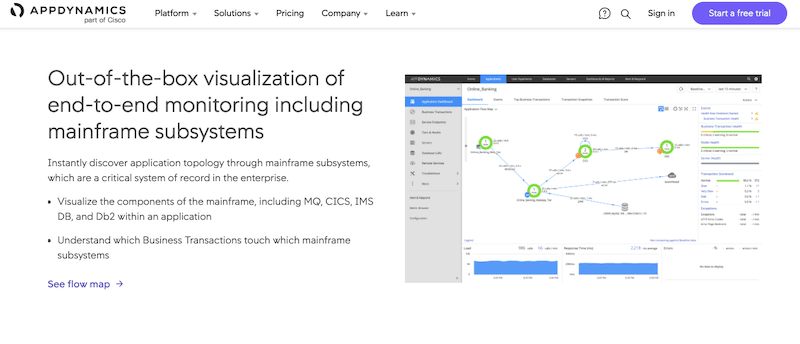
AppDynamics by Cisco is another leader in APM and full-stack observability platforms. Its product allows systems admins to monitor the entire stack, including business, users, applications, infrastructure, network, and security. Cisco’s AppDynamic is also a leader in the APM market, according to Gartner’s 2021 APM Magic Quadrant.
Key Features
- Discover z/OS-based components, and monitor transactions with low overhead.
- Out-of-the-box visualization for mainframe subsystems.
- Visualize mainframe components, including MQ, CICS, IMS DB, and Db2.
- Find out which business transactions are linked to which subsystems.
Pros:
- Tailored for large-scale enterprise use
- Excellent dependency mapping and visualizations to help troubleshoot complex application systems
- Includes a fully functional free version
Cons:
- Can have a steeper learning curve than similar tools
AppDynamics is a fantastic z/OS mainframe monitoring tool. It improves the visibility of your mainframe’s applications by integrating with z/OS-based IBM z APM (Application Performance Management) Connect. IBM z Connect is implemented on z/OS to collect transaction tracking mainframe data from vital z/OS subsystems. This solution works on-premises and via SaaS-based tools.
Licensing and Pricing: Infrastructure Monitoring Edition ($6/month /CPU Core), Premium Edition ($19/month /CPU Core) including APM, Enterprise Edition ($90/month /CPU Core) including APM.
How to start? Sign up to AppDynamics to get a 15-day trial.
5. Pandora FMS Enterprise
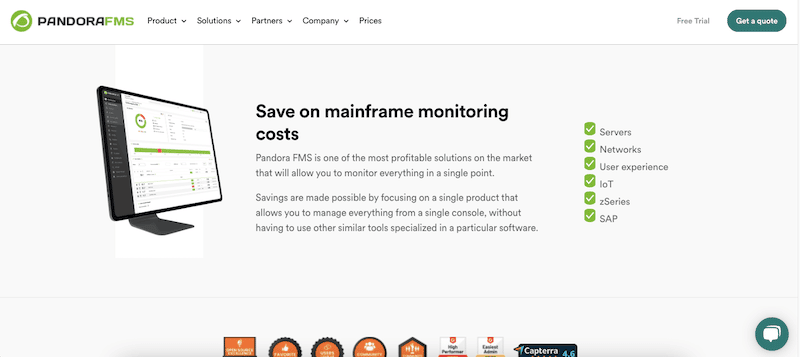
Pandora Flexible Monitoring System (FMS) is an all-in-one visual monitoring solution for APM, virtual, remote control, synthetic, UEM, IoT, logs, network, and of course, mainframes. The Pandora FMS Enterprise edition is an excellent mainframe monitoring tool because it collects and displays information from z/OS systems from a single platform.
Key Features
- Pandora FMS for z/OS allows you to automate actions and send reports.
- The tool uses IBM built-in Dataportal RMF Monitor to extract data.
- Integrate mainframe monitoring and other resources under a single view.
To monitor a mainframe using Pandora FMS, you don’t need to install any agent on the mainframe. Pandora FMS z/OS uses a plugin that collects mainframe data through HTTP requests to the RMF Data Portal monitor. The Pandora FMS z/OS’s plugin extracts mainframe data from sources like Sysplex, LPAR, or others.
Pros:
- Works alongside Pandora NMS for additional address management functionality
- Supports patch management, making it a more complete tool than other managers
- Can group LANs with other non-VPN WANs into a single group for easier management
- Open-source with paid version
Cons:
- Outdated interface, visualizations are lacking and nested menus can be overwhelming at scale
Licensing and Pricing: The Pandora FMS z/OS monitoring is only available with the Enterprise edition. Contact Pandora FMS to get a quote.
How to start? Get a cloud-based fully-functional Pandora FMS Enterprise trial for 30 days.
6. Broadcom’s CA Mainframe software
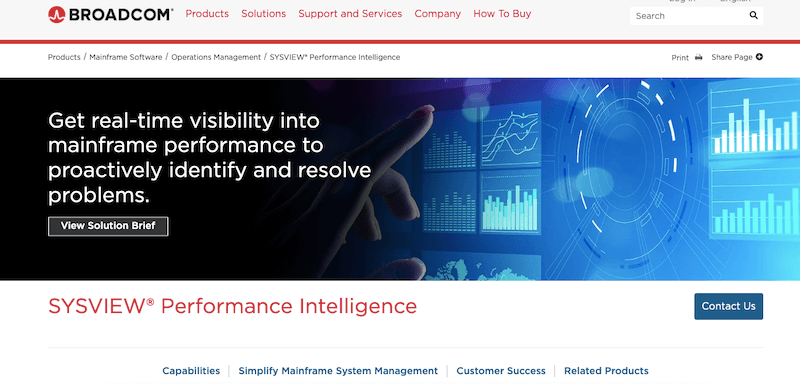
Broadcom offers a variety of mainframe operations management solutions. One of these tools is Broadcom's SYSVIEW Performance Intelligence, which provides real-time visibility into your mainframe's performance and health. Broadcom SYSVIEW breaks down silos and allows access to mainframe data across different environments using secure and open APIs. The tool enables you to monitor and manage mainframe subsystems, including z/OS, JES, Unix System Services, CICS, CTG, z/OS Connect, MQ, and IMS.
Key Features
- Map hardware assets within your mainframe environment.
- Discover applications deployed in your mainframes.
- Monitor z/OS, JES, CICS, CTG, z/OS Connect, etc.
- Monitor mainframe's databases and TCP/IP layer.
- Evaluate the state of your Db2 deployments with a db2 report for z/OS.
Broadcom also provides a Mainframe testing and quality tool so that DevOps teams can perform continuous testing in mainframe applications and simplify app analysis with visual debugging. Another mainframe monitoring tool is Broadcom's Workload Automation, which proactively monitors and manages enterprise workloads running on mainframes.
Pros:
- Designed specifically for more complex enterprise environments
- Supports multi-cloud automation and ERP frameworks
- Offers automation tools designed for developers (great for in-house dev teams)
Cons:
- Not the best fit for smaller organizations
Licensing and Pricing: Base ($5000 per site, including hardware, software, and health mainframe monitoring), Db2 report for z/OS ($7500 per site); for more pricing information, consult with Broadcom.
How to start? Contact Broadcom's mainframe software division to learn how to get started.
7. Splunk Enterprise
Splunk is “the one” data platform for all your security and observability needs. The platform integrates with virtually anything, including public clouds, apps, services, on-prem data centers, third-party tools, and edge tools, and collects their logs, metrics, and traces. The Splunk collection mechanisms deliver unified security and full-stack observability to a single place.
Key Features
- Ironstream is lightweight, non-intrusive, fast, and secure.
- With Syncsort Ironstream integration, you can collect data from different z/OS sources.
- Forward real-time mainframe data to the Splunk Analytics platform.
- Security monitoring via Mainframe Integration with Splunk Enterprise Security for z/OS.
Pros:
- Uses excellent visuals to display collected data and insights
- Supports a multitude of environments for data collection
- Uses machine learning to identify new data sources and monitor behavior
- Caters to enterprises with excellent support and a wide range of integrations
Cons:
- Many features and services cater to large enterprise networks
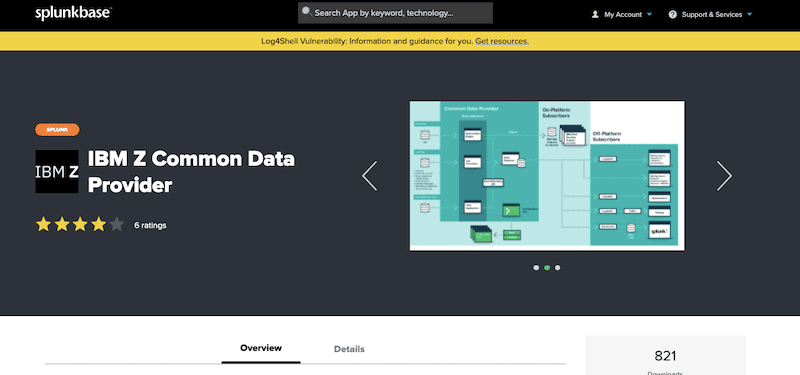
Splunk makes it a fantastic mainframe monitoring tool because it provides flexibility, as there are many ways to send mainframe data to Splunk Enterprise. The first way is using the IBM Common Data Provider for z Systems Data Receiver (which is deployed on the same system where Splunk Enterprise is). The second way is using the HTTP Event Collector (HEC) functions on Splunk, which is easier but more resource-intensive. The third and most popular way is using the third-party tool Syncsort Ironstream, which integrates security and operational machine data from different mainframe sources right into Splunk.
Licensing and Pricing: The cloud-based observability price starts at $65 per host/month, billed annually. For more information on the Splunk Enterprise platform, contact Splunk.
How to start? Splunk offers a free trial for 14 days.
8. BMC Automated Mainframe Intelligence (AMI)
BMC started initially around 1980 as a specialty software developer for IBM mainframes. But later, BMC started to create software for managing, automating, and monitoring mainframes (along with distributed systems). Now, BMC develops software for the autonomous digital enterprise, creating products for automation, service management, DevOps, AIOps, security, and orchestration.
Key Features
- Collect broad IBM z/OS-based operational metrics from many sources.
- Get actionable insights with AI/ML mainframe monitoring.
- Predict outages before they occur.
- Solve mainframe’s performance bottlenecks and degradations.
- Extend AMI for security management, DevOps, performance, and availability.
BMC provides a robust mainframe monitoring tool for enterprises, known as the Automated Mainframe Intelligence (AMI)— an entire product line. BMC’s AMI uses automated intelligence to measure and improve the performance of z/OS-based mainframes. It relies on Machine Learning (ML) technology to improve the management of your mainframes by sending alarms and taking actions without manual intervention.
Pros:
- Simple yet intuitive interface
- Can automated security tasks such as vulnerability scans, and automated network probes
- Designed for larger environments with multiple mainframes and larger clusters
- Can automate configuration restoration
Cons:
- Better suited for larger networks, especially those with in-house remediation teams
Licensing and Pricing. Request a price quote.
How to start? Try a free 14-days BMC AMI Security trial.
9. Instana
Instana, by IBM, is a native APM platform that provides automated, context, and actionable enterprise-level observability. The platform can help monitor hybrid and multi-cloud environments with its full-stack cloud and infrastructure monitoring. The recent acquisition of Instana by IBM (2021) brought powerful observability capabilities into IBM, including a collection of application traces, logs, metrics, dependencies, automated instrumentation, and AI-based analysis— all a perfect fit for mainframe monitoring.
Key Features
- z/OS monitoring and performance management.
- Supports IBM MQ, IBM AACE, IBM DataPower, IBM API Connect, and more.
- z/OS is part of the cloud-native application monitoring solution.
- Supports automatic microservices monitoring.
Today, Instana is one of the best mainframe monitoring tools, mainly because of its broad support for IBM technologies. Instana APM for z/OS introduced IBM observability especially to help eliminate the infamous IBM z blind spot. In addition, Instana integrates IBM technologies, including z/OS, db2 on IBM z, Linux and IBM z, zHMC, CICS, and IMS.
Pros:
- Ideal for monitoring microservices and cloud apps
- Designed with enterprise teams and operations in mind
- Offers a wide variety of integrations and support
Cons:
- Better suited for enterprise companies that rely on cloud services
Licensing and Pricing. The price starts at $75 per host/per month and is billed annually.
How to start? Sign up to Instana and get a 14-day free trial.
The Challenges of Mainframe Monitoring
Mainframe vendors usually ship their mainframes with built-in OS-native monitoring systems and onboard hardware sensors to keep track of the entire mainframe. But these onboard sensors and OS-native monitoring systems are bound to keep track of the single mainframe.
When monitoring multiple mainframes, it can be challenging and complex to keep track of every single component in all mainframes. In addition, It can also be challenging to manage and monitor services that extend beyond a mainframe and across multiple environments. Without the flexibility, IT organizations can quickly become siloed.
Mainframe Monitoring Tools FAQs
What to look for in a Mainframe Monitoring Tool?
To solve most of the challenges mentioned above, today’s mainframe monitoring tools come as solutions from observability or APM platforms. These platforms extend monitoring (and management) across multiple environments, from mobile devices and mainframes to multi and hybrid clouds.
Examples are observability plug-in solutions such as the z/IRIS, which integrates your mainframe’s z/OS client to an observability tool like Datadog. Integrating your mainframe to such tools allows DevOps access to valuable insights and added visibility into the mainframe systems. DevOps and IT teams will know how mainframe systems perform for all their business applications and their availability.
Look for the following:
- Support the traditional mainframe components A mainframe monitoring tool must be capable of integrating to IBM z/OS and monitoring its subsystems, including IBM Customer Information Control System (CICS) or DB2. For example, Datadog, Instana, Dynatrace, and AppDynamics provide fantastic integration.
- Real-time monitoring A real-time monitor should keep track of the processor, memory, and I/O on a foundation level. Real-time monitoring may include automation to help the system watch thresholds and events and react. Real-time monitoring allows admins to diagnose and detect immediate problems but can impact the mainframe’s performance with added overhead (if misconfigured).
- Post-processor monitoring Some mainframe monitoring tools can process and analyze large amounts of mainframe data after the fact. These monitors help keep track of trends, capacity planning, demand analytics, or data summaries.
- Monitor applications and how they are delivered IT admins or DevOps teams need to know how their mainframe is performing for their business applications to keep up high availability. Mainframe monitoring tools can help keep track of mainframe traces (calls and services) and metrics. They can also track transactions and DB statements. Collect transaction mainframe data from vital z/OS subsystems.
- Agent vs. agentless Running an agent on a mainframe may introduce overhead and wasted resources. So mainframe agents must be lightweight and unobtrusive. Agentless methods (such as SNMP or HTTP) can help with easier monitoring but may also introduce some overhead on the network. Dynatrace uses a lightweight OneAgent, whereas Pandora FMS does not.
What are some common add-ons and extensions for Mainframe systems?
- IBM CICS (Customer Information Control System)
- IBM DB2 (Database 2)
- IBM MQ (Message Queueing)
- IBM IMS (Information Management System)
How can I view Mainframe Monitoring data remotely?
Mainframe Monitoring data can be viewed remotely using tools such as IBM's OMEGAMON, which provides a web-based interface for accessing performance data and metrics.
What are some common metrics to monitor for Mainframe systems?
- CPU utilization
- Memory usage
- Disk I/O and throughput
- Network traffic
- Transaction response time

