
Our funding comes from our readers, and we may earn a commission if you make a purchase through the links on our website.
The Best Tools For JMX Monitoring
UPDATED: January 2, 2024
What is JMX?
Java Management Extensions (JMX) is a Java technology that includes tools for monitoring and managing system objects, applications, and service-oriented networks. The resources are represented by objects called MBeans (Managed Beans).
SINCE ITS INCEPTION, the JMX Framework was introduced in Java 1.5 and has found widespread acceptance in the Java developers community. It provides an easily configurable, reliable, scalable, and somewhat friendly infrastructure for managing Java applications locally or remotely.
JMX uses a three-layer architecture:
- The Probe level contains the probes (called MBeans) that represent various attributes of the monitored resource. It is also known as the Instrumentation layer.
- The JMX Agent level or MBeanServer exposes the MBeans to applications
- The Remote Management layer, or the third level, enables remote applications to access MBeanServer through connectors and adaptors. A connector provides full remote access to the MBeanServer API using various communications (RMI, IIOP, WS-*, JMS).
Here is our list of the best commercial JMX monitoring tools:
- ManageEngine Applications Manager – EDITOR’S CHOICE This comprehensive APM is suitable for use by IT Operations teams and also DevOps environments. This is an on-premises software package that is available for Windows Server and Linux. Start a 30-day free trial.
- Site24x7 – FREE TRIAL A streamlined solution for modern Java application management. It provides seamless integration with the Java ecosystem, real-time insights into key metrics, and comprehensive monitoring of JMX MBeans, ensuring administrators can effectively oversee and optimize Java application performance. Start a 30-day free trial.
- Nagios This software package provides monitoring for networks, servers, and applications. It is available in free and paid versions, both of which include JMX monitoring. Runs on Linux, Unix, and macOS and on Windows over a hypervisor.
- Jolokia This is a useful free tool if you want to collect JMX data from several points, including remote locations, and feed them through to a monitoring tool, such as Nagios. Runs on Linux.
- Hawt.io This tool is a frontend system that can process and display any data source, including JMX monitoring information. It would make a great companion to the interface-less Jolokia and it is free to use. Available for Windows and Linux.
- eG Enterprise This SaaS platform offers an application performance monitor that includes JMX monitoring capabilities that are based on MBeans.
- AppDynamics An online application performance monitor that works with MBeans and is able to integrate distributed tracing results in with the activity reports of hosted applications.
Here is our list of the best open-source tools for JMX monitoring:
- MX4J This is a package for J2SE that provides monitoring functions for JMX and can also be used as a wrapper.
- MC4J This is a Swing system that can implement remote monitoring and management for JMX.
- EJTools JMX Browser This viewer gives access to the JMX environment. The tool is Swing-based for remote connections and Web-based for local connections.
- Panoptes This JMX manager has a graphical user interface and will work with Tomcat, J2EE, and JBoss environments.
- JMX4Ant A library of JMX monitoring routines that expands the Ant environment to get it to extract data from MBeans.
- JFoxMX This service interacts with MBeans through HTTP queries to access JNX information.
- jManage This is a good choice for managing distributed applications and includes support for SNMP network reports as well as JMX.
- jConsole This easy to use monitor and manager for Java systems has a graphical user interface. It works with MBeans.
- JMX Console This is a console written as part of the JBoss project, so it is intended for use with JBoss, looking into MBeans
What is JMX Monitoring?
JMX Monitoring is querying data from Managed Beans (MBeans) exposed via a JVM port (JMX console). An MBean represents a resource running inside a JVM and provides data on the configuration and usage of that resource.
MBeans are generally grouped into domains to denote where the resource belongs to. Usually, you will see multiple domains in a JVM. You might also see custom domains that belong to an application, given how trivial it is to write custom MBeans via the JMX interface.
The Importance Of JMX Monitoring
JMX is to Java applications the way SNMP is to network devices. Hence, JMX is a fundamental mechanism widely used by monitoring and management tools to collect performance statistics about the applications.
You can use JMX in multiple ways:
- Standard Java application servers such as Tomcat, JBoss, WebLogic, etc., expose performance metrics through JMX. The JMX interface helps with both agent and agentless monitoring of the application servers.
- Monitoring of the JVMs running on a server is done using JMX. The agents connect to standard MBeans exposed by the JVM to collect the key performance metrics. This includes threads running in the JVM when trash collection happens, how much memory is released, etc.
- Custom MBeans exposed by applications running on these application servers can be monitored.
Java Monitoring Tools
If you want to keep your users happy and your business going, your Java app needs to be up and running smoothly at all times. It is not enough to have it installed, and you will have to look beyond the code and into the workings of the Java Virtual Machine (JVM) actively.
By monitoring with the help of Java Monitoring Tools, you can measure performance and detect issues that might affect your users’ experience. There are different tools that you can use to monitor your Java application. Some of them provide similar functionalities, while others give a different set of options to ensure visibility.
You can choose from various options like application performance monitoring, profilers, tracing, and more. Each set of tools gives you a different angle and a different set of possibilities for looking at the problem.
The Java Virtual Machine has built-in instrumentation that enables you to manage and monitor it using the Java Management Extensions (JMX) technology. These built-in management utilities are often referred to as out-of-the-box management tools for Java VM.
Evolution Of JMX Monitoring
Java Management Extensions technology provides a simple, standard way to perform JVM performance monitoring and manage your JVM resources such as applications, devices, and services. However, it is challenging for system admins and developers who want more profound insight into their applications to extract metrics from JMX.
There are a lot of products right now for JMX monitoring, like Dynatrace, DataDog, and Splunk APM, but they are all in the enterprise sector. JMX monitoring has evolved, and new products are available for small and medium-sized companies, including open-source products.
The Best Commercial JMX Monitoring Tools
While open-source tools are very tempting because they are free, there isn’t really a need to have a separate tool to monitor JMX if you have a well-written commercial application monitoring system that includes JMX monitoring capabilities.
Our methodology for selecting a JMX monitoring tool
We reviewed the market for commercial JMX monitoring systems and analyzed options based on the following criteria:
- Application discovery that can identify Java-based modules
- JMX-aware monitoring processes
- Application dependency mapping
- Distributed tracing for tracking remote services
- Code profiling that steps through Java scripts
- A free trial for a risk-free assessment opportunity or a free tool
- Value for money from a JMX-enabled monitoring system that tracks remotely-hosted systems as well as in-house services
With these selection criteria in mind, we identified a number of JMX monitors that include SaaS packages and on-sites services. We also made sure to include some free monitoring options.
1. ManageEngine Applications Manager – FREE TRIAL
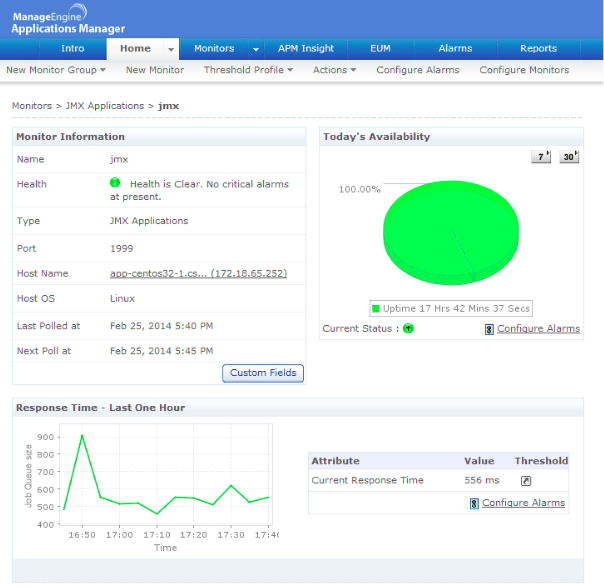
With JMX monitoring tool Applications Manager, you can monitor Java/J2EE applications that expose management information via JMX. It identifies transactions, threads, and connection pools responsible for consuming JVM resources. You can also perform thread dumps and analyze them with a Java thread dump analyzer. ManageEngine Applications Manager is a comprehensive monitoring tool with a consistent and usable interface.
Key Features
- JMX and MBeans querying
- Java/J2EE monitoring
- Application discovery
- Distributed tracing
- Application dependency mapping
Monitoring JMX and custom MBeans can be quite a task. Still, with the Applications Manager’s JMX metrics monitoring solution, you can query and report on any managed beans (MBeans) from your application. You gain real-time visibility into custom metrics in your application deployments like the state of memory management, class loading, active threads, logging, and platform configuration.
Pros:
- Offers on premise and cloud deployment options, giving companies more choices for install
- Can highlight interdependencies between applications to map out how performance issues can impact businesses operations
- Offers log monitoring to track metrics like memory usage, disk IO, and cache status, providing a holistic view into your database health
- Can automatically detect databases, server hardware, and devices in real time
Cons:
- Can take time to fully explore all features and options available
Applications Manager executes JMX MBean operations and custom scripts to help administrators take corrective actions when thresholds are breached. In addition, it creates notification listeners that listen for MBean notifications for specific events and respond appropriately.
The JMX monitoring tool also enables you to identify trends and correlate metrics from an application during a slow transaction. It helps you get out-of-the-box reports with trending information and supports JMX 1.2 / JDK 1.5 / MX4J – RMI connector, Weblogic JMX, JBoss JMX, and WebSphere JMX. Applications Manager also supports application servers running on Java version 1.5 and above.
Last but not least, Applications Manager’s JMX monitoring tool can automate regular maintenance tasks, rolling upgrades, and more. You can get notified via e-mail or SMS when the application becomes critical with the help of threshold profiles and pattern matching. Start a 30-day free trial.
EDITOR'S CHOICE
ManageEngine Applications Manager is our top pick for a JMX monitoring system because it is able to track the performance of a list of applications, not just those written in Java. The tool is able to discover all applications, unearthing microservices, even those hosted elsewhere. It then traces the activity of these functions as they run and steps through the code of Java-based functions. This system is able to extract data from JMX and MBeans. The tool will raise an alert if it detects performance problems.
Download: Get a 30-day FREE Trial
Official Site: https://www.manageengine.com/products/applications_manager/download.html
OS: Windows Server, Linux, AWS, and Azure
2. Site24x7 – FREE TRIAL
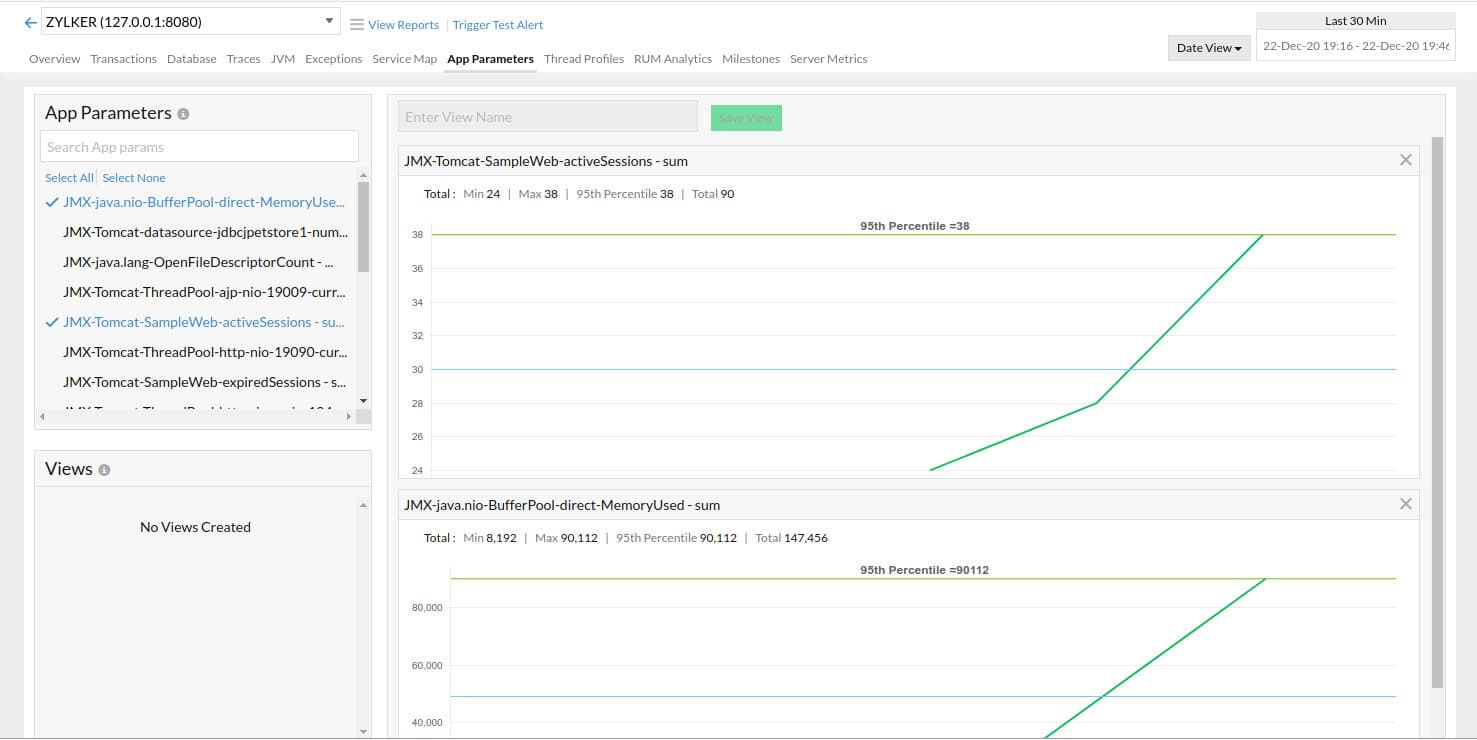
When it comes to JMX (Java Management Extensions) monitoring, Site24x7 offers a robust and versatile solution, catering effectively to the needs of modern Java application management. Site24x7's JMX monitoring capabilities are designed to simplify the tracking and management of Java applications, making it easier for administrators to oversee and optimize their performance. This tool integrates seamlessly into the Java ecosystem, providing real-time insights into key metrics and application behavior.
Key Features
- Comprehensive monitoring of JMX MBeans
- Real-time alerts and notifications
- Detailed reporting on Java application performance
- Easy integration with Java-based applications
- Customizable dashboards for monitoring specific metrics
Why do we recommend it?
Site24x7 is recommended for its ability to deliver detailed and actionable insights into Java application performance. Its comprehensive JMX monitoring capabilities make it an ideal choice for managing complex Java environments effectively.
Who is it recommended for?
This tool is particularly beneficial for Java developers, IT operations teams, and system administrators who manage Java applications. It is well-suited for environments where maintaining optimal performance and quick troubleshooting of Java applications is critical.
Pros:
- In-depth monitoring of Java applications via JMX
- Customizable alerting and notification system
- User-friendly interface with customizable dashboards
Cons:
- May require a learning curve for users new to JMX monitoring
3. Nagios
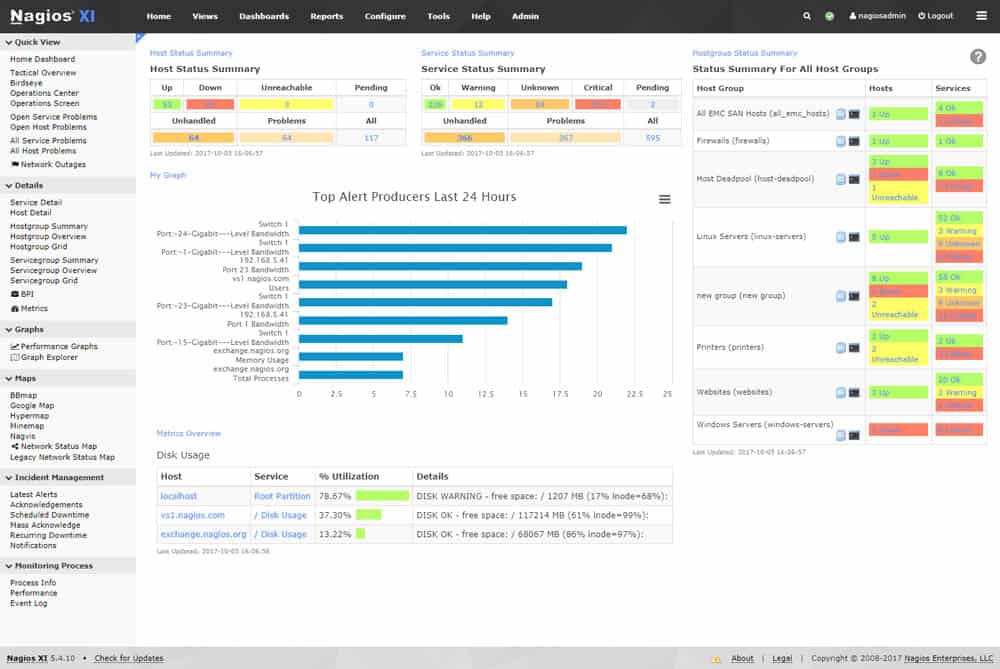
Nagios provides complete monitoring of Java Management Extensions (JMX). Implementing Nagios helps in increasing server, services, and application availability. The JMX monitoring tool also helps with the fast detection of network outages and protocol failures, and it also helps in detecting failed process services and batch jobs.
Key Features
- JMX compatible
- Network, server, and application monitoring
- On-premises for Linux
- Free and paid options
Nagios XI and Nagios Core solutions provide JMX monitoring capabilities and loads of benefits.
Nagios XI is the most potent and trusted infrastructure monitoring tool on the market. Millions of users and thousands of companies, ranging from Fortune 500 to small business owners, rely on Nagios XI to get the work done. It has a powerful GUI that provides customization of layout, design, and preference on a per-user basis, giving your customers and team members the flexibility they want.
Integrated web-based configuration interface lets admins hand out control of managing monitoring configuration, system settings, and more to end-users and team members quickly. Configuration wizards guide users through monitoring new devices, services, and applications without understanding complex monitoring concepts.
Nagios Core provides monitoring of all mission-critical infrastructure components. You get a complete centralized view of your entire IT operations and review detailed status information through the web interface. In addition, event handlers can automatically restart failed applications, servers, devices, and services when problems are found.
Nagios Core’s multiple APIs provide integration with in-house/third-party applications and community-developed add ons. The availability reports in the tool ensure that SLAs are being met, and historical reports offer records of critical information. Additionally, you can configure multi-user access and user-specific views to ensure clients see specific information.
Pros:
- Open-source transparent tool
- Simple, yet informative interface
- Flexible alerting options support SMS and email
- Robust API backend makes it a great option for developers who want to integrate their own custom applications
Cons:
- The open-source version lacks quality support found in paid products
- Installation can be technical and complex
4. Jolokia
Jolokia is a simple WAR or JAR file type of implementation. You can install it as an agent by adding the agent JAR into the classpath, or you can drop the WAR file and auto-deploy. Jolokia has API endpoints to monitor the status of any application. It is also a JMX-HHTP bridge that gives an alternative to JSR-160 connectors.
Key Features
- JMX data collection
- Transfers over HTTPS
- Requires a third-party data processor
Jolokia is an agent-based approach with support for many platforms. In addition to basic JMX operations, it enhances JMX remoting with unique features like bulk requests and fine-grained security policies. Furthermore, you can process data to get what you want, and it supports Bean invocation over REST API. Thus, you get all the metrics you want and monitor them.
Pros:
- Completely free tool
- Easy and lightweight installation
- Is highly flexible
Cons:
- Only runs on Linux
- No GUI
While this is suitable for most monitoring solutions like Nagios and advanced, Jolokia has no GUI, which can be a demerit.
5. Hawt.io
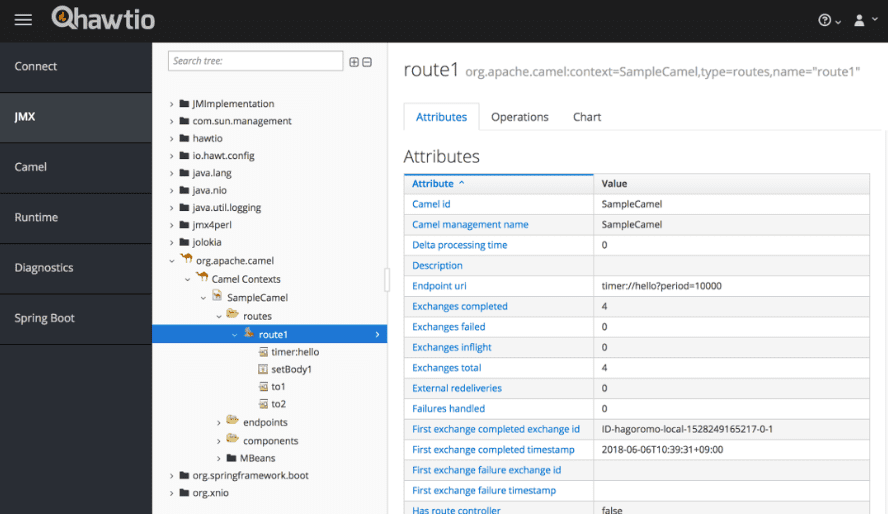
Hawt.io is a modular web console for managing your Java applications, and they are precise about it. The application can be Tomcat, WebLogic, WebSphere, Liberty, or anything else; Hawt.io just works splendidly.
Key Features
- Manages Java applications
- API option
- Easy-to-read console
Pros:
- Simple and easy-to-use tool
- Runs via web console making it highly flexible
- Supports GUI as well as API for management
Cons:
- Not the best option for larger enterprises
Hawt.io is built on top of Jolokia, and it supports Jolokia API endpoints. In a single WAR file, you get both GUI and API endpoints.
6. eG Enterprise
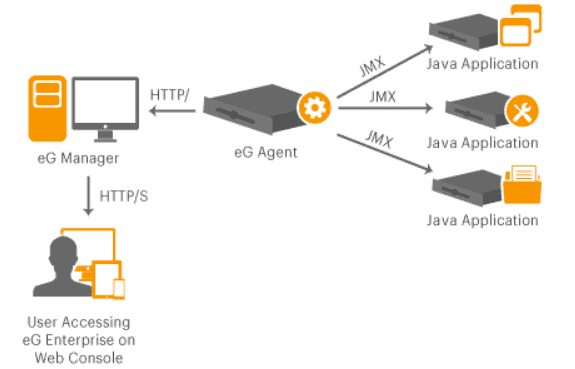
eG Enterprise supports agent-based and agentless monitoring of Java applications using JMX. The tool allows applications and IT operations teams to monitor Java applications without writing any code.
Key Features
- JMX data consolidator
- Forwards data via HTTPS
- Alerts for performance problems
The JMX monitoring tool monitors all aspects of JVM performance using built-in JMX monitoring capabilities. It also uses JMX to monitor web container performance and identify bottlenecks. eG Enterprise allows monitoring custom Java applications using JMX technology and auto-baseline and alerts when abnormalities are noticed with values of custom MBeans configured by IT admins.
eG Enterprise’s application performance monitoring capabilities include monitoring user experience through synthetic and real user monitoring and tracking Java Virtual Machine performance aspects. The tool also helps monitor the web containers to identify configuration bottlenecks and monitor custom applications, including code-level visibility.
JMX is the key technology that exposes metrics related to the performance of the eG Enterprise custom applications. With eG Enterprise, you can:
- Pick and choose which MBeans you are interested in monitoring
- Auto-discover MBeans of a target application
- Have the option to import the MBeans of interest to you
- Track the values of these MBeans tracked historically; Track raw values, rate of change, etc.
- Auto-baseline the metrics and receive proactive alerts if the values go out of bound
Pros:
- Can monitor a wide range of virtual host environments, making this truly suited for larger enterprises or MSPs
- Threshold-based altering can notify when VMs go offline, or become slow due to resource related issues
- Offers root-cause analysis to help technicals solves issues faster, resulting in more uptime
Cons:
- No freeware version
eG Enterprise works on cloud environments, hybrid-cloud setups, and on-premises deployments.
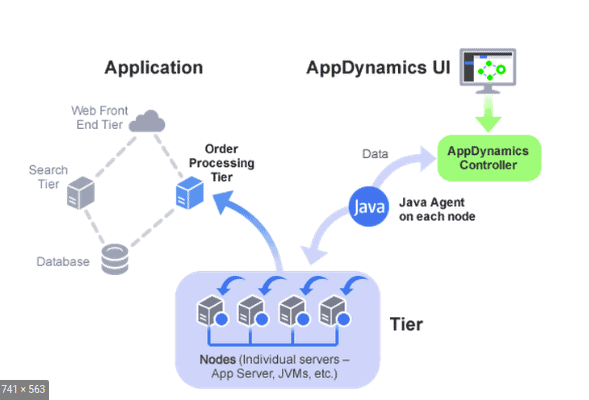
7. AppDynamics
AppDynamics helps you with JMX monitoring by querying the most useful JMX metrics right out of the box to ensure you can monitor the shared resources that can impact application performance.
The tool drills into the database connection pool bottlenecks by reviewing how frequently the application uses and utilizes database connections relative to the pool limits enforced by JVM container configuration.
AppDynamics monitors custom MBeans and queries and reports any MBean from the application during JMX monitoring to gain real-time visibility of custom metrics that you may have implemented as part of your application deployment.
Key Features
- JMX data collection
- Resource monitoring
- Performance alerts
The JMX monitoring tool also identifies which business transactions, classes, and methods consume JVM resources, such as thread and database connection pools.
AppDynamics lets a user trend and correlates metrics from the Cassandra cluster when a slow business transaction is executed. This level of Cassandra monitoring helps the user understand what state the Cassandra cluster was in, along with the key events and pending tasks that occurred. You can also monitor thread pool utilization and Column Family activity, so the user can troubleshoot what is impacting query performance.
AppDynamics also allows you to visualize and map JVM dependencies, automatically discovering and mapping all tiers that service and interact with your Java Application and JVM. This gives you a far superior high-level view of your application performance than other Java performance tools.
Regarding JMX trending, you can get a comprehensive metrics viewer that allows you to correlate, trend, and analyze key metrics from your JVM and Container (via JMX). You can also get metrics via custom MBeans and detect and troubleshoot memory leaks and object trash issues, even under production load.
Pros:
- Tailored for large-scale enterprise use
- Excellent dependency mapping and visualizations to help troubleshoot complex application systems
- Leverages AI and machine learning to provide root cause analysis and remediation steps
- Includes a free version
Cons:
- Would benefit from a longer 30-day trial period
AppDynamics platform supports all common Java monitoring frameworks, including Tomcat, JBoss, Weblogic, WildFly, Glassfish, Apache CXF, Jetty, and many more.
The Best Open-source JMX Monitoring Tools
There are a number of small, free utilities available for JMX monitoring that are handy to have around.
MX4J
MX4J is a project to build an open-source implementation of the Java Management Extensions (JMX) and the JMX Remote API (JSR 160) specifications and to build tools relating to JMX.
The primary goals of MX4J are to closely adhere to the JMX specifications, develop a highly robust codebase, and be 100% compatible with the reference implementations.
MC4J
This software allows for remote connections to JMX servers and provides the ability to browse existing managed beans (MBeans) and execute operations on them. They are also 100% compatible with reference implementations.
EJTools JMX Browser
The EJTools JMX browser is a tool that allows you to view and interact with the JMX space in a JMX-compatible implementation. It provides the following features:
- Remote connections via RMI/IIOP/others (Swing-based)
- Local connection (Web-based)
- A hierarchical view of the domains and the MBeans
- Access to the attributes, the operations, and the notifications
- Attribute plotting
The EJTools JMX browser comes in two flavors:
- A swing-based application that you can connect remotely to interact with the JMX server/implementation
- A web-based application that you can run on any J2EE 1.3 web stack. It provides an easy way to interact with the JMX server.
Panoptes
Panoptes is a graphical JMX management console for JFace/SWT. Panoptes is designed to work with any JMX server, such as JBoss or Tomcat, However, or any J2EE server. The tool uses Jelly to provide customized rich user interfaces for MBeans using the robust widget set of JFace / SWT.
JMX4Ant
JMX4Ant is a set of optional Ant tasks that allow interactions with JMX MBeans. Ant is a convenient tool to use in automating away the daily drudgery of routine development tasks. With JMX4Ant, you can deploy and undeploy the resources that are created for a particular target server.
JFoxMX
JFoxMX is an open-source implementation of the JSR-3 Java Management Extensions (JMX) and JSR-160 JMS Remoting API specifications. It comes with an HTTP-based adaptor to view/invoke operations/attributes on its MBean server.
jManage
jManage is an open-source, web, and command-line-based JMX client. It provides a centralized console for managing applications in clusters and distributed- application environments. jManage goes beyond an ordinary JMX client by offering features like alerts, graphs, security, SNMP support, etc. The jManage mission is to provide an open-source management platform that you can use to manage and monitor a complete production environment.
jConsole
The jConsole tool is a JMX-compliant graphical tool for monitoring a Java virtual machine. It can monitor both local and remote JVMs, and it can also monitor and manage an application.
The jConsole implementation is composed of the following packages:
- sun.tools.jConsole: This is a Sun private package containing the implementation of the entire jConsole tool except for the MBeans tab.
- sun.tools.jConsole.inspector: This is a Sun private package containing the implementation of the MBeans tab.
- sun.tools.jConsole.resources: This is a Sun private package containing the resource bundles and image files.
- com.sun.tools.jConsole: This Sun public documented package containing the jConsole plug-in API allows customers to extend jConsole’s functionality. Besides the existing standard tabs, you can add your custom tabs to jConsole, to perform your monitoring activities. The jConsole plug-in API provides a mechanism by which you can, for example, add a new tab to jConsole to provide a specific view of your own application’s MBeans.
jConsole allows you to see a lot of information, including the uptime, compile-time, live threads, peak, current heap size, current classes loaded, free physical memory, and others. For MBeans, you can see all the information about every MBean registered with that server, including a list of all the MBeans arranged by object names. When choosing a specific MBean, you can see its attributes, operations, info, and notifications in four easily navigable tabs. From here, you can check to see the attributes, and if they are writable, you can set the value of that particular attribute.
JMX Console
JMX Console is the management console used by JBoss. It gives you a raw view of all the MBeans that the JBoss server has. In addition, the console provides you information on the running server, modifying it, altering its setup, and stopping or starting components, among other tasks.
JMX Monitoring FAQs
How does JMX monitoring work?
JMX monitoring works by exposing the internal state of a Java application through a set of standardized MBeans. These MBeans can be accessed remotely by JMX clients or monitored by JMX-compatible monitoring tools, providing insight into the performance and behavior of the Java application.
How do I enable JMX monitoring for a Java application?
To enable JMX monitoring for a Java application, perform the following:
Add the following JVM options to the startup command for the Java application:
- -Dcom.sun.management.jmxremote
- -Dcom.sun.management.jmxremote.port=<port number>
- -Dcom.sun.management.jmxremote.authenticate=false
- -Dcom.sun.management.jmxremote.ssl=false
- Start the Java application with the modified startup command.
- Connect to the JMX interface using a JMX client or monitoring tool.
Is JMX monitoring secure?
By default, JMX monitoring is not secure and should only be used in trusted environments. If JMX monitoring needs to be used in an untrusted environment, secure JMX connections can be established by enabling authentication and SSL encryption in the JVM options.

