
Our funding comes from our readers, and we may earn a commission if you make a purchase through the links on our website.
The Best IBM Db2 Monitoring Tools
UPDATED: April 12, 2023
Looking to keep tabs on your Db2 ecosystem? In this article, we’ll explore 9 of the best IBM Db2 monitoring platforms you can use to monitor all Db2 products in one single place.
Here is our list of the nine best IBM Db2 Monitoring Tools:
- SolarWinds Server & Application Monitor – FREE TRIAL Features a flexible way to monitor Db2 databases as well as their supporting infrastructure on a single platform.
- Site24x7 Db2 Monitoring – FREE TRIAL Offers flexible add-ons for cloud-based monitoring that are ideal for smaller businesses looking to grow their monitoring capabilities soon.
- Idera – FREE TRIAL Pairs database optimization tools with a heavily DBA-focused monitoring backend.
- Paessler PRTG – FREE TRIAL Customizable sensor that allows companies to have granular control over every metric that is monitored.
- Datadog Uses out-of-the-box reporting, monitors, and reports to allow for fast and cloud-based monitoring.
- ManageEngine Features custom query tracking and enterprise-ready tools.
- AppDynamics Utilizes clean and intuitive dashboard to provide both Db2 insights as well as business intelligence.
- Opsview Features simple integrations using preconfigure Opspacks that contain premade sensors, reports, and alerts
- IBM Db2 Data Management Console A free tool included with Db2 deployments that offers great visibility into Db2, but cannot monitor other aspects of network infrastructure.
The Best IBM Db2 monitoring tools
1. SolarWinds Server & Application Monitor – FREE TRIAL
SolarWinds Server & Application Monitor (SAM) is a complete monitoring platform that gives organizations the ability to monitor IDM database servers, as well as the health and performance of the host server and supporting network infrastructure.
Key Features
- Network, server, and application monitoring
- Dependency mapping
- 1200 alert and monitoring templates
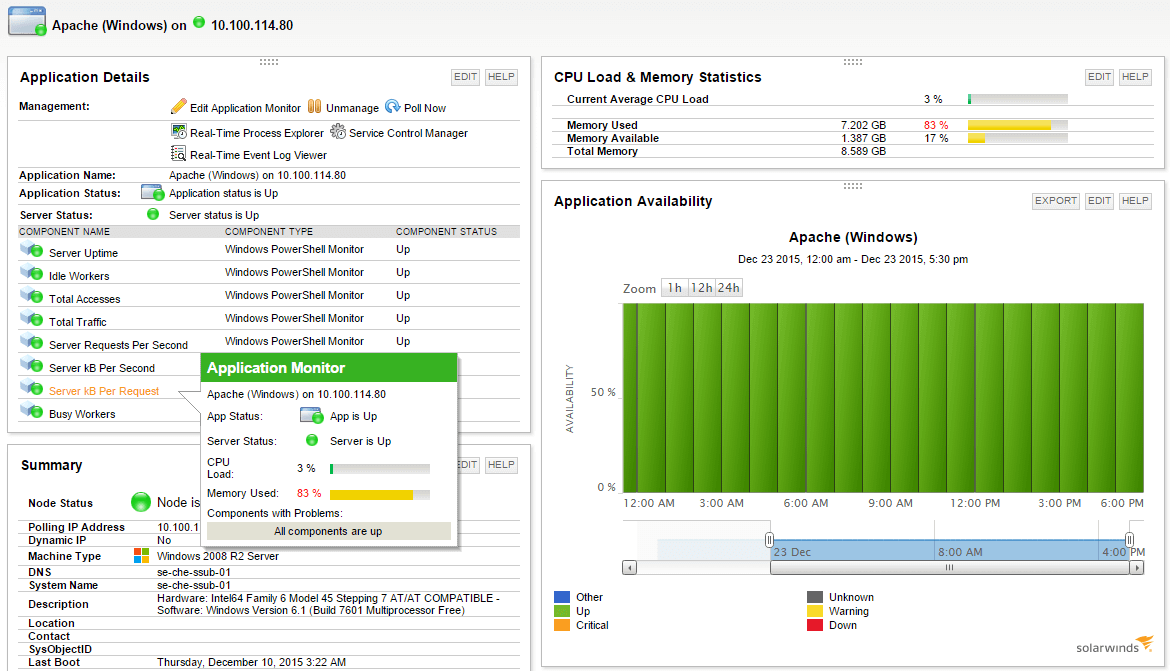
SAM features templates for dozens of different servers and databases including IBM Db2 databases. The templates make monitoring on multiple platforms simple and easy to set up. Once deployed, the agent will begin reporting metrics like average buffer size, total database space available, the index hit ratio, and average read time along with about a dozen other performance metrics.
Once online, SAM begins pulling these metrics into its customizable dashboard to instantly start assigning values and visualizations to these metrics. If you choose to install the SAM agent on the server you can measure the physical or virtual server’s resource consumption and performance over time. This allows you to combine both database performance and server health for your Db2 assets on a single screen.
The platform has over 1200 different monitoring templates that are designed to be as plug-and-play as possible. Once metrics are being collected you can create monitors based on conditions, variables, or thresholds and tie those monitors to alerts. For example, you can set a monitor for database space to send an email alert to the help desk if capacity reaches above 90%. You can get even more detailed and escalate that alert by sending an SMS alert, email, and support ticket when the size reaches 95%.
When monitoring the network as a whole you can use the infrastructure dependency mapping feature to understand how other areas of your network directly impact the availability and performance of your IBM Db2 servers.
Pros:
- Offers “done for you” dashboards, monitors, and templates designed for Apache webserver
- Provides live monitoring through its agentless architecture
- Supports auto-discovery that builds network topology maps and inventory lists in real-time based on devices that enter the network
- Can map applications, networks, and infrastructure as well as highlight bottlenecks and dependencies
- Uses drag and drop widgets to customize the look and feel of the dashboard
Cons:
- SolarWinds SAM is a feature-rich enterprise tool that can take time to fully explore
SolarWinds Server & Application Monitor starts at $1622 and has options for both perpetual and subscription-based licensing. You can test out SAM through a 30-day free trial.
2. Site24x7 Db2 Monitoring – FREE TRIAL
Site24x7 is another cloud-based monitoring tool that offers a suite of monitoring agents that can report on the performance and health of servers, networks, and individual applications. Site24x7 uses plugins on its base monitoring agents to integrate into different environments such as Db2.
Key Features
- Modular add-ons
- Application, network, and infrastructure monitoring
- Flexible integrations
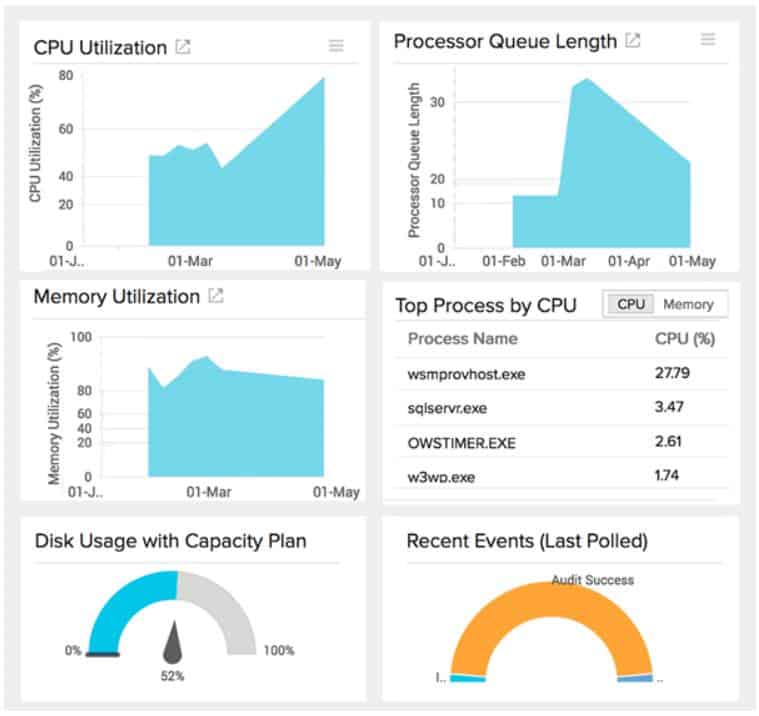
The platform does a great job of monitoring both real-time metrics, as well as providing tools that allow DBAs to look at big picture performance trends and metrics over time. This can prove especially useful when making changes across databases and needing to correlate internal changes with swings in performance.
Metrics like a number of buffer pools, logic/physical reads, and hit ratio are all captured in detail and then reported back to a home dashboard for visualization, analysis, and comparison. Once metrics are in place to be monitored, an incredibly simple alert template can be used to tie events to specific actions.
By following the alert creation wizard you can ensure that the right people are getting notified when performance starts to drift too far in the wrong direction, or if specific conditions or thresholds are met. Alert notifications can be sent out via SMS, email, third-party platforms like Slack, or custom solutions via a webhook integration.
Pricing for the Site24x7 APM plan starts at $35 per month when billed annually and includes 500MB of log files, as well as the monitoring of up to three applications. Add-ons are all customizable, meaning you can mix and match different log management options with your own unique number of monitor add-ons.
Pros:
- Offers out-of-the-box templates to monitor Apache servers quickly with little setup
- Uses real-time data to discover devices and build charts, network maps, and inventory reports
- The platform is intuitive, little training is needed to get it fully functional
- Supports a freeware version – a great option for smaller networks
Cons:
- Is a very detailed platform that will require time to fully learn all of its features and options
You can try Site24x7 completely free through a 30-day trial.
3. Idera – FREE TRIAL
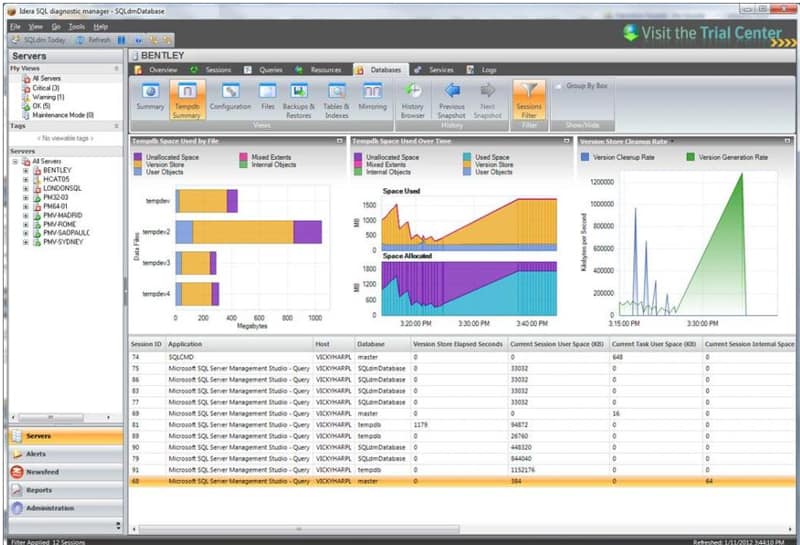
The Idera Application and Relational Database Performance Monitoring platform focuses on creating products to assist in monitoring, maintaining and managing different forms of databases. They have two separate solutions, one for monitoring Db2 instances, and another for optimizing code across DBMS platforms.
Key Features
- Database optimization tools
- Data modeling tools
- DBA focused
On top of just providing basic reporting and metrics, Idera can help DBAs create more efficient data models, streamline database changes, and identify queries that could be improved.
Pros:
- Simple, but powerful interface – great for new users
- Auto formatting and syntax color makes helps DBAs stay organized when at scale
- Offers numerous presets and recommendations to improve performance out of the box
- Supports collaboration with real-time feedback and team features
Cons:
- The trial could be longer
You can test out any one of the Db2 tools through a 30-day free trial.
4. Paessler PRTG – FREE TRIAL
Paessler PRTG features a host of customizable and premade sensors that can monitor almost all aspects of a company's network, server resources, and application performance. Total monitoring of all IBM products can be achieved and then centralized to a single dashboard, or organized based on which applications they support.
Key Features
- Freeware version
- Application, network, and infrastructure monitoring
- iOS and Android mobile app
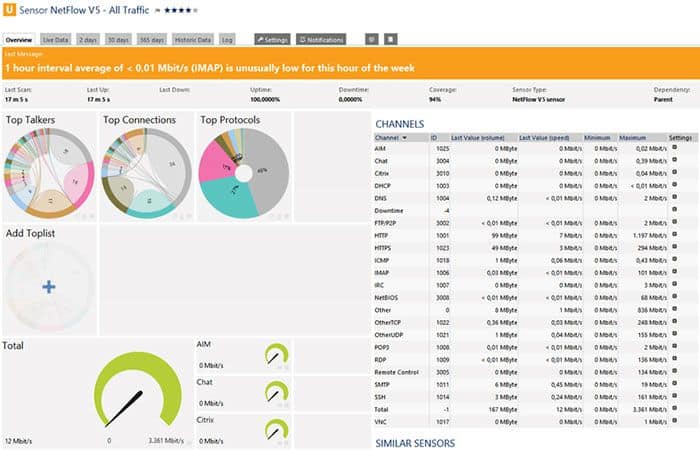
Metrics are pulled in from wherever the agent is installed, and are then visualized through a series of minimalist-style gauges graphs that offer a simple and uncluttered view into the health of your IBM Db2 services.
PRTG is a great option if you’re operating at an enterprise level and are also looking for monitoring options that can be deployed elsewhere on your network or across your servers. Since PRTG is so flexible, there’s a monitoring option for just about anything, and it all reports back to a single system which lets you organize those insights any way you want.
Flexible alerting allows for notifications to be sent out to multiple channels including email, SMS, push notifications, or API integrations into other custom solutions. One of the vastly overlooked aspects of PRTG is its mobile app offering. While many platforms have clunky monitoring apps, PRTG has put time and effort into its offering to make it a viable way to monitor your environment for both iOS and Android.
Pricing is relative to how many sensors you have deployed. Each sensor measures a particular metric. For example one sensor would be used to monitor database size in Db2, while another sensor would monitor the memory consumption of the host.
Pros:
- Leverages customized sensors to provide a detailed look into Apache server environments (including infrastructure)
- The dashboard is customizable through a series of widgets and feels intuitive out of the box
- Supports a completely free version for up to 100 sensors
- Pricing is based on sensor utilization, making this a flexible and scalable solution for larger networks as well as budget-conscious organizations
Cons:
- PRTG is a feature-rich platform that requires time to fully learn all of the features and options available
The first perpetual tier package offers 500 sensors across a single server environment for $1750. Subscription licensing is always available that only charges based on the sensors you consume.
You can test out PRTG free through a 30-day free trial. Once your trial is over your account will be reverted to the freeware version which can support only 100 sensors.
5. Datadog
Datadog is a cloud-based monitoring platform that offers monitoring across all aspects of an organization's IT infrastructure. Datadog makes integrations incredibly easy by having prebuilt modules for specific environments, including IBM Db2.
Key Features
- Holistic monitoring
- Plug and play dashboards and monitors
- Simple pricing structure
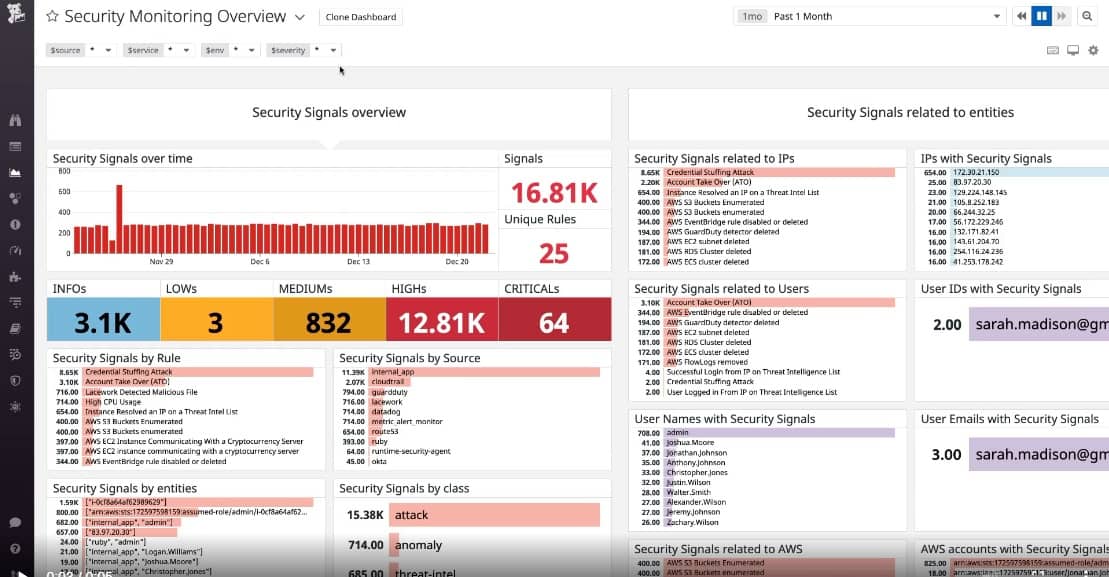
The integration features a built-in dashboard that’s already set up to monitor and reflect some of the most important key metrics in Db2 including query rates, database size, and server resource consumption. While Datadog offers a ton of monitoring and reporting templates preconfigured, you can still customize them to your liking, or build them from scratch to make your own internal template.
The visualizations Datadog provides make it simple to catch issues like inefficient queries, or bottlenecks that occur during high traffic times. You can visibly see anomalous behavior stand out from recent historical metrics recorded, as well as take a snapshot of your IBM Db2 performance and compare that to your performance benchmarks from the past.
Since Datadog is so flexible, you can simply deploy the same agent to other areas of your network and use integration to monitor that aspect of your server or network. Dashboards can easily be set up to monitor specific databases, networks, or business processes, allowing you to cycle through them at regular intervals for quick checks.
Pros:
- Provides quick insights into Apache servers through templates and prebuilt monitors
- Great interface, easy to use, and highly customizable
- Cloud-based SaaS product allows monitoring with no server deployments or onboarding fees
- Great option for those looking for holistic monitoring
- Supports auto-discovery that builds network topology maps on the fly
Cons:
- Would like to see a longer 30-day trial
The entire platform strives to do as much of the heavy lifting as it can from a monitoring perspective. Pricing for Datadog is broken down into tiers and has separate plans for infrastructure monitoring as well as APM and profiling. Application performance monitoring starts at $31.00 per host per month and features historical analysis, trace correlation, and log retention. Add-ons are modular, meaning you don’t have to pay for a higher package just to get additional log space or large data retention windows.
You can test Datadog completely with a fully functional 14-day free trial.
6. ManageEngine
ManageEngine offers an agentless way to monitor the health, metrics, and availability of your IBM Db2 environment. The tool allows you to collect core metrics of your database server and view them from any browser. The reporting dashboard is simple but gets the job done well for most sized Db2 environments.
Key Features
- Enterprise-ready
- Volume discounts
- Custom query tracking
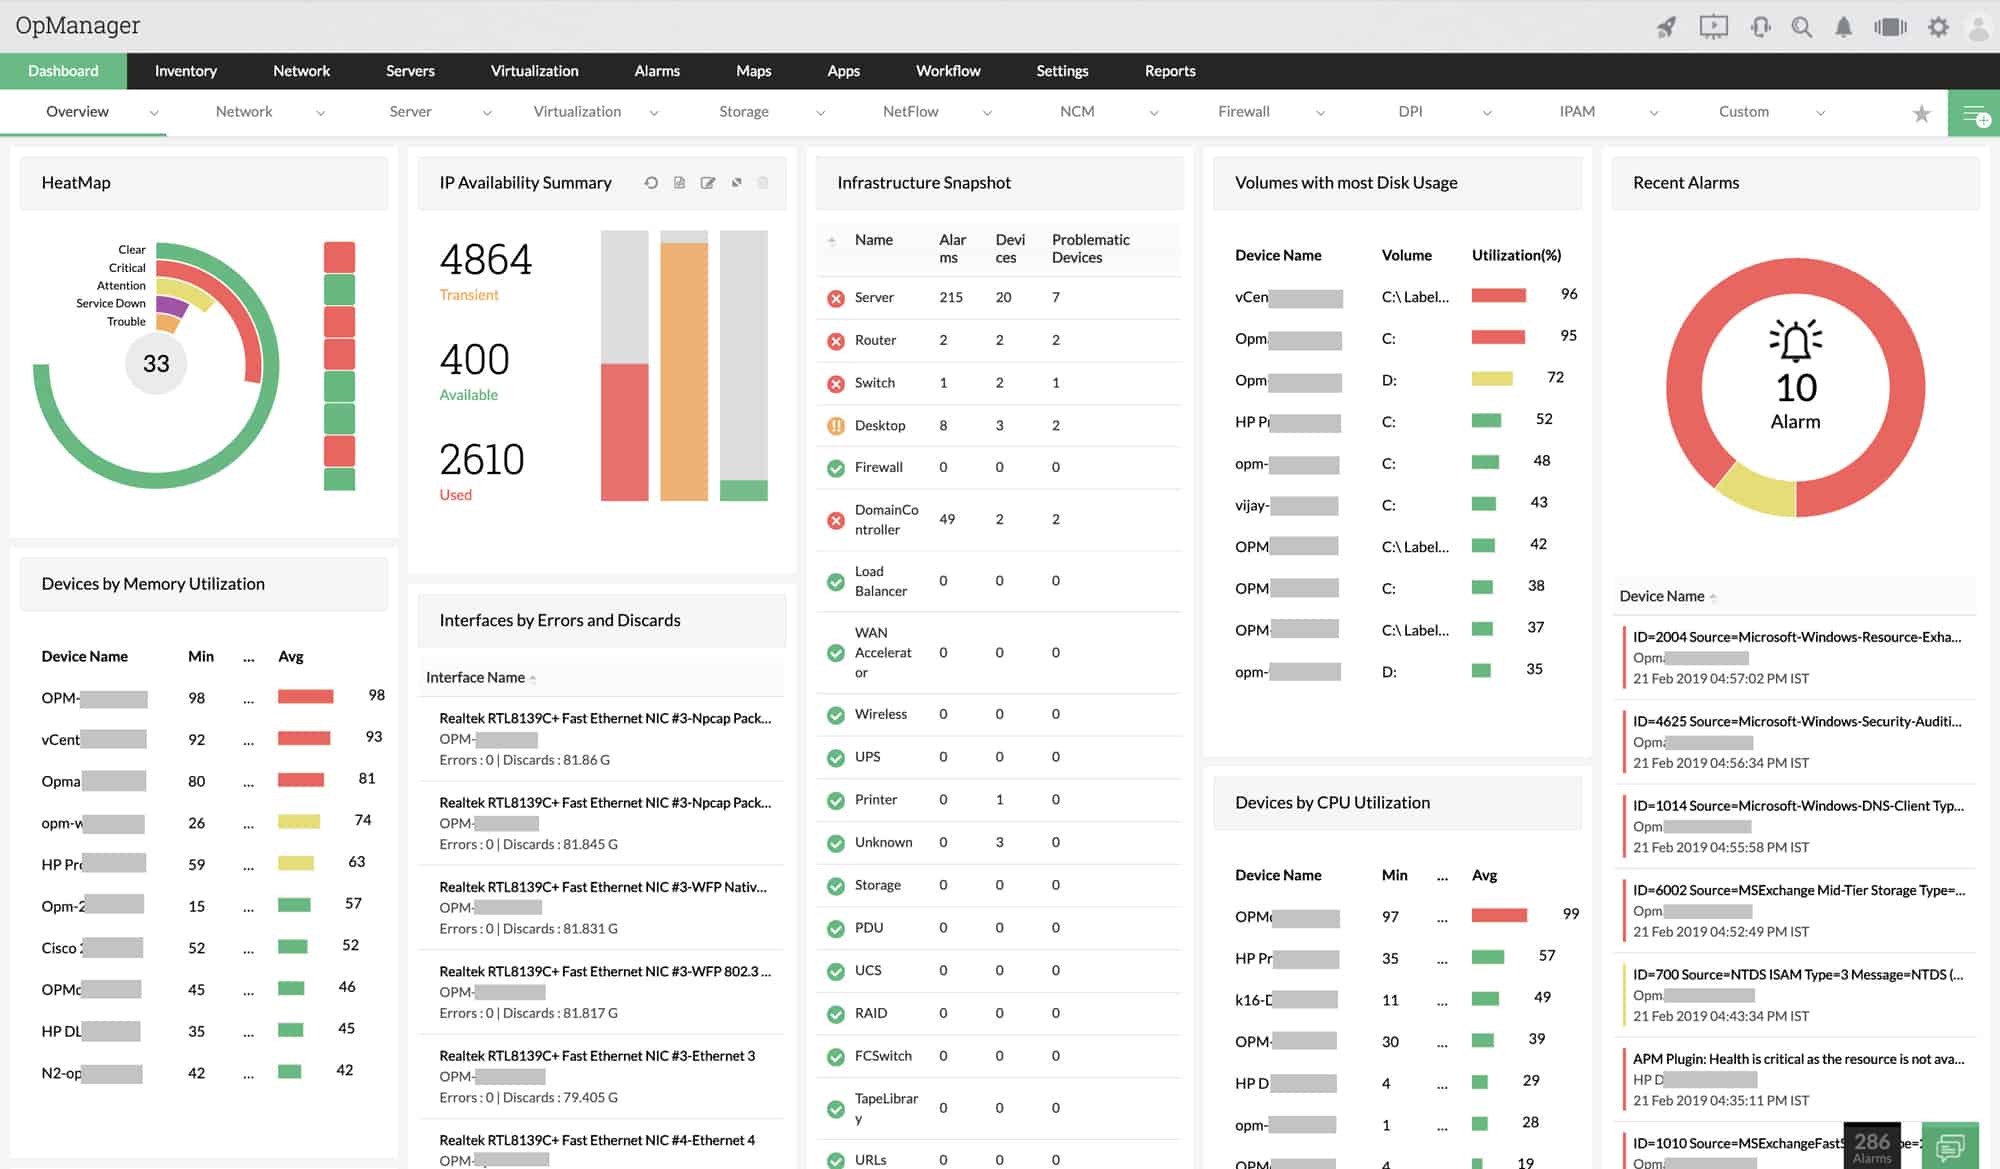
The data collected helps DBAs see the bigger picture by boiling down performance metrics into actionable performance enhancements. Root cause analysis also helps admins to be alerted to new issues and know right where to look to get the issue resolved.
For larger databases the grouping feature helps you bunch your databases by process, allowing you to create separate clusters of infrastructure for each business deliverable you may have running. This also can integrate with intelligent reports that help both tech and business development teams receive important insights on performance and usability.
Custom SQL queries can also be monitored on any IBM Db2 database, allowing for more custom data collection and more granular reporting and insights. Alerting is based on the thresholds you can configure, and those actions are executed automatically depending on what trigger is set.
Pros:
- Can monitor key Apache server metrics and automatically send alerts to users or teams
- Offers on-premise and cloud deployment options, giving organizations more flexibility for deployment
- Can highlight interdependencies between applications to map out how performance issues can impact businesses operations
- Can automatically detect databases, server hardware, and devices for real-time asset management
Cons:
- Can take time to fully explore all features and options available
Robust data collection can be set up on the back end to allow long-term performance comparisons and compliance audits. Pricing for ManageEngine starts at $945 per year for 25 monitors. Perpetual licensing is also available with volume-based discounts for larger deployments.
You can test out ManageEngine in your Dv2 environment free of charge with a 30-day trial.
7. AppDynamics
AppDynamics offers end-to-end monitoring of multiple IBM platforms including Db2 products. AppDynamics combines detailed monitoring, vibrant graphics, and simple alerting to cover multiple mainframe architectures.
Key Features
- Enterprise-level scalability
- Deep monitoring into the IBM ecosystem
- Interactive reporting
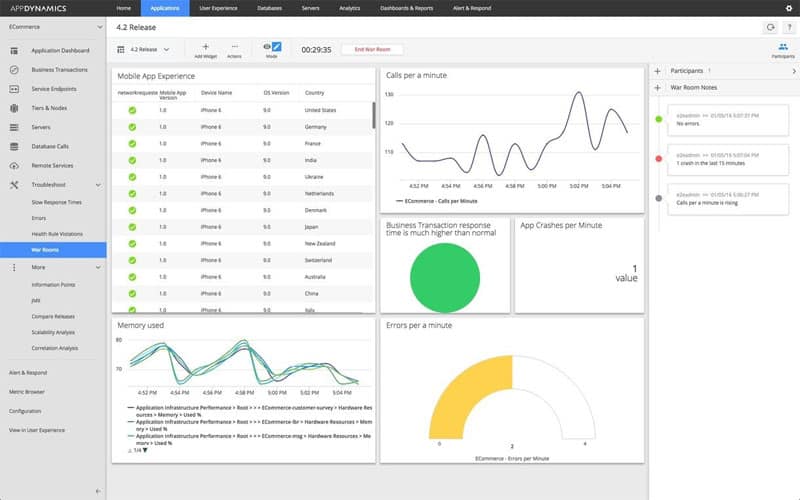
The agent automatically can discover different IBM Db2 products, servers, and mainframe and catalog them in the monitoring dashboard. A topological map is also created that acts as a live and navigable dashboard where you can visualize dependencies between certain systems, and see bottlenecks quickly.
The platform offers performance monitoring across CICS, IMS DB, MQ, and Db2 through a single agent. AppDynamics deploys several forms of intelligent monitoring to dynamically monitor baseline performance as well as perform on the fly root cause analysis and basic diagnostics. If anyone of these systems detects an issue, automation can be put in place to either run an automated repair or alert a helpdesk team.
Comprehensive performance reports allow DBAs to easily visualize and compare key performance metrics across recent and historical timelines. These reports can be sent in dashboard form that allows them to be interactive, and see the details of past performance issues with a simple click.
Pros:
- Tailored for large-scale enterprise use
- Excellent dependency mapping and visualizations to help troubleshoot complex application systems
- Leverages AI and machine learning to provide root cause analysis and remediation steps
- Includes a free version
Cons:
- Would benefit from a longer 30-day trial period
- Many features are designed for larger more complex networks – not ideal for smaller networks
Pricing of AppDynamics for both APM and infrastructure monitoring starts at $90.00 per month per CPU core. You can test out AppDynamics completely free through a 15-day trial.
8. Opsview
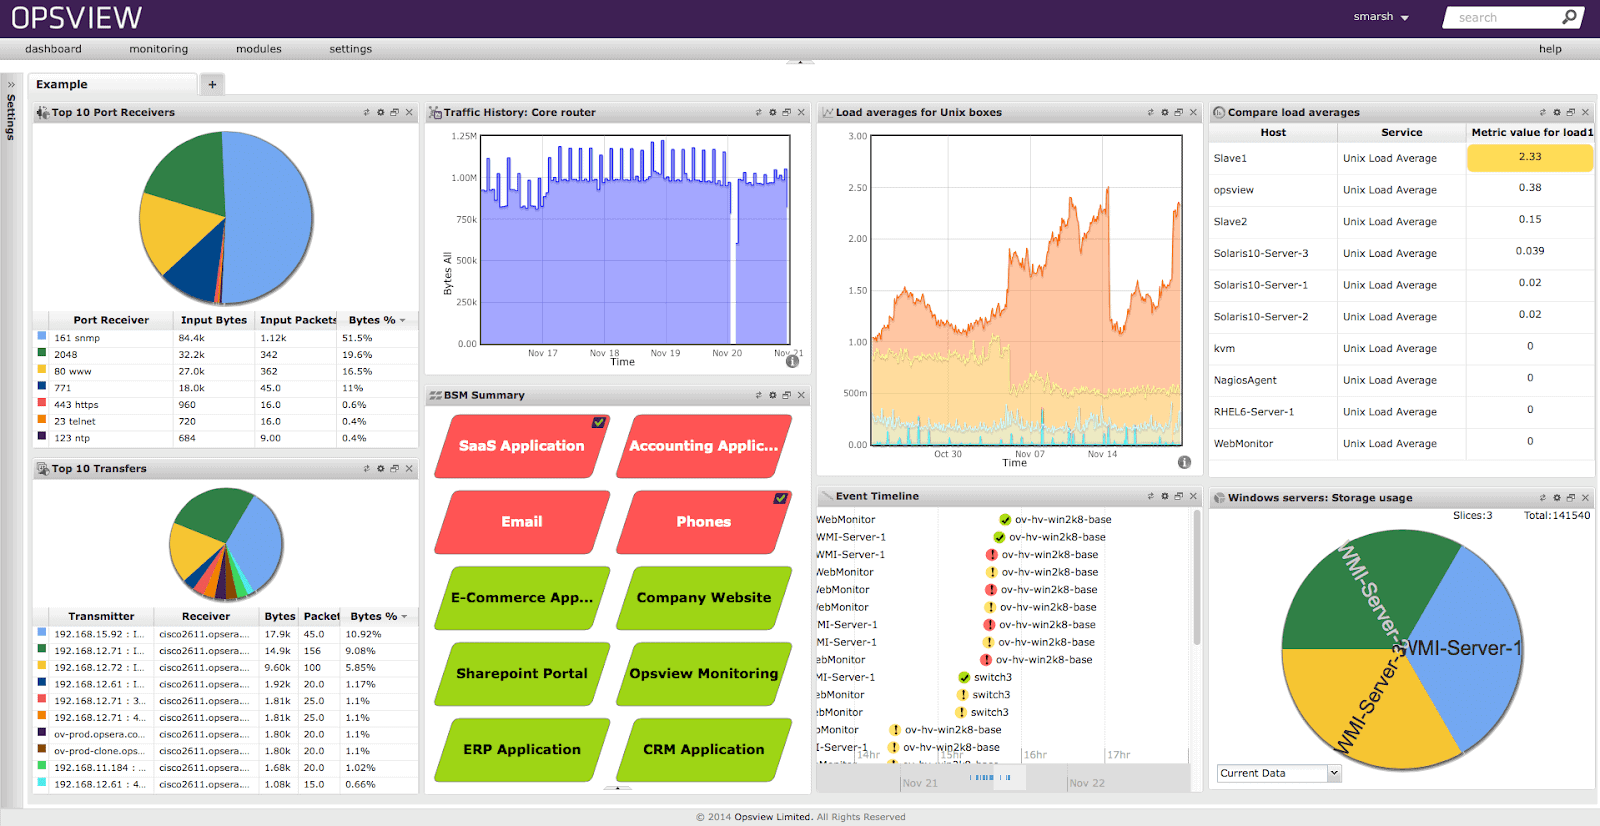
Opsview works to bridge the gap between application, network, and infrastructure monitoring by offering custom integrations into different environments through Opspacks. Each Opspack consists of a platform integration as well as a series of pre-configured service checks, dashboards, and alert templates.
Key Features
- Simple integrations
- Small business pricing option
- On-premises and cloud monitoring options
The Opspack for Db2 allows for cross-platform Db2 monitoring on Windows, Linux, and UNIX operating systems. Opsview is a good choice for organizations that are looking to deploy monitoring of their Db2 server at a higher level.
Autodiscovery ensures that new hosts are always included in the inventory and that agents are always able to interact and monitor new databases or server environments. Since Opsview offers a suite of monitoring agents, full organization-wide monitoring can be achieved on the platform.
Pros:
- Supports J-Flow, NetFlow, and sFlow monitoring
- Offers premade sensors – great for getting started right away
- Clean, easy-to-use interface
- Supports a free and paid version
Cons:
- Requires Opsview Monitor to monitor J-Flow streams
Pricing for Opspack is broken down into three options, SMB, Enterprise, and Opsview Cloud. The cloud version is designed to support all sizes, while the SMB is built for organizations with under 300 hosts. Pricing for the SMB package starts at $1300 annually. Pricing for the other packages is not publicly listed.
You can test Opspacks by requesting a demo.
9. IBM Db2 Data Management Console
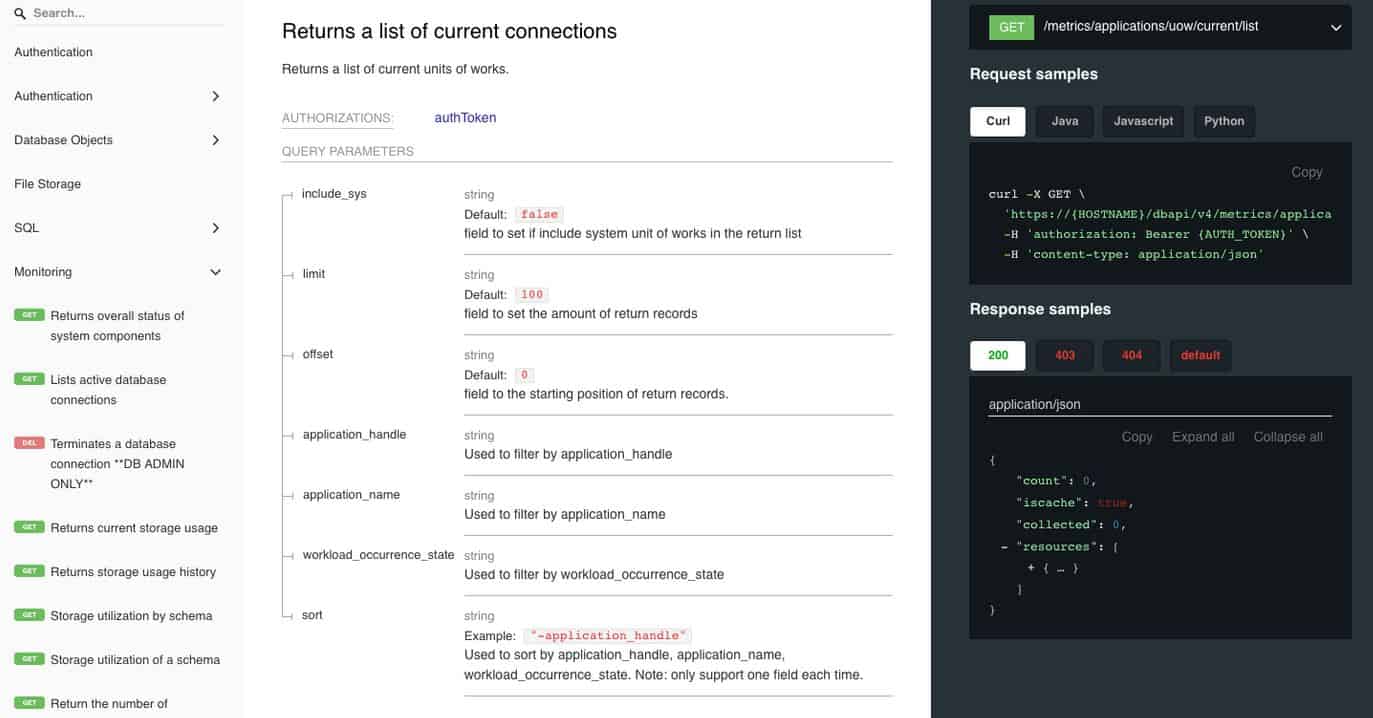
The IBM Db2 Data Management Console is a solution developed by none other than IBM themselves as a way for DBAs to manage and monitor the performance of their Db2 databases at scale.
Key Features
- Focused solely on IBM Db2 monitoring
- Fully integrated SQL editor
- Database object management
The browser-based console allows users to manage and administer their databases while also tracking performance metrics across individual databases and clusters alike. It features real time historical monitoring for quick performance benchmarking, as well as live editing of database objects on the fly.
A backend SQL editor can be used alongside the management console to help administrators save time from going back and forth while performing troubleshooting or testing tasks. For larger dev teams it offers a clean UI with team collaboration features that feel intuitive and are easy to use.
Features like LDAP integrations, and a larger API library make the management console ready for enterprises who use IBM products at scale. While the console has some great features, it fails to monitor other aspects of the enterprise on the network and server level. This can leave a blind spot in troubleshooting issues that exist outside of the Db2 ecosystem.
For organizations that also have multiple clouds, servers, and network environments this will be another dashboard to keep track of. Utilizing a holistic monitoring tool like Datadog or Site24x7, or SAM can consolidate your monitoring efforts and simplify them into a single dashboard and remediation center.
Pros:
- Completely free – included with Db2 deployments
- Easy to use
- Well documented and thoroughly supported
Cons:
- Fails to monitor other applications and parts of the network
IBM Db2 Data Management Console is free and included with all editions of DB3 and is a part of the Db2 family.
Which IBM Db2 monitoring tool is right for you?
For DBAs looking for more out of their existing monitoring tools, SolarWinds Server & Application Monitor offers an excellent on-premises solution for monitoring Db2 databases as well as supporting mainframes and network.
Those who wish to utilize a cloud monitoring solution will find both Datadog and Site24x7 to be competitive options that allow DBAs to quickly deploy monitoring agents and receive near instant insights into multiple layers of their IBM environment.
Are you currently monitoring your Db2 databases? What have been your biggest challenges with monitoring? Let us know in the comments below.
IBM Db2 Monitoring Tools FAQs
What are some common metrics to monitor for IBM Db2?
- CPU utilization
- Memory usage
- Disk space usage
- Connection usage
- SQL statement performance
What are some popular IBM Db2 monitoring tools?
- IBM Data Server Manager
- SolarWinds Database Performance Analyzer
- AppDynamics
- Quest Foglight for Databases
- Spotlight on IBM Db2
What are some benefits of using IBM Db2 monitoring tools?
- Improved performance and efficiency of the database
- Proactive identification and resolution of issues
- Increased security and compliance
- Better insights into the behavior and performance of the database
How can I choose the right IBM Db2 monitoring tool for my organization?
When choosing an IBM Db2 monitoring tool, you should consider factors such as the features and functionality that are most important to your business, the ease of use and deployment, the level of customer support, and the pricing and licensing model. You may also want to evaluate the vendor's reputation and customer reviews.
How can I get started with IBM Db2 monitoring?
To get started with IBM Db2 monitoring, you should first identify the key metrics and performance indicators that are most important to your business, and determine the tools and processes needed to monitor and analyze those metrics. You can then choose an IBM Db2 monitoring tool that best fits your needs and begin implementing it in your organization. There are many resources available online to help you learn more about IBM Db2 monitoring and how to use it effectively.

