
Our funding comes from our readers, and we may earn a commission if you make a purchase through the links on our website.
The Best Elasticsearch Monitoring Tools
UPDATED: June 14, 2023
On the hunt for the best Elasticsearch monitoring tools? We’ve got you covered. We’ll be testing out and reviewing nine of the best Elasticsearch monitoring tools to see what makes them so great.
Here is our list of the best Elasticsearch monitoring tools:
- SolarWinds Server & Application Monitor – FREE TRIAL Offers full visibility into Elasticsearch as well as other cloud and on-premises servers. Start a 30-day free trial.
- AppOptics Application Performance Monitor – FREE TRIAL A developer-focused platform that offers detailed troubleshooting tools with root cause analysis to speed help improve uptime and performance. Get a 30-day free trial.
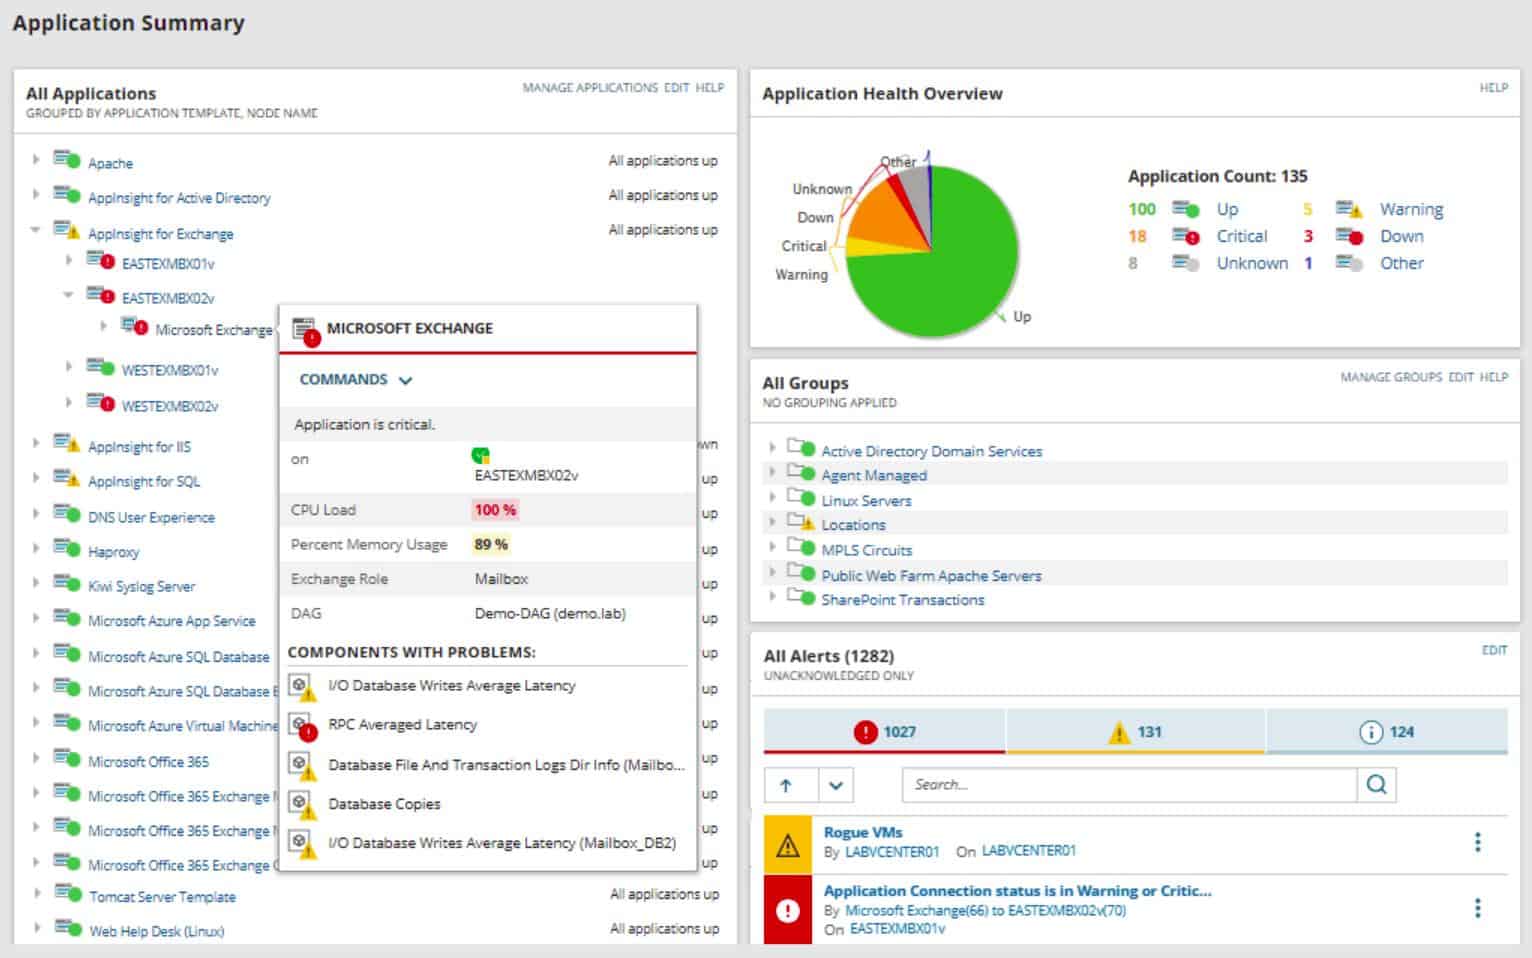
- ManageEngine Applications Manager – FREE TRIAL This package for software and platform performance tracking allows the monitoring of Elasticsearch implementation on premises and on the cloud. Runs on Windows Server, Linux, AWS, and Azure. Download a 30-day free trial.
- Site24x7 – FREE TRIAL A great option for cloud-based out-of-the-box monitoring, reporting, and alerts. Access a 30-day free trial.
- Datadog Offers network, infrastructure, and application monitoring to cover all aspects of your Elasticsearch engine.
- Dynatrace Uses AI-powered tools combined with an intuitive UI for monitoring across enterprise-sized organizations.
- Opsview Has a plug-and-play Opspacks that lets you start monitoring Elasticsearch and its supporting infrastructure quickly and efficiently.
- ElasticHQ Focused solely on Elasticsearch, the platform offers an open-source form of monitoring that is independent of your clusters and nodes.
- Paessler PRTG Has customizable sensors that are configured to monitor specific aspects of both Elasticsearch, as well as its supporting network, container, and infrastructure.
The Best Elasticsearch Monitoring Tools
Our methodology for selecting Elasticsearch monitoring tools
We reviewed various Elasticsearch monitoring tools and analyzed the options based on the following criteria:
- Support and integrations for Elasticsearch
- Root cause analysis options
- Distributed tracing support
- Graphical interpretation of data, such as charts and graphs
- A free trial period, a demo, or a money-back guarantee for no-risk assessment
- A good price that reflects value for money when compared to the functions offered
1. SolarWinds Server & Application Monitor – FREE TRIAL
SolarWinds Server & Application Monitor (SAM) is another tool that can monitor multiple aspects of your network and centralized monitoring efforts across the board. Custom sensors can be deployed to monitor Elasticsearch environments, and allow organizations to cover all of their bases by monitoring the server, the engine, and the supporting network infrastructure. This additional monitoring may seem like extra work, but will significantly reduce the amount of troubleshooting time you’ll waste hunting down bottlenecks when they do rear their heads.
Key Features
- Over 2000 integrations
- Root cause analysis
- Full-stack monitoring
These monitors can be deployed to monitor cluster health, resource utilization, and performance on the query level. The platform has no trouble scaling, no matter how large your clusters or network, and features over 1200 monitoring templates with additional community-created templates for integrations not covered by SolarWinds themselves.Outside of standard log data and Elasticsearch metrics, SAM can build dynamic network maps that provide a live look into your Elasticsearch environment, and supporting architecture.
If a problem arises that isn’t easily tied to an aspect of your search engine, SAM can help provide a visual cue as to where a bottleneck might be occurring. For deeper troubleshooting root cause analysis can be applied to help guide administrators in the right direction and get issues resolved quicker.
Pros:
- Designed with large and enterprise networks in mind
- Supports auto-discovery that builds network topology maps and inventory lists in real-time based on devices that enter the network
- Has some of the best alerting features that balance effectiveness with ease of use
- Supports both SNMP monitoring as well as packet analysis, giving you more control over monitoring than similar tools
- Uses drag and drop widgets to customize the look and feel of the dashboard
- Robust reporting system with pre-configured compliance templates
Cons:
- Designed for IT professionals, not the best option for non-technical users
You can test out SolarWinds Server & Application Monitor completely free through a 30-day free trial.
2. AppOptics Application Performance Monitor – FREE TRIAL
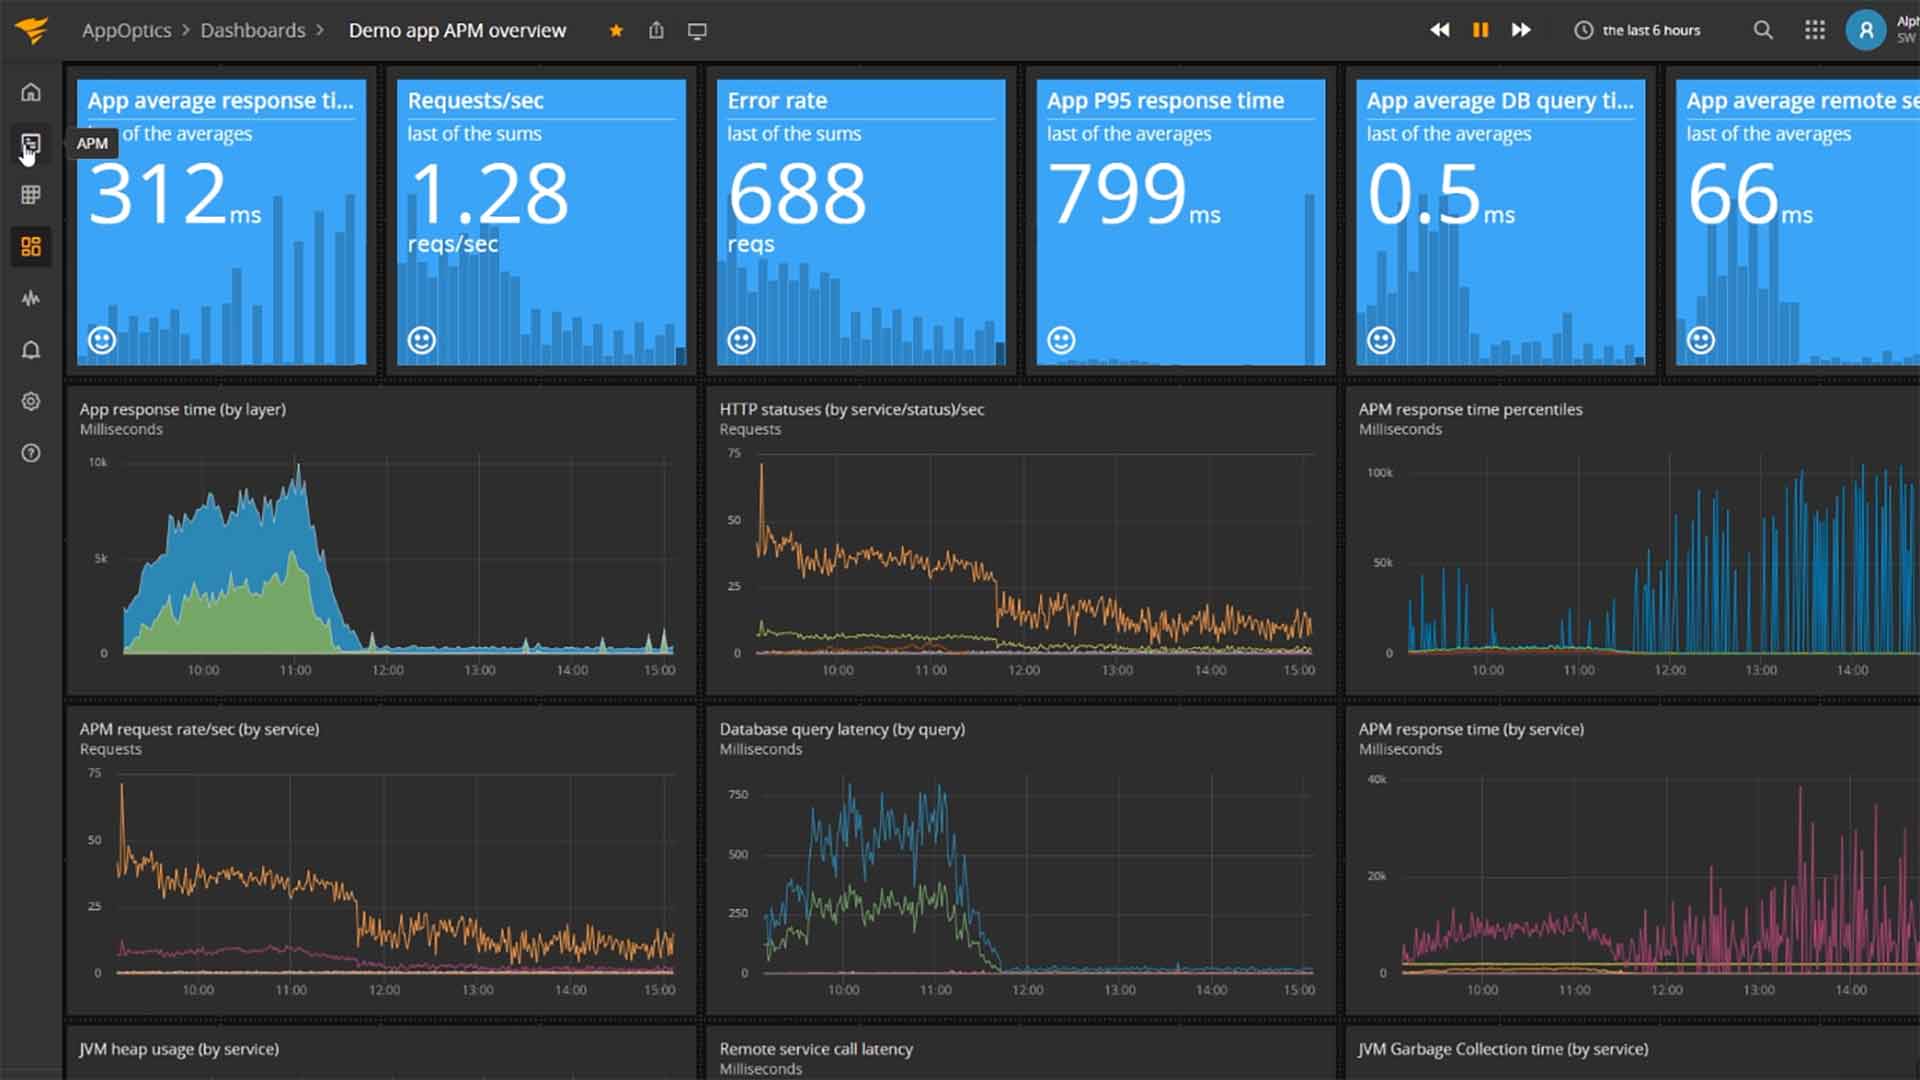
AppOptics takes a more focused approach on Elasticsearch monitoring and is a great choice for someone looking to only monitor their Elasticsearch metrics. The monitoring platform offers a host of different ways you can ensure you’re monitoring the correct metrics through specific Elasticsearch templates and customizable analytic dashboards.
Key Features
- DevOps focused tools
- AWS integrations
- Distributed tracing
Once you’ve chosen exactly what you want to monitor in Elasticsearch, you can create simple alerts centered around the conditions you specified and have those alerts trigger notifications that can be sent to third-party apps, email, or a host of other custom options via webhook.
Master nodes can be monitored to ensure they’re coordinating tasks properly while also tracking clusters to ensure that data is being stored and organized correctly. AppOptics does a solid job at combining high-level health insights with the option to dive deep into specific Elasticsearch metrics right from one screen.
All Elasticsearch log data can be stored and searched to help pinpoint performance issues as well as to compare current performance benchmarks to past performance. Full-text search allows for a range of integrations into the collected data including business intelligence integrations, and security intelligence systems like a SIEM platform.
Infrastructure & Application Monitoring through AppOptics starts at $24.99 per month when billed annually and includes features such as distributed tracing, live code profiling, and trace level root cause analysis summaries.
Pros:
- Offers great visualizations reflecting live and historical health metrics and resource consumption
- Is easily scalable cloud service
- Tracks all major resources focusing on over 180 different metrics
- Can monitor Docker, Azure, and Hyper-V platforms, offering more flexibility than competing options
Cons:
- Would like to see a longer trial period
You can test out AppOptics Application Performance Monitor completely free through a 30-day free trial.
3. ManageEngine Applications Manager – FREE TRIAL
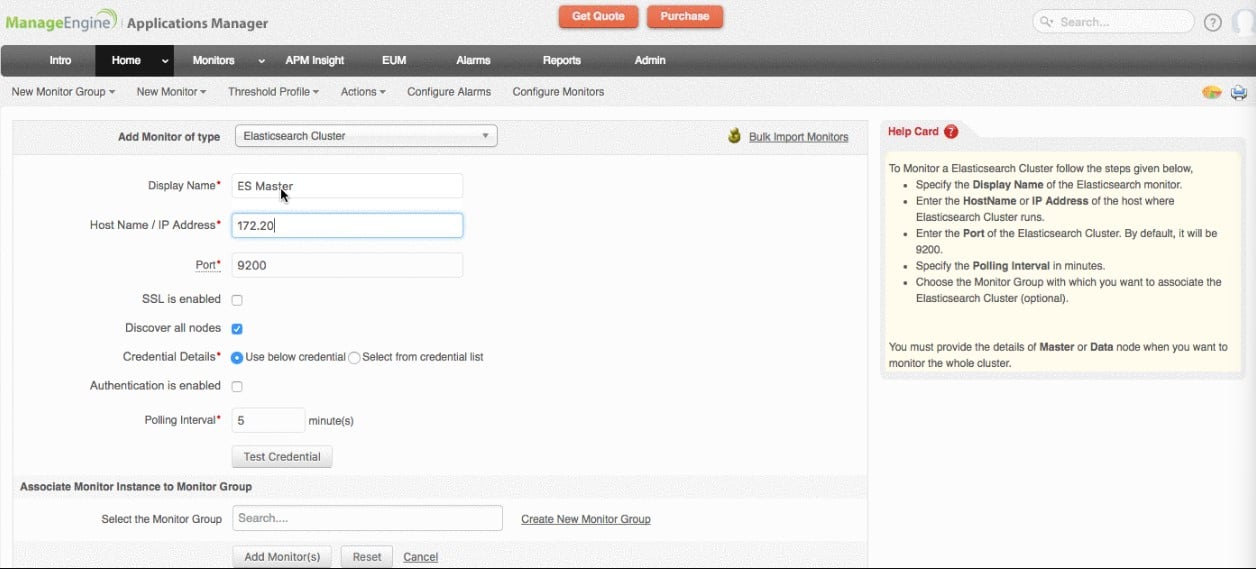
ManageEngine Applications Manager provides monitoring for software and services on-premises and on cloud platforms. The system is able to monitor a long list of software packages and can easily be set up to add new monitoring services. Elsadticsearch is one of the packages that the Applications Manager has integration for.
Key Features
- Applications dependency mapping
- Resource usage tracking
- Predictive alerts
After you activate the Elasticsearch extension, you will get an extra screen in the Applications Manager dashboard that shows the activity of your instance with respect to its database-style activities, such as indexing, sorting, and filtering. The system maintains a table of these statistics.
While tracking activity within the Elasticsearch instance, the service also looks at server resource activity. This identifies the CPU, memory, and disk access by the Elasticsearch instance and also looks at the total resource availability.
If other applications are running at the same time, they will also use up part of CPU and memory capacity. The Applications Manager system calculates the full requirements of all running processes and will predict if the system resources are about to run short.
The tool generates predictive alerts if it forecasts resource shortages. Those alerts appear in the Applications Manager console but you can also set up the system to send notifications to specific technicians. These can be sent by email, SMS, Slack message, or Service Desk ticket.
The Applications Manager system generates an application dependency map for your entire system. This can be particularly useful for Elasticsearch implementations, which can often be integrated into other applications. You might not realize that you have an Elasticsearch system running at the heart of one of the data management, security monitoring, or performance tracking systems you bought.
Pros:
- Monitors Elasticsearch on-premises or on the cloud
- Will monitor multiple instances of Elasticsearch simultaneously
- Reveals Elasticsearch instances that are embedded in other applications
- Customizable dashboard
- Free edition available
Cons:
- Not a SaaS package
ManageEngine offers three editions of Applications Manager. The first of these is the Free edition, which will monitor five assets. The Professional edition is sized for small businesses with a starting price of $395 per year – larger companies can pay extra for greater monitoring capacity. The top plan is called Enterprise and it is aimed at large, multi-site businesses. The base price for this edition is $9.595 per year.
The software for Applications Manager will run on Windows Server or Linux. The package is also available as a service on Azure Marketplace and AWS Marketplace. You can assess Applications Manager with a 30-day free trial.
4. Site24x7 – FREE TRIAL
Site24x7 is a cloud-based monitoring tool that has the ability to monitor database performance, server health, network statistics, and overall infrastructure insights. The platform is designed to make monitoring as out of the box as possible and features a host of templates for dashboards, reports, and alert profiles.
Key Features
- Flexible pricing
- Cloud-based monitoring
- Simple setup and deployment
Since the tool is hosted in the cloud, there are no lengthy installs or complex onboarding processes to get started. The agent just needs to be on the same network as your Elasticsearch engine, or on the same server, it is hosted on.
In terms of monitoring Elasticsearch Site24x7 has a simple integration that attaches to the default install agent that immediately gives the collector the ability to see and report conditions in your Elasticsearch environment.
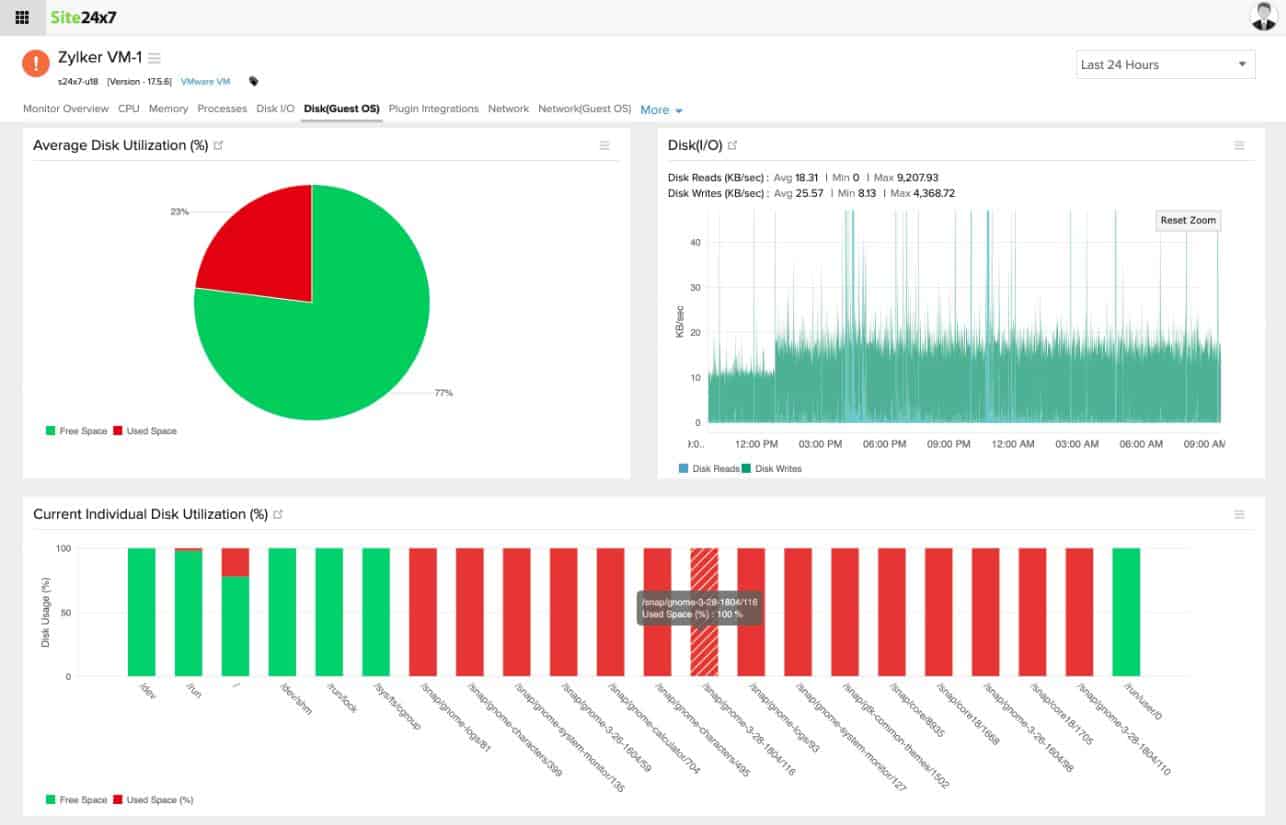
Performance metrics like active and initializing shards, as well as node and cluster information, are made available through a centralized home screen where you can completely customize the look at feel for your real-time monitoring view.
Since Elasticsearch depends on the machine it's installed on, the Site24x7 agent can collect information about the server environment where Elasticsearch is installed. CPU usage, memory, allocation, and disk i/o are all able to be recorded and reported back to the main dashboard.
Since Site24x7 is so flexible the same agent can be used to monitor other areas of the network, making the platform a great fit for organizations who are looking to develop a holistic monitoring strategy across all of their assets.
Pros:
- Flexible cloud-based monitoring option
- Offers a host of out-of-box monitoring options and dashboard templates for SQL server
- Allows administrators to view dependencies within the application stack, good for building SLAs and optimizing uptime
- Offers root cause analysis enhanced by AI to fix technical issues faster
- Can unify SQL monitoring across multi-cloud environments
Cons:
- Site24x7 is a feature-rich platform with options that extended beyond databases management, may require time to learn all options and features
Pricing for Site24x7 is subscription-based and starts at $35.00 per month for application monitoring when paid annually. This package up to 500MB of log storage, third-party integrations, and monitoring of up to three different applications.
Any additions you may need like more log storage, or additional servers are offered as à la carte add ons, meaning you’ll never get stuck paying for a package deal with features you never intend on using. You can start with a 30-day free trial.
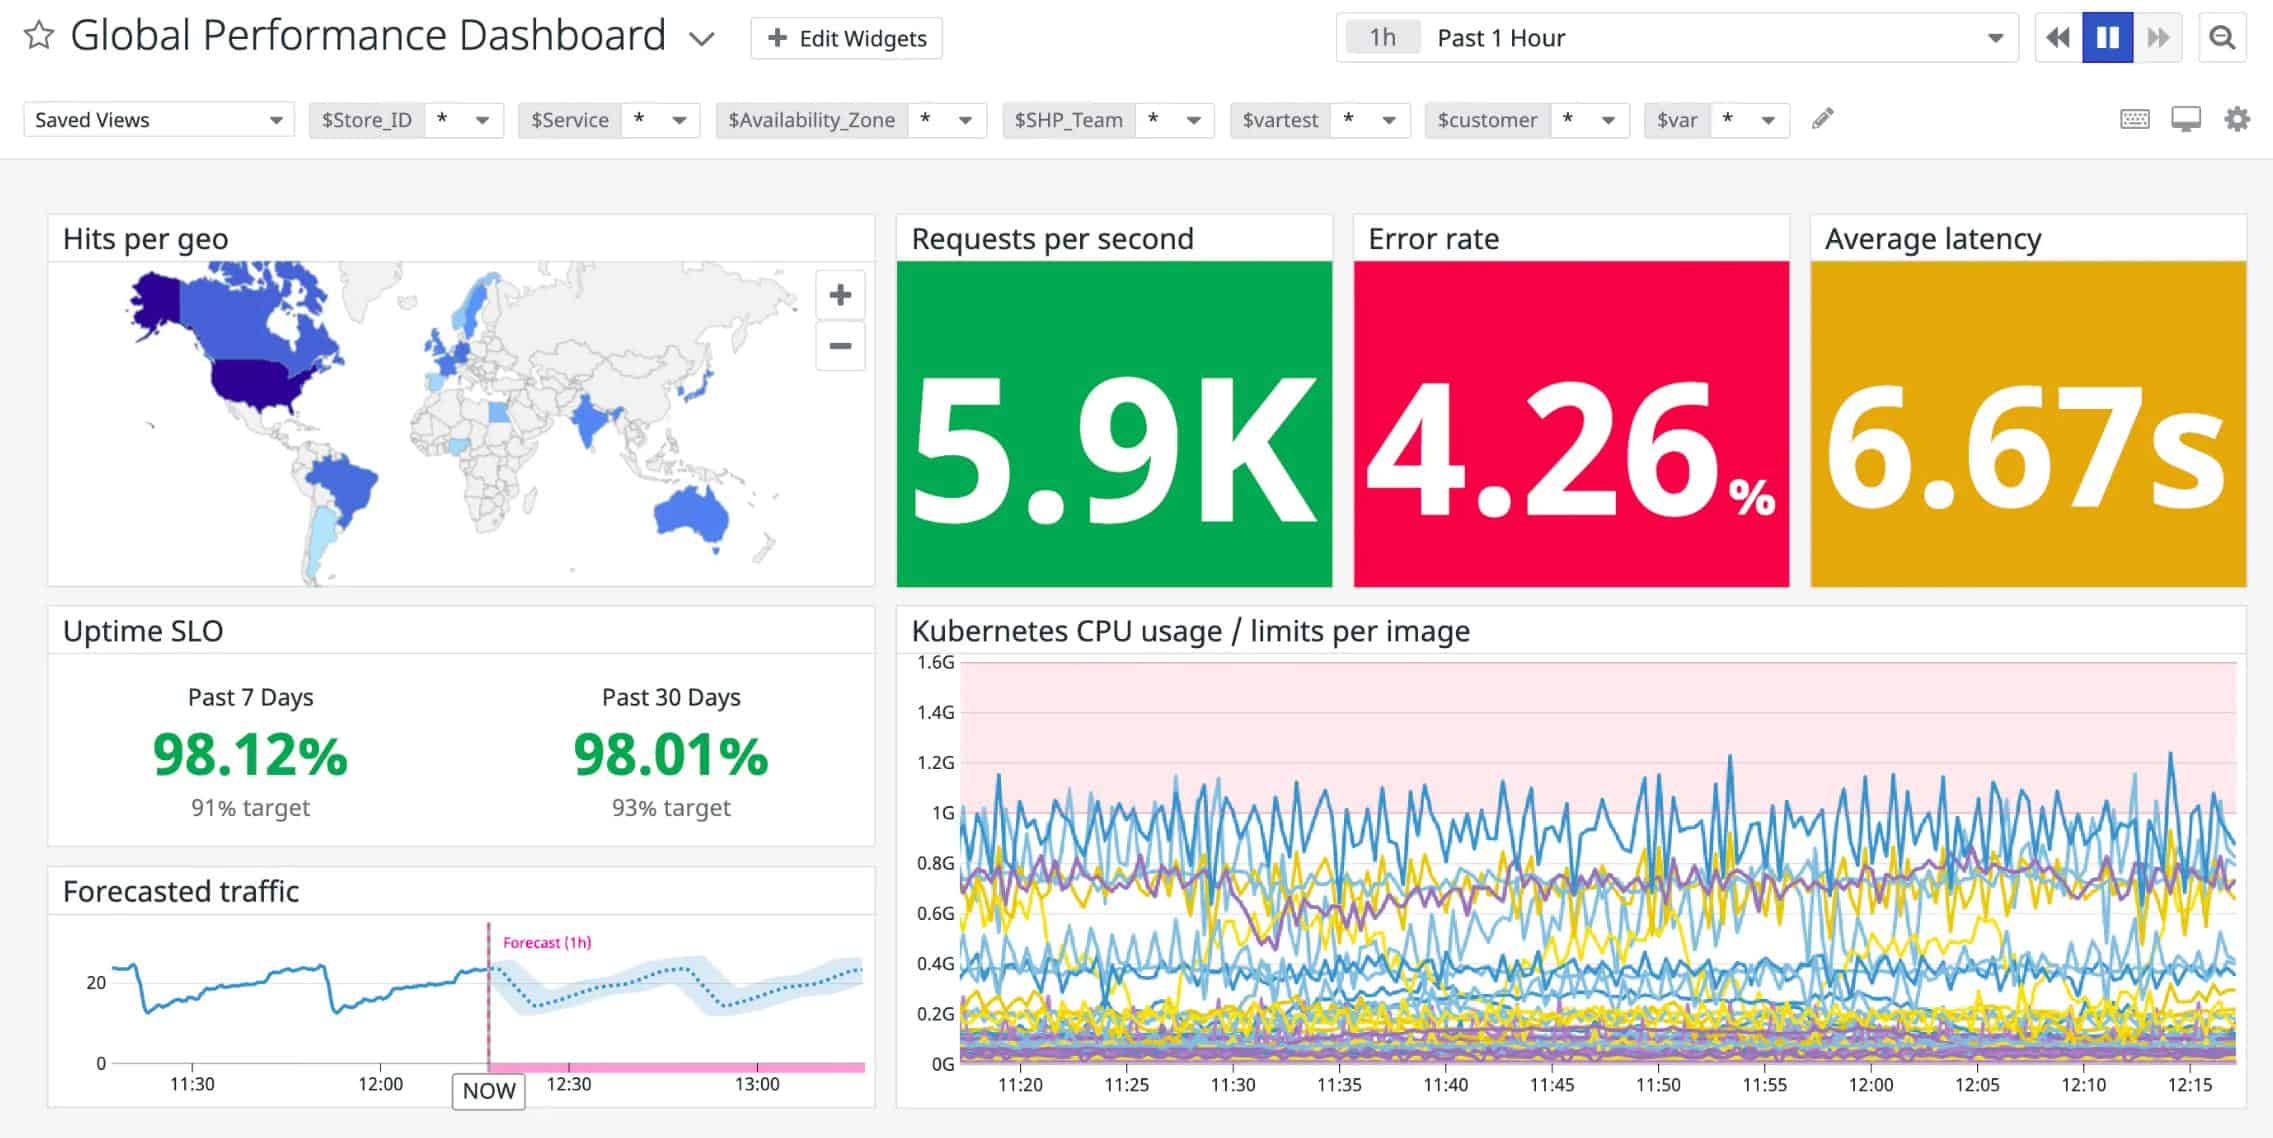
5. Datadog
Similar to Site24x7, Datadog offers an entire cloud-based suite of monitoring tools to measure metrics from servers, applications, and entire network infrastructures. Datadog agents can be configured in a number of different ways to monitor many different environments, including Easticsearch engines.
Key Features
- Intuitive dashboards
- Builtin correlation tools
- Simple alert workflows
The platform aims to create as many out-of-the-box features as it can, coming complete with templates for reports, alert monitors, and dashboards. All dashboard views can be customized through a simple widget editor. Once configured, they can be saved and shared with individuals, or entire teams.
The monitor can measure specific health metrics around certain queries, or the real-time and performance metrics around clusters. The integration includes a log processing element that automatically searches your Elasticsearch log files for relevant events and information. That information is then pulled into a central dashboard where it can be visually displayed, and compared against your past performance, or current SLAs.
For alerts, you can set notifications based on threshold or condition, and tie them to events that either impact Elasticsearch itself, or its supporting environment. Nodes can be tagged for smarter more targeted alerts, which is especially helpful in larger clusters. Some of the most common alerts are garbage collection time and latency thresholds. These conditions are easily tied to actions such as a notification or remediation event.
Pros:
- Has an excellent interface, easy to use, and highly customizable
- Cloud-based SaaS product allows monitoring with no server deployments or onboarding costs
- Can monitor both internally and externally giving network admins a holistic view of network performance and accessibility
- Supports auto-discovery that builds network topology maps on the fly
- Changes made to the network are reflected in near real-time
- Allows businesses to scale their monitoring efforts reliably through flexible pricing options
Cons:
- The trial could be longer
Pricing for Datadog APM starts at $31.00 per host, per month and includes trace correlation as well as historical and live log analysis. You can test out Datadog completely free through a 14-day trial.
6. Dynatrace
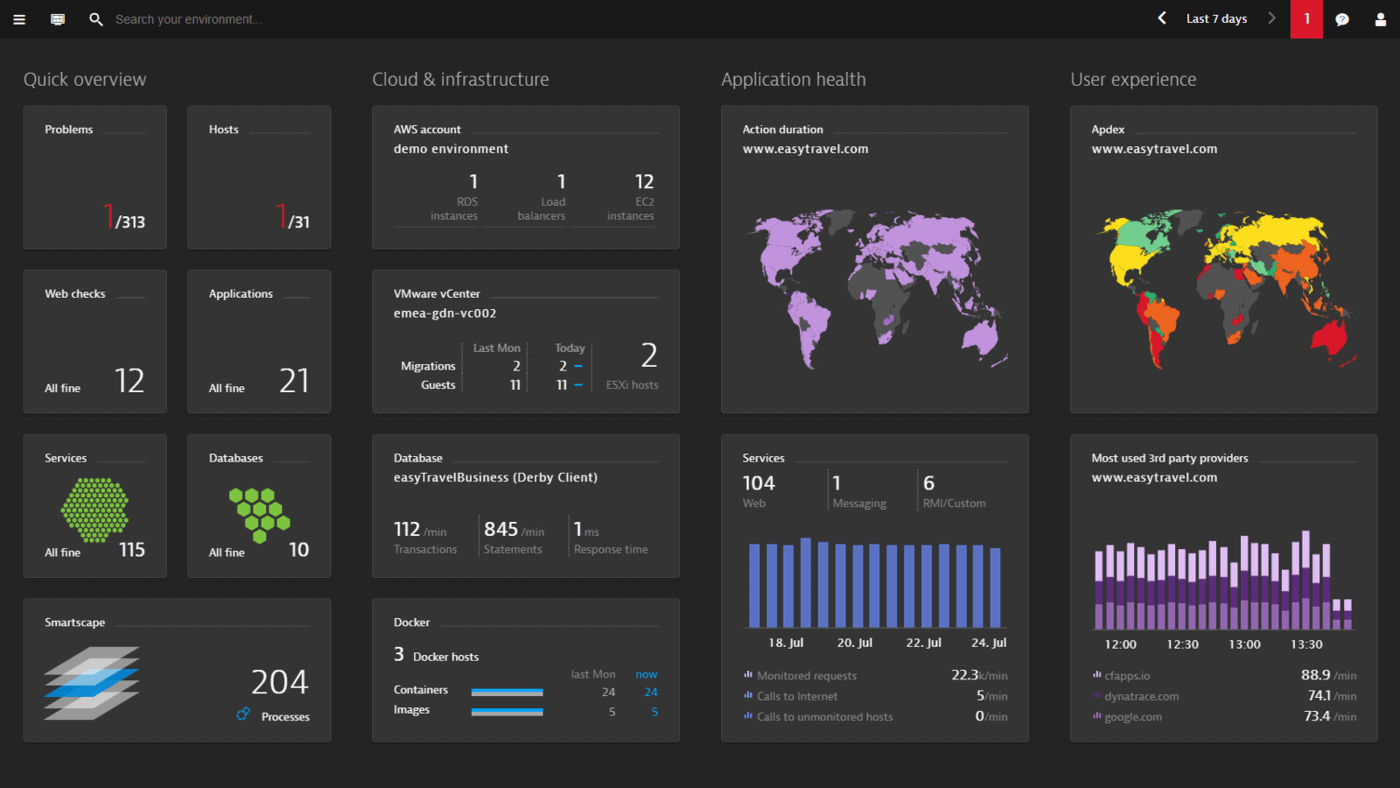
Dynatrace combines AI-powered features with detailed troubleshooting tools that support monitoring for a multitude of environments including Elasticsearch engines. Dynatrace takes a minimalist approach to its user interface which helps prevent developers from being overwhelmed when managing multiple clusters, databases, and servers for enterprise environments.
Key Features
- Autodiscovery
- AI-powered monitoring
- Root cause analysis
Once the agent is running, you’ll start off with a high-level look into the components of your Elasticsearch clusters, and be able to drill down into the query level quickly to find problem nodes, and ultimately the bottleneck. The drill-down feature is paired with intelligent root cause analysis that scans the node and helps guide the user to exactly where the issue is stemming from.
The agent utilizes an auto-discovery feature that can automatically track new individual nodes or clusters, and gather metrics about them. Insights on active, unassigned, or relocating shards are all captured and reported to the main dashboard. Metrics focused on the indexing time, number of total queries, and total search time can paint a picture into the performance of each node and allow sysadmins to have a more granular look into their Elasticsearch environments.
Dynatrace is constantly applying AI-powered monitoring tools to your Elasticsearch engine to provide continuous monitoring, root cause analysis, and maps of impacted dependencies. The platform was built to serve larger organizations and features over 500 different integrations into third-party technologies.
Pros:
- Can secure and monitor complicated Google Cloud/hybrid cloud environments with ease
- Sleek, customizable interface – great for NOCs
- Real-time LAN and WAN monitoring that supports virtual environments, great for MSPs and large enterprise networks
- Leverages AI to detect trends and monitor baseline performance
Cons:
- Dynatrace is better suited for larger networks and enterprise organizations
- Would like to see a longer trial
Pricing for Dynatrace full-stack monitoring starts at $69.00 per month when billed annually and includes 8GB of data per host.
You can test out Dynatrace for free through a 15-day trial.
7. Opsview
Opsview offers multiple solutions for monitoring the cloud, network, server, and infrastructure for many different organizations. The Opsview agent is flexible and can be configured to monitor many different applications. Many integrations are built into the platform through what the company calls Opspacks.
Key Features
- Plug and play integration for Elasticsearch
- Automation
- On-premises and cloud options
These Opspacks contain pre configurations that allow you to start monitoring your Elasticsearch engine quickly without any custom coding or set up. The agent can monitor virtually all metrics pertaining to Elasticsearch through a series of service checks that can then be paired with alerts or action if their conditions reach specific thresholds.
The Opspacks are convenient because they also include dashboard and alert templates that are tailored to Elasticsearch environments. These are designed to be ready to use right away but can be modified and changed after deployment.
Metrics like JVM uptime, filesystem capacity, average load, and memory usage are all captured and then reported back to the Opsview dashboard for analysis. Opsview has a number of automation features that can be paired with scripts or alert notifications to ensure the right person or team is notified of specific conditions.
For example, automation can be set up to monitor a service check. If that service has stopped you can fire off automation that results in a ticket being generated to the NOC team, or an SMS/email being sent to a support technician. Scripts can also be triggered in the same way where rather than using a notification, a script will attempt to restart the service.
The nice part of the automation feature is that it can be as simple or as complex as you make it, and uses simple workflows to help admins visualize their automation chains.
Pros:
- Supports J-Flow, NetFlow, and sFlow monitoring.
- Clean, easy-to-use interface
- Part of Opspack that comes with valuable tools for sysadmin
- Supports a free and paid version
Cons:
- Better suited for sysadmin looking for a full toolset with Elasticsearch
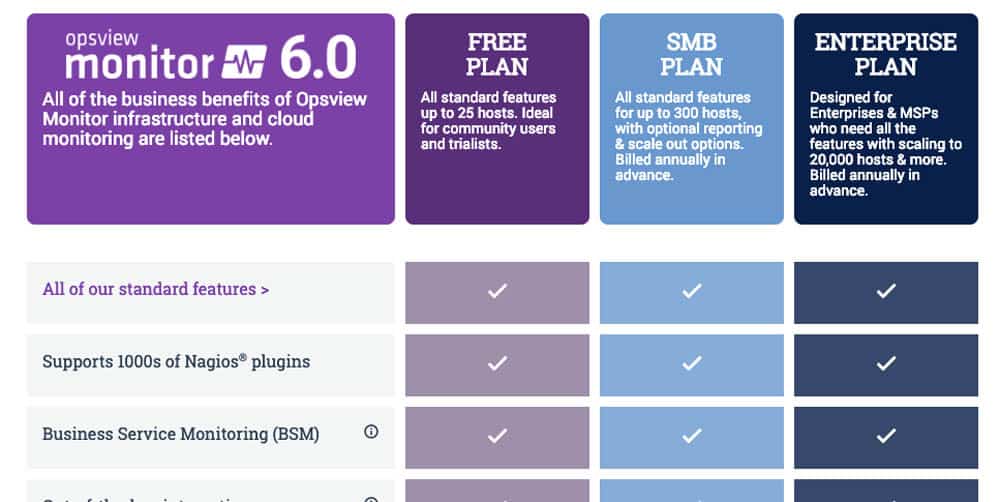
Opsview has three pricing tiers, SMB, Enterprise, and Opsview Cloud. Pricing for SMB starts at $1300 for 50 hosts and is designed for organizations who plan on using less than 300 hosts on-premises.
Its enterprise tier is for organizations who need more than 300 on-premises hosts, while its cloud tier is geared for companies of any size.
You can request a demo of Opsview to try out on your network.
8. ElasticHQ
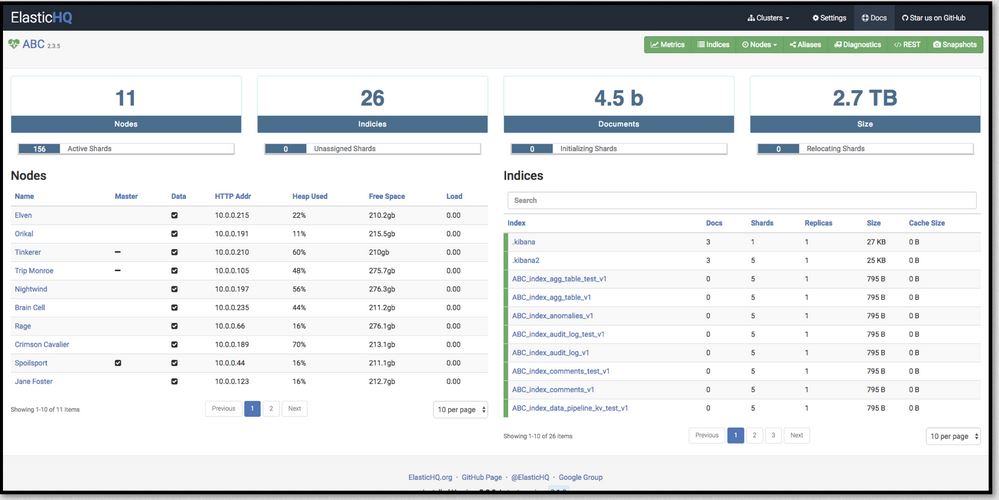
ElasticHQ is an open-source application that features a number of different tools solely focused on monitoring and improving the observability of Elasticsearch. It works by pulling logs, performance metrics, and APM traces together into a single dashboard and using a series of visualizations and troubleshooting tools to gain insight into your engine.
Key Features
- Open-source
- Version agnostic monitoring
- Real-time analytics
It features real-time monitoring into each cluster node, revealing configurations, metrics, live threads, and data streams across all of Elasticsearch. ElasticHQ can integrate and run on all major releases and versions of Elasticsearch and frequently tests on all new releases to ensure compatibility.
The platform does an excellent job of helping Elasticsearch admins view their data and insights without having to dig through JSON files or mess with REST requests. Information on nodes, dependencies, mappings, and clusters is automatically translated into simple visualizations that allow admins to view the performance and health of even the largest Elastic nodes at a glance.
The installation of ElasticHQ is straightforward and only takes a few minutes to set up. Once complete, insights can be viewed from any browser, giving you the option to manage or monitor clusters from anywhere with an internet connection.
The installation runs as a standalone component, meaning even if clusters go down or lose connectivity, ElasticHQ will continue to run and is not directly tied to the clusters it monitors. This is a solid option for anyone looking to use an open-source tool for Elasticsearch monitoring but lacks network and infrastructure monitoring capabilities which can leave a blind spot in your monitoring efforts if issues stem from beyond Elasticsearch itself.
Pros:
- Simple interface that is easily customizable
- Features metrics and monitors specifically for Elasticsearch
- Back-end API make a wide range of integrations possible
Cons:
- Open-source tools often rely on community bug fixes and support – not the best option for enterprises looking to move quickly
There is no official support for ElasticHQ, and much of the support you will find is from the ElasticHQ community. The platform is completely free to use.
9. Paessler PRTG
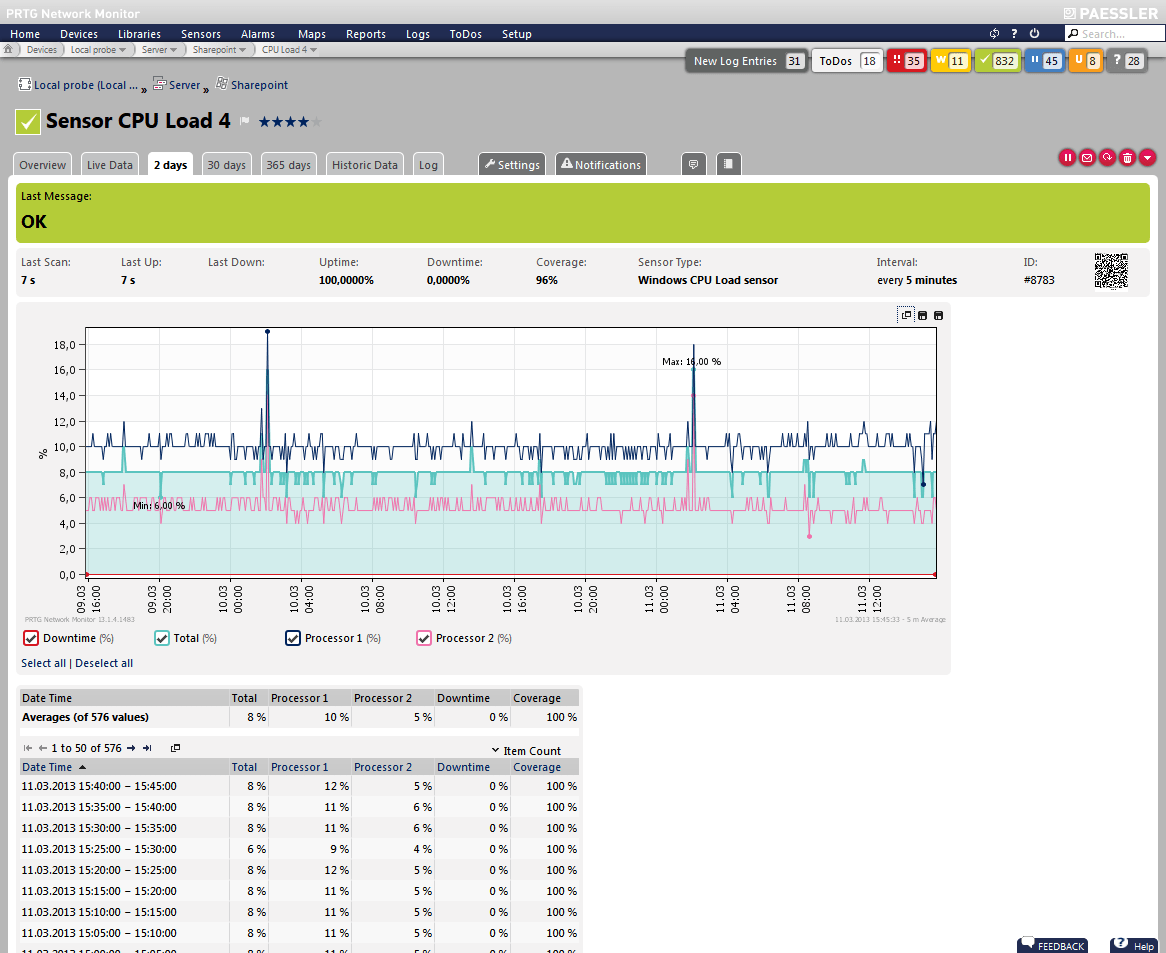
Paessler PRTG offers custom monitors that can be set up to pull metrics from virtually any environment. While there is no dedicated premade sensor for Elasticsearch at this time, we feel PRTG still deserves a mention.
Key Features
- Customizable monitoring sensors
- Network, application, and infrastructure monitoring
- Simple dashboards
Small deployable sensors can be set to monitor Elasticsearch logs and pull those events into the PRTG dashboard. That same agent can also be deployed on the supporting infrastructure, server, or container where Elasticsearch operates to provide total visibility across the business.
Since PRTG sensors are so highly customizable, admins can spend a bit of time configuring a sensor for their exact needs, ensuring only the metrics that they want to monitor are captured. This is useful for situations when logs need to be kept for long periods of time, but space is limited.
Pros:
- Uses a combination of packet sniffing, WMI, and SNMP to report network performance as well as discover new devices
- Autodiscovery reflects the latest inventory changes almost instantaneously
- Drag and drop editor makes it easy to build custom views and reports
- Supports a wide range of alert mediums such as SMS, email, and third-party integration
- Supports a freeware version
Cons:
- Is a very comprehensive platform with many features and moving parts that require time to learn
Pricing for PRTG is dependent on the number of sensors you deploy. The smallest tier currently offers 500 sensors across one server for $1750.
Which Elasticsearch monitoring tool is right for you?
No matter where your Elasticseach engine lives, or how many clusters you have, SolarWinds Server & Application Performance Monitor has proven itself to be one of the simplest and most reliable ways to monitor not only your Elasticsearch environment but your entire supporting network and infrastructure.
SolarWinds Server & Application Performance Monitor combines simple out-of-the-box monitoring capabilities that ensure there are no blind spots. When performance issues do arise, you’ll know exactly where to start looking to get it resolved.
For those looking for monitoring strictly related to only Elasticsearch, ElasticHQ offers an open-source option of monitoring that is supported by a community forum and a handful of developers.
How do you currently monitor Elasticsearch? Do your monitors cover infrastructure and the network as well? Let us know in the comments below.
Elasticsearch Monitoring Tools FAQs
What are some common metrics to monitor in Elasticsearch?
- Cluster health and status
- Node availability and performance (CPU, memory, disk usage, etc.)
- Indexing and search rates
- Query latency and throughput
- Shard allocation and balancing
What are some tools for Elasticsearch monitoring?
- Elasticsearch's built-in monitoring features (including the monitoring APIs and Kibana dashboards)
- Third-party monitoring tools such as Elastic Stack (formerly known as ELK Stack), Grafana, or Prometheus
- Cloud-based monitoring services such as Amazon CloudWatch, Google Cloud Monitoring, or Microsoft Azure Monitor
How can I set up Elasticsearch monitoring?
You can set up Elasticsearch monitoring using Elasticsearch's built-in monitoring features or a third-party monitoring tool. You will typically need to install and configure monitoring agents on your Elasticsearch nodes, configure monitoring settings in the Elasticsearch configuration file, and set up dashboards or alerts to track performance metrics.
How often should I monitor Elasticsearch?
The frequency of monitoring will depend on the size and complexity of your Elasticsearch cluster and the criticality of the data and services it supports. In general, you should monitor Elasticsearch continuously or at least every few minutes to ensure timely detection of issues.
What are some common issues that Elasticsearch monitoring can help identify?
- Slow or inefficient queries
- High resource usage on individual nodes or across the cluster
- Unbalanced or misconfigured shards
- Network connectivity or firewall issues
- Disk space or memory constraints.
Related Post: Best Network Troubleshooting Software

