
Our funding comes from our readers, and we may earn a commission if you make a purchase through the links on our website.
The Best CPU Temperature Monitors
UPDATED: October 31, 2023
CPU temperature monitoring is a contentious issue because different processors have different operating temperature ranges. So, recording the temperature of your processor isn’t enough. You also need to know what is considered a safe temperature for that particular make and model. Adding to the confusion, there are different expectations for each processor type, depending on the amount of load on it. Furthermore, a CPU contains several cores and each of those has an individual temperature to record.
When you are looking for a CPU temperature monitor, you should focus on those systems that set performance thresholds and will notify you if the CPU temperature goes above that level. A well-calibrated CPU temperature monitor that can adjust its warning thresholds according to the processor model will save you the time of having to attend to false alarms.
Here is our list of the best CPU temperature monitors:
- SolarWinds Server & Application Monitor – FREE TRIAL An excellent application monitor that has extensive server hardware checks that include CPU temperature monitoring. Installs on Windows Server but can monitor other servers across a network, including those running Linux. Start a 30-day free trial.
- ManageEngine OpManager – FREE TRIAL This monitoring package covers servers and network devices and it can check on the temperature of each of those pieces of equipment. It installs on Windows Server and Linux and can monitor other servers apart from the host by reaching across the network. Download a 30-day free trial.
- Site24x7 A collection of system monitoring tools that includes CPU monitoring in its network monitoring for network devices and for servers in its Server monitoring module. This is a cloud-based system.
- Datadog This tool is able to monitor CPU temperature on a range of devices, including IoT equipment. This is a cloud-based service.
- Atera A cloud-based package of support software for managed service providers that includes hardware monitoring, such as CPU temperature checks.
- Nagios XI This monitoring system can be extended by free plugins and there are a number of these that include CPU temperature monitoring capabilities. It installs on Linux or on Windows Server over a hypervisor.
- SpeedFan This handy free tool covers a number of hardware statuses including fan speed and CPU temperature. Use it to feed data into your system monitor. It installs on Windows.
Although many IT managers practice a “best of breed” policy when buying monitoring software, getting a specialist monitoring tool to just track CPU temperature is probably going a little too far down that path. A better idea is a monitor that will track several indicators of CPU health simultaneously. For example, as has already been mentioned, it is a good idea to track the fan performance alongside CPU temperature.
Another good combination of factors to monitor alongside CPU temperatures is the number of active processes together with total processing demand. If you can get a CPU monitor that shows a range of factors all on one screen it is a lot easier to get a quick visual tip on what is going wrong.
Clearly, monitors that have graphical interpretations of CPU statistics are much easier to comprehend than those that show metrics as numbers. Color-coded dials are even better. With these recommendations in mind, we have looked for the best options of CPU monitor among tools that excel at server resource monitoring.
What is the maximum temperature on a processor?
Processors have their own on-board thermometers and they will start to take evasive action once the temperature gets too high. This level is actually very high and is usually a lot higher than the expected temperature for normal operations.
Intel calls the temperature level that will trigger action the TJunction, which is also called TJ Max. When a CPU’s temperature hits the TJunction, the processor triggers its thermal control system. It doesn’t shut down. Instead, it lowers the frequency of its actions, which means it slows down. It will also throttle the power running into the chip. However, a lower operating frequency places lower demand on the power supply, so those two actions are two sides of the same coin.
There is a gap between what is considered normal temperature and the level that the CPU will start to shut down. For example, on an Intel i7 processor, the normal temperature during full load is between 50 and 65 degrees Celsius but its TJ Max is 100 degrees Celsius. That creates a gray area because regularly running at high temperatures below TJ Max can cause long-term physical damage incrementally.
Short spikes in temperature shouldn’t do too much damage. However, if the temperature frequently runs higher than expected, while also keeping below TJ Max, elements within the processor can be damaged, possibly causing deterioration in the connections between them. Those damaged connections could result in more overheating and possibly arcing, leading to a loss of bits in the traffic within the processor and emergency shutdowns.
So, if your CPU runs at a high temperature for a long time, you could later find it shutting down for no apparent reason even during periods when it is not running hot. Basically, at that point, the processor is effectively ruined and needs to be replaced.
Monitoring CPU temperature
The processor will take care of spotting its TJunction temperature. However, you don’t want matters to get to that point. You also don’t want the temperature to run above the recommended levels into that gray area too often.
It is also a good idea to twin CPU temperature monitoring with server or rack fan speed monitoring. It could be that your CPU has started to heat up because the fan is not identifying high temperatures properly or has completely broken down. So, monitoring the fan provides you with an immediate answer should your CPU temperature rise. If your fan is working fine and the CPU overheats, then you have a bigger problem to work on.
The Best CPU Temperature Monitors
1. SolarWinds Server & Application Monitor – FREE TRIAL
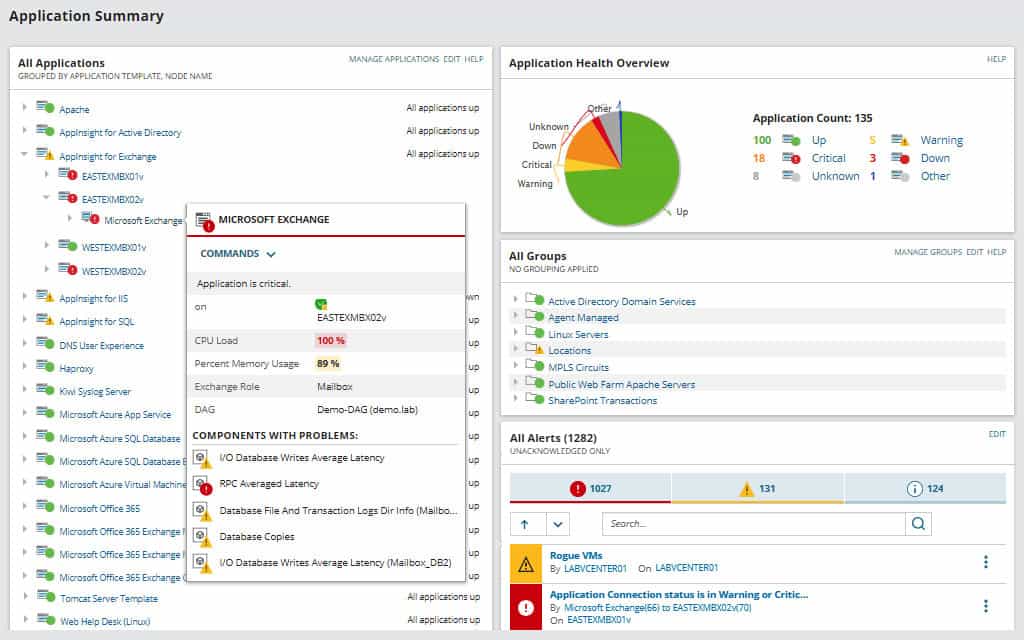
SolarWinds Server & Application Monitor is highly rated for supervising application performance. However, it is also a really excellent server monitor.
The software for this package installs on Windows Server but the monitor doesn’t just track the performance of the server that hosts it. It can supervise the performance of other servers across the network and that includes servers running Linux and various flavors of Unix.
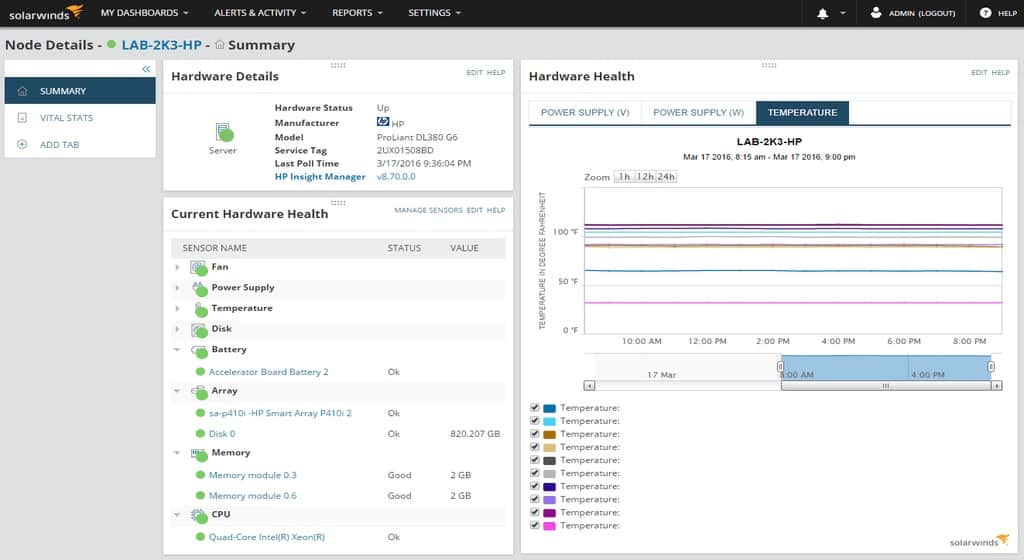
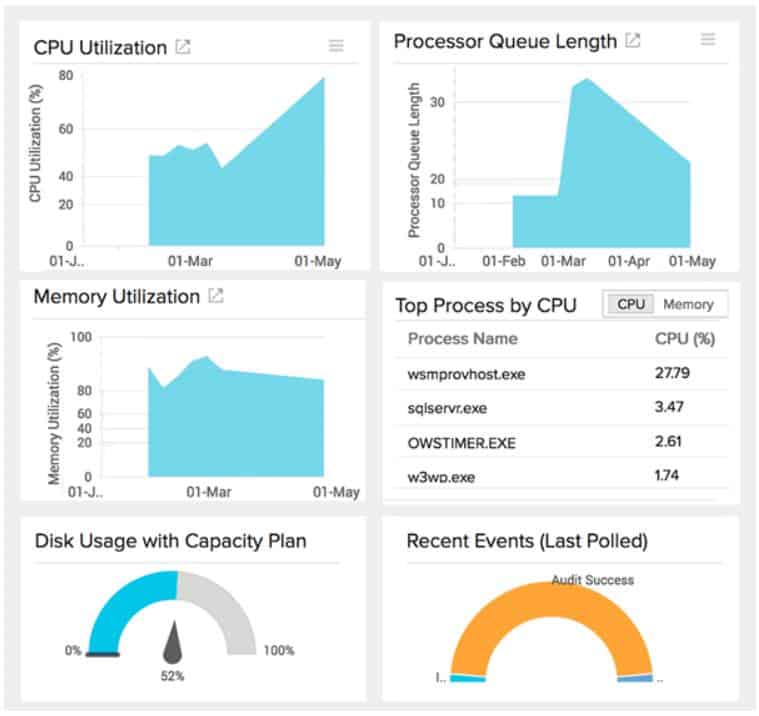
The hardware monitoring screen of the Server & Application Monitor dashboard is well organized even though it crams access to a lot of different statistics into a small space. A small file hierarchy panel on the left of the screen allows you to select metrics to show in a graph panel on the right of the screen. You can select several metrics and then switch between their graphs of live performance data through a tabbed interface.
The live statistics are shown in a time series and you can adjust the time frame to get greater detail or a longer timeline. The screens give you a lot of different stats and all can be shown as color-coded charts and graphs. This makes rapid problem correlation really easy to perform manually. There are also screens that show both application and server statistics side by side.
There is an alerting system built into the monitor that you are allowed to customize. Each monitored metric, such as CPU temperature has a performance threshold on it. These levels can be adjusted and it is also possible to create combined alerts from several different live statistic monitors.
Pros:
- Designed with large and enterprise networks in mind
- Supports auto-discovery that builds network topology maps and inventory lists in real-time based on devices that enter the network
- Has some of the best alerting features that balance effectiveness with ease of use
- Supports both SNMP monitoring as well as packet analysis, giving you more control over monitoring than similar tools
- Uses drag and drop widgets to customize the look and feel of the dashboard
- Robust reporting system with pre-configured compliance templates
Cons:
- Designed for IT professionals, can take time to fully explore the platform
SolarWinds Server & Application Monitor is available for testing through a fully functional 30-days free trial.
2.ManageEngine OpManager – FREE TRIAL
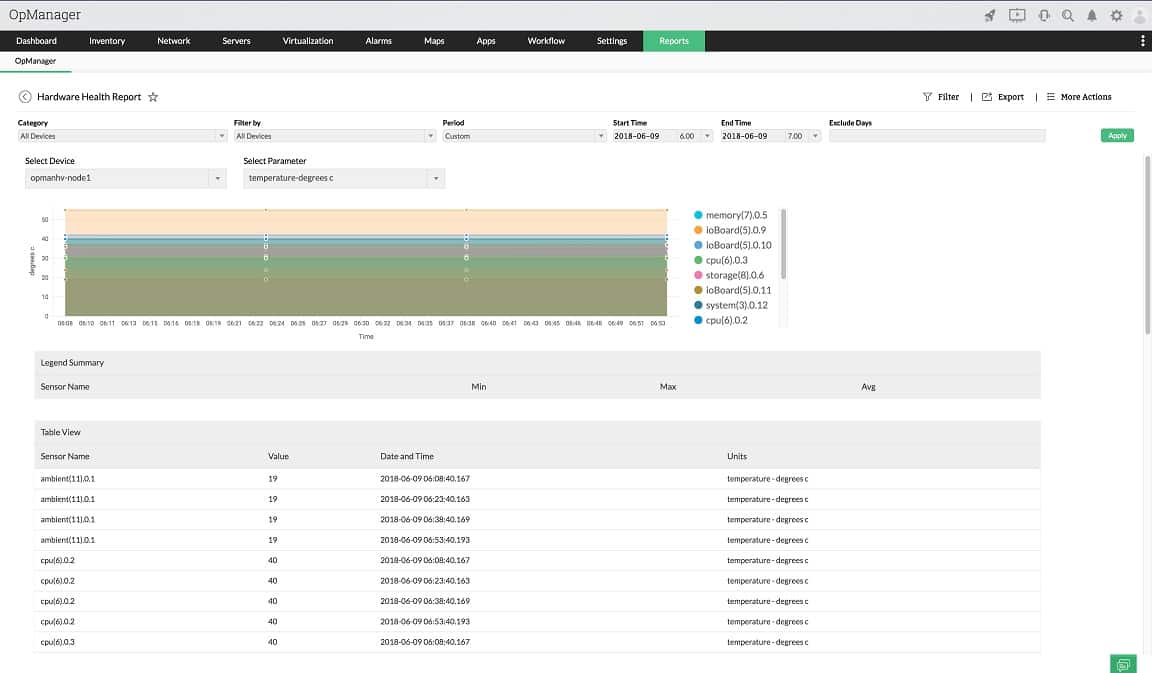
ManageEngine OpManager is a good choice for those who are specifically looking for a system to check hardware statuses on all devices because it covers networks and servers. The network monitoring features of this service focus on network device performance. This is strongly based on SNMP information and that feedback includes live reports on device CPU temperature. The server monitoring section of OpManager also reports on CPU temperature.
OpManager isn’t exclusively a hardware monitor. It also keeps track of the activities of those devices. For example, it will show you live activity on your network, and for servers, you will see all of the resource usages as it happens. This is great for operations technicians because they don’t have to switch between applications in order to carry out all of their system monitoring duties.
Pros:
- Designed to work right away, features over 200 customizable widgets to build unique dashboards and reports
- Features traffic management options alongside DPI tools
- Uses intelligent alerting to reduce false positives and eliminate alert fatigue across larger networks
- Supports email, SMS, and webhook for numerous alerting channels
- Can set up SLAs based on network, application, or process.
Cons:
- Is a feature-rich tool that will require a time investment to properly learn
The system includes performance thresholds that trigger alerts if crossed and those alerts can be sent out as notifications by SMS or email. The software for ManageEngine OpManager installs on Windows Server or Linux and you can get a 30-day free trial.
3. Site24x7
Site24x7 is a cloud-based service that includes network, server, and application monitors. The types of monitors you get depend on the package that you choose. Each plan is tailored towards a particular category of IT resources, such as websites, applications, and infrastructure. However, network and server monitoring are included in all of these packages.
The network monitoring feature of Site24x7 includes the collection and display of data circulated through the Simple Network Monitoring Protocol (SNMP). The SNMP service provides a lot of information on network device statuses and activities and CPU temperature is one of the factors reported in this format.
Not every device fills out the CPU temperature field. In those cases, you can get an idea of CPU safety by looking at the CPU capacity and load instead.
Server CPU temperatures can be measured in two ways – either through SNMP or, for Windows versions, through the WMI system.
While giving you information on server and network device statuses, such as CPU temperature, the Site24x7 system provides insights into many other IT resource activity. All of this system monitoring information is available in a single browser-based dashboard. The system also includes performance thresholds that are automatically adjusted through a machine learning technique. When those thresholds are crossed. Site24x7 raises an alert.
Pros:
- One of the most holistic monitoring tools available, supporting networks, infrastructure, and real user monitoring in a single platform
- Uses real-time data to discover devices and build charts, network maps, and inventory reports
- Is one of the most user-friendly network monitoring tools available
- User monitoring can help bridge the gap between technical issues, user behavior, and business metrics
- Supports a freeware version for testing
Cons:
- Is a very detailed platform that will require time to fully learn all of its features and options
Site24x7 includes CPU temperature monitoring with complete system-wide performance tracking. Get a 30-day free trial.
4. Datadog
Datadog is a cloud-based system that includes monitors for servers and networks. There are also monitors for application and website performance.
The server and network monitors in Datadog are able to reach out to cloud resources across the internet as well as check on servers and network devices locally. The system has the capability to include remote sites in the monitoring service as well. Another useful capability in Datadog is the tracking of IoT devices and wireless network APs.
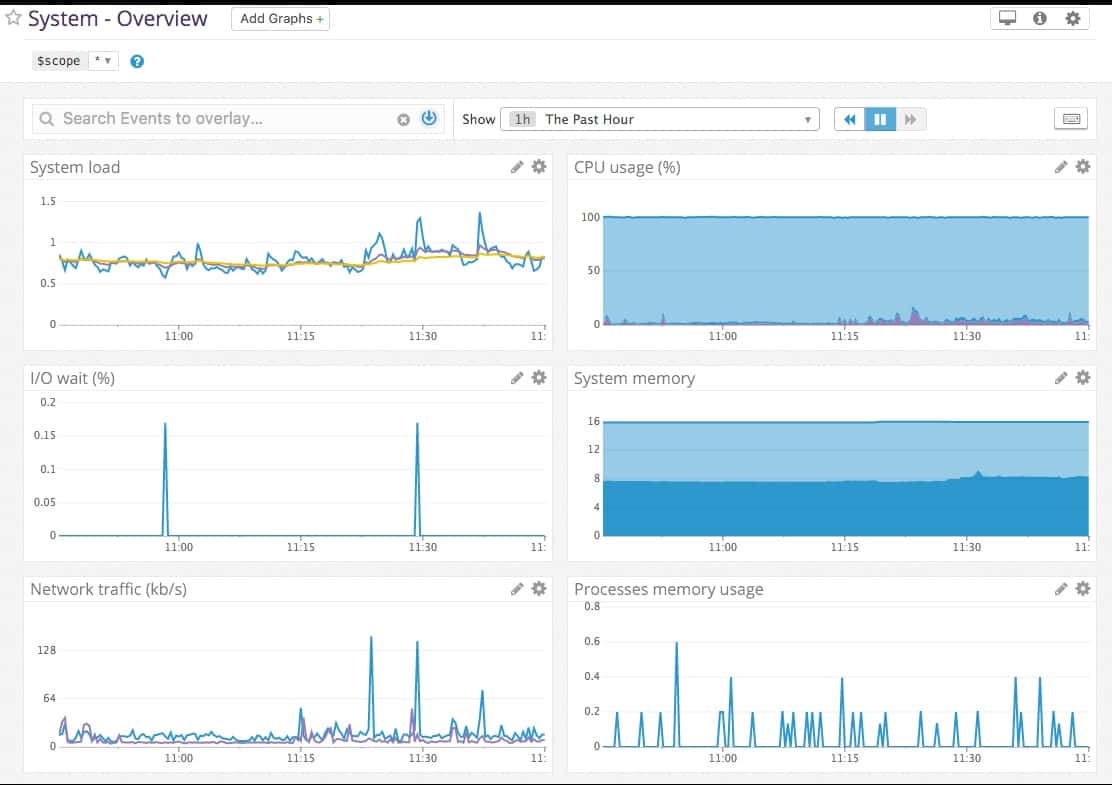
The Datadog system will monitor CPU temperature data where it is made available through WMI or SNMP. Many IoT device status messaging systems also include CPU temperature data. With Datadog, it is also possible to customize metrics tracking through the backend to add CPU temperature monitoring.
Pros:
- Easy-to-use customizable dashboards
- Cloud-based SaaS product allows monitoring with no server deployments or onboarding costs
- Can monitor both internally and externally giving network admins a holistic view of network performance and accessibility
- Supports auto-discovery that builds network topology maps on the fly
- Changes made to the network are reflected in near real-time
- Allows businesses to scale their monitoring efforts reliably through flexible pricing options
Cons:
- Would like to see a longer trial period for testing
The Datadog interface includes alerts with performance thresholds that are based on machine learning baselines. This system will send out alerts as notifications via email or collaboration system, such as Pagerduty or Slack. You can access a 14-day free trial.
5. Atera
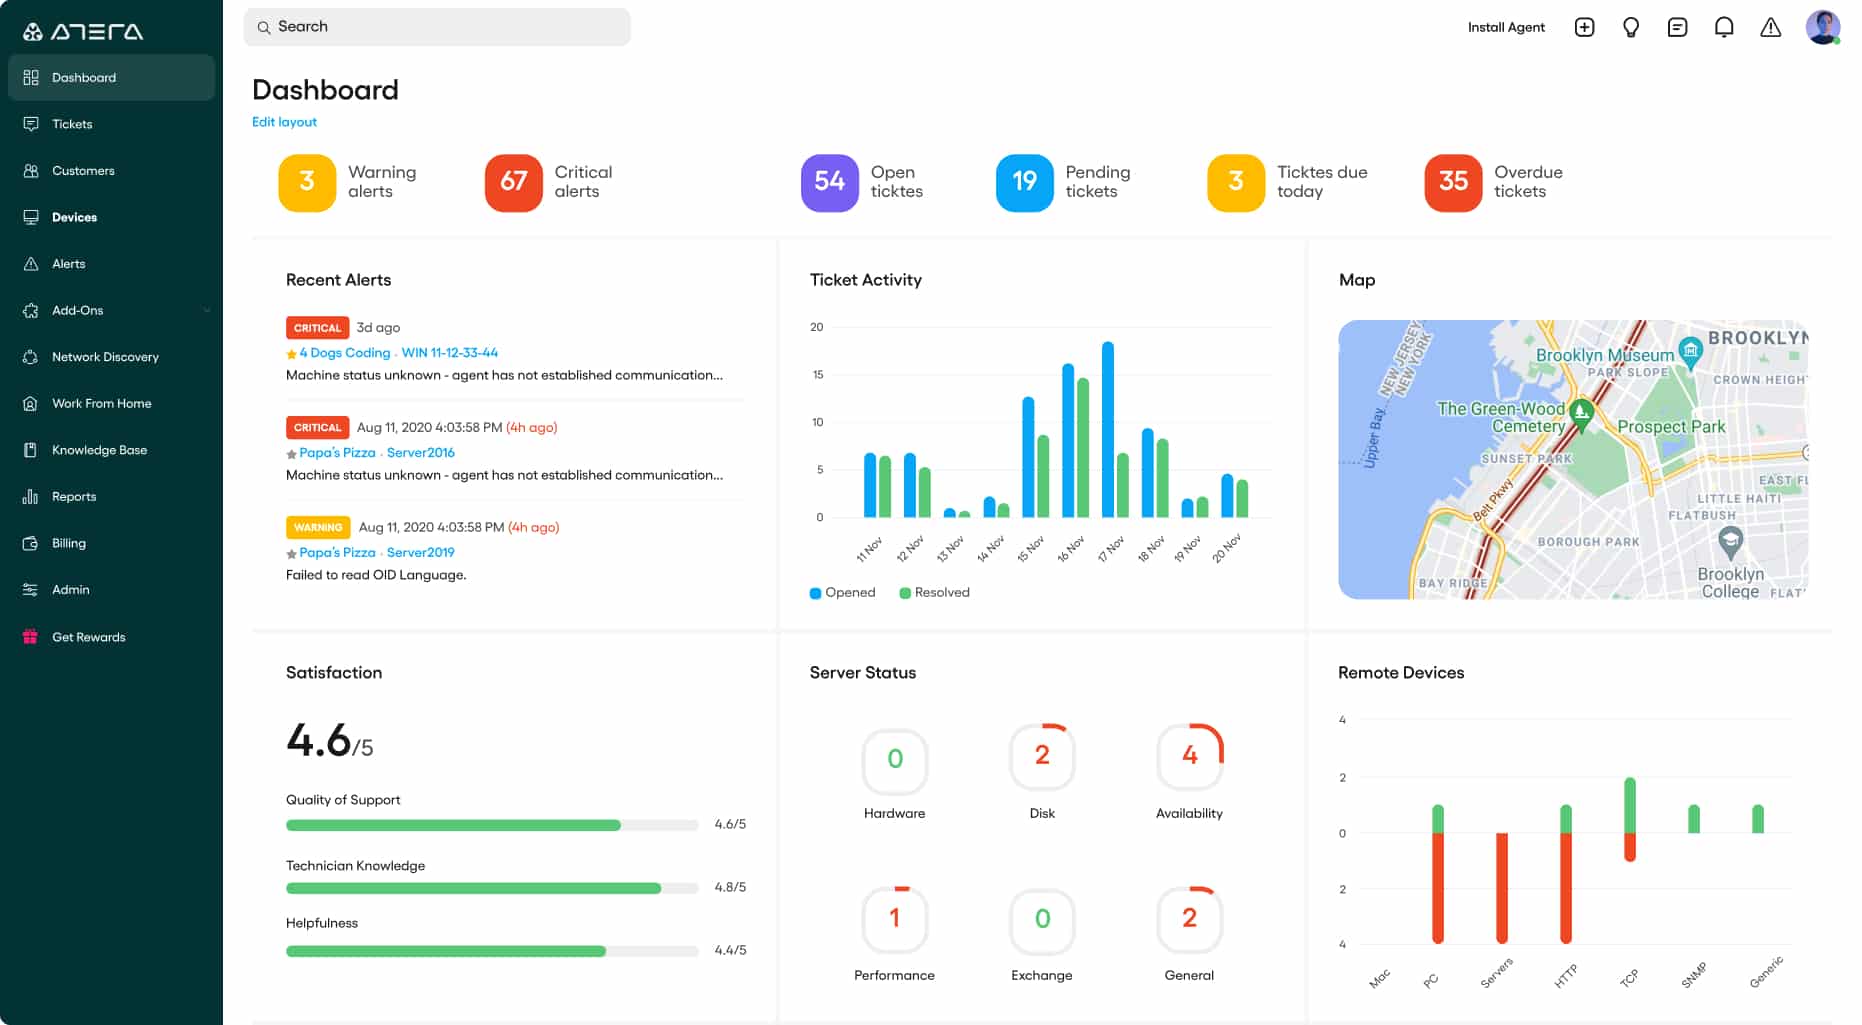
Atera is a complete package for Managed Service Providers (MSPs). It includes all of the software that an MSP needs to run the business – that is called Professional Services Automation (PSA). It also has all of the tools that technicians in the MSP need to perform their duties – that bundle is called a Remote Monitoring and Management package (RMM).
Among the RMM tools are systems to monitor hardware statuses and one of the metrics that the service collects is CPU temperature. That temperature data is shown in a dashboard screen alongside many other server statuses, so it is easy to cross-reference factors such as CPU load to see whether they have an influence on the temperature of the processor.
Pros:
- Minimalistic interface makes it easy to view the metrics that matter most
- Flexible pricing model makes it a viable option for small businesses
- Includes multiple PSA features, great for helpdesk teams and growing MSPs
- Can track SLAs and includes a time-tracking option for maintenance tasks
Cons:
- Smaller organizations may not able to use MSP-specific options
A great benefit of the Atera hosted system is that it includes the server that runs the software and storage space in with the package. Prices are set per technician so a freelance individual setting up a support service gets all of the tools that big businesses get. Larger MSPs can pitch for work knowing that seats are easy to add and remove, which cuts down on the worry of overhead. Get access to all of Atera’s features on a 30-day free trial.
6. Nagios XI
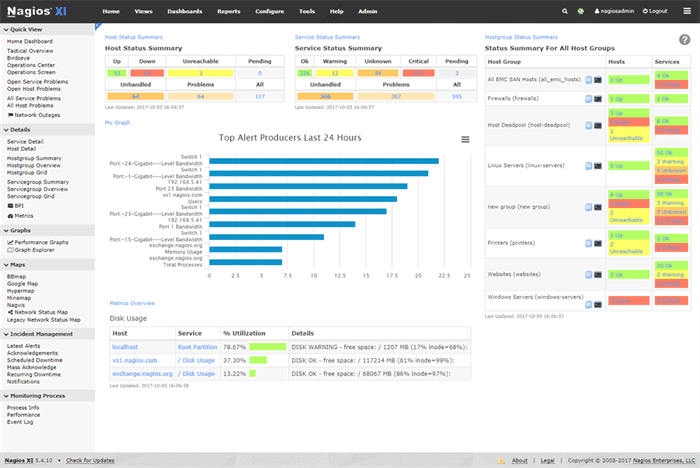
Nagios XI is a package of network, server, and application monitors. This excellent package has a lot of fans and its user community is very active. Buyers of the Nagios XI system get the professional edition of the software. However, there is also a free version, called Nagios Core.
You might wonder why you should bother to pay for Nagios XI when Nagios Core has just about all of the same features – Nagios XI is based on Nagios Core. There is one big difference, which is that Nagios Core is community supported whereas Nagios XI comes with a professional support package.
Not only does the user community contribute enthusiastically to a Nagios message board system but they also produce thousands and thousands of free plugins. Many software producers also create free plugins for Nagios to make it easier to monitor their products with the system. Among the enormous list of plugins are a number that add on the ability to monitor CPU temperature on servers and on network devices.
Pros:
- Simple, yet informative interface
- Flexible alerting options support SMS and email
- A wide range of community-designed plugins are available for free
Cons:
- The open-source version lacks the support found in paid products
The plugin facility of Nagios is its unique selling point and many other monitoring tools are actually forks of Nagios. The great thing about all of those other tools that are copied from Nagios is that all of the Nagios plugins work with them as well. Both Nagios XI and Nagios Core run on Linux. You can run them on a Windows server on top of a VMWare or Hyper-V hypervisor. You can get Nagios Core for free or get a 30-day free trial of Nagios XI.
7. SpeedFan
In this review, we have focused on systems that include CPU temperature checks in with a lot of other monitoring capabilities so that you don’t get stuck opening one small application just to see CPU temperature and little else.
SpeedFan is one of those little specialized applications that we were trying to avoid. However, there is a very good reason that we included it. There are a number of very good free PC system monitor tools that don’t include CPU temperature checks that are still worth a try. Icinga 2 and Zabbix are just two examples of this category.
In these cases, you can easily add in your own custom metrics and the service will create a display for them. All you need is a sensor to gather a live temperature status feed. SpeedFan can be used for this purpose.
Pros:
- Simple installation that begins pulling metrics immediately
- Built for individual machine monitoring with a simple interface
- Collects S.M.A.R.T data as well as detailed metrics about the status of your machine's fans
- Helps users correlate fans speed with temperature
Cons:
- Not for larger networks
- Lacks long-term monitoring features
- Reporting features could use improvement
If you don’t want to set up your own customized CPU temperature feed for some other system, then SpeedFan is a very good standalone system to try. It only runs on Windows and Windows Server. You can download SpeedFan for free.

