
Our funding comes from our readers, and we may earn a commission if you make a purchase through the links on our website.
The Best Container Monitoring Tools
UPDATED: December 21, 2023
Companies are increasingly choosing containers over virtual machines for many good reasons. Containers can substantially cut infrastructure costs, allow faster deployment, and improve scalability and agility. So, it becomes paramount to monitor containers properly to ensure their performance, reliability, availability, and security. Proper container monitoring can also help you make informed decisions and optimize costs accordingly.
In the first part of this guide, you will learn what container monitoring is, its goals and challenges, and the technologies and tools for container monitoring. In the second part of the guide, you will learn about the ten best container monitoring tools.
Here is our list of the best container monitoring tools:
Note: There is no one-size-fits-all container monitoring solution for every single need. The tool you choose will depend on the monitoring level you require and the resources available.
- Site24x7 – EDITOR'S CHOICE Exceptional choice for container monitoring with real-time capabilities and wide platform support. Start a 30-day free trial.
- Prometheus A free and open-source monitoring and alerting tool for time-series data. A great solution for cloud-native infrastructure.
- Grafana Open-source data visualization and analytics platform. A fantastic tool for visualizing container-collected data.
- cAdvisor A free and open-source container resource usage and performance analysis tool.
- Datadog A robust cloud-based monitoring and analytics platform for infrastructure, apps, and logs.
- New Relic A cloud-based performance monitoring and management platform for modern software applications.
- Dynatrace An Artificial intelligence-powered, full-stack performance management solution (by Cisco).
- ELK Stack Open-source log management solution consisting of Elasticsearch, Logstash, and Kibana.
- Instana AI-powered, automatic application performance management solution.
- AppDynamics Software intelligence platform for full-stack application performance management.
- Sematext Cloud-based monitoring, logging, and analytics platform for infrastructure and applications.
What is Container Monitoring?
Container monitoring is the process of using tools and strategies to keep an eye on your containers’ health and performance. It mainly includes checking the amount of CPU, memory, and network utilization your containers use. But it may also involve keeping track of the number of running and stopped containers and their activity by checking their logs and events.
What is the goal of Container monitoring?
A container monitoring solution (tool or strategy) aims to give you more visibility into your containerized environment’s health, performance, availability, reliability, and security. Container monitoring technologies use detection and alerting techniques to help you identify and resolve any issues that may arise. They also help you ensure resources are being used efficiently and avoid any under or over-provisioning. Some container observability solutions can also help you better understand how an application behaves, identify performance bottlenecks and improve the end user’s experience.
What are the challenges of monitoring containers?
- Dynamic nature of containers Since containers are ephemeral (they can quickly spawn and terminate), monitoring them over time is challenging compared to bare-metal or virtual servers.
- Scalability Monitoring scalable containerized environments can be complex and challenging. First, they can spin up and down at any time; second, they can be deployed across multiple servers; and third, they are highly portable and lightweight.
- Real-time monitoring Containers generate many logs and events, which can be challenging to collect and analyze in real-time.
Container Monitoring Tools
Container monitoring tools are software solutions to most of the aforementioned challenges. They collect, analyze, and visualize metrics from containers in a containerized environment. They are usually capable of keeping track of multiple containers and underlying infrastructure (host machines) and alerting you to any problems or failures. Their support may range from Docker container monitoring to Kubernetes monitoring.
Modern container monitoring tools adopt the observability approach. They can give ways to track potential container problems (typically via logs, traces, and metrics).
Keep in mind that container monitoring and container observability are not the same. Container monitoring aims to detect and alert on issues that might impact the performance or availability of containers. Container observability, on the other hand, aims to give you insights into the behavior of containers and their underlying system.
What are some standard features of container monitoring tools?
- Metrics and logs collection Container monitoring tools collect various performance and resource metrics, like CPU utilization, memory usage, and network traffic from containers. These tools may also collect logs, traces, and events.
- Dashboards and visualizations Such tools can also present collected metrics and logs in an intuitive and easily understandable format, typically using graphs and charts.
- Alerts and notifications Container monitoring tools can help set thresholds and receive alerts or notifications via SMS, emails, etc. when metrics exceed or fall below those thresholds.
- Log management A container monitoring tool can usually collect and store logs generated by containers. This feature enables users to search, filter, and analyze logs when troubleshooting or optimizing environments.
- Anomaly detection Some of these tools also have detection and alerting capabilities for unusual patterns or anomalies in container metrics and logs.
Container monitoring tools come with different features and capabilities. Aside from what’s on the above list, features also range from integrations with other tools, the ability to generate reports and dashboards, alerting, and automation and AI capabilities.
The Best Container Monitoring Tools
1. Site24x7 – FREE TRIAL
In the specialized field of Container Monitoring, Site24x7 emerges as a highly effective tool, making it a strong alternative in this category. It provides comprehensive monitoring solutions that are tailored to the unique demands of containerized environments.
Key Features
- Real-time monitoring of container performance
- Detailed visibility into container health and resource usage
- Supports multiple container platforms and orchestrators
- Customizable alerts for immediate issue identification
- Integrated performance analytics
Why do we recommend it?
We recommend Site24x7 for its comprehensive and detailed container monitoring capabilities. Its ability to provide real-time insights and customizable alerts makes it an essential tool for efficiently managing containerized environments.
Site24x7 excels in offering real-time visibility into container performance, which is crucial for the management of dynamic and scalable container ecosystems. Its ability to track metrics such as container health, resource usage, and deployment status across multiple platforms is particularly beneficial for DevOps teams and system administrators who manage containerized applications.
Who is it recommended for?
Site24x7 is ideal for DevOps teams and system administrators who manage containerized applications. Its features are particularly beneficial for those needing to monitor and optimize the performance of a diverse range of containers and orchestration platforms.
Pros:
- Real-time monitoring and performance insights.
- Supports a wide range of container platforms.
- Customizable alerts for quick issue resolution.
Cons:
- The extensive feature set might be overwhelming for users new to container monitoring.
EDITOR'S CHOICE
Site24x7 is our top choice for container monitoring because of its exceptional ability to handle the dynamic nature of containerized environments. What sets it apart in my experience is its real-time monitoring capabilities, ensuring that any issues within containers are quickly identified and addressed. The platform's support for a wide range of container platforms and orchestrators caters well to diverse IT infrastructures. Additionally, the customizable alerts and integrated performance analytics make it a comprehensive solution for anyone looking to optimize their container performance. This tool truly simplifies the complexity of container monitoring, making it an invaluable asset for modern DevOps practices.
Download: Get a 30-day free trial
Official Site: https://www.site24x7.com
OS: Windows, Linux, Cloud
2. Prometheus
Prometheus is a widespread open-source monitoring and alerting solution. It can collect metrics from various systems (including containers) and applications, aggregate them as time-series data, and alert on anomalies or performance issues. Prometheus was created in 2012 by SoundCloud, and later in 2016, it joined the Cloud Native Computing Foundation (CNCF) as the second hosted project after Kubernetes.
Container monitoring with Prometheus?
One of the highlights of Prometheus is its massive number of integrations and extensions. It can natively monitor Kubernetes, nodes, and Prometheus itself. In addition, it can also integrate with cAdvisor (container Adviser) and Kube-state metrics and comes with Docker Cloud exporter and Docker Hub exporter APIs.
In addition, you can also use Docker-daemon (a third-party software add-on) to expose metrics in the Prometheus format. With this daemon, you can also use Prometheus to collect Docker metrics by setting Prometheus to run as a Docker container and monitoring Docker instances using Prometheus.
Pricing and download trial
Prometheus is free and open-source. Download Prometheus from the official site.
3. Grafana
Grafana is a popular open-source and free analytics and visualization platform. It integrates with many other tools to gather, maintain and visualize time-series data from various sources, such as traditional servers, cloud services, virtual machines, Kubernetes clusters, and more. What sets Grafana apart is that it provides remarkable ways to examine, visualize, inquire, and set alerts for the gathered data (logs, metrics, and traces) using user-friendly operational dashboards.
Container monitoring with Grafana
Container monitoring via Grafana requires additional tools like Prometheus (the collection tool) and cAdvisor (a running daemon that collects, aggregates, processes, and exports information about containers running on the host). Grafana offers a Docker + System dashboard to display docker and system metrics and graphing (this solution uses Prometheus and cAdvisor)
Grafana also offers a complete solution (via Grafana Cloud) for monitoring Kubernetes, allowing you to investigate anything from Kubernetes clusters to pods.
Pricing and download trial
Grafana has an open-source license under the AGPLv3, which is provided for free forever and unlimited. Grafana is also offered via Grafana Cloud (fully managed version starts at $8/month) and the Grafana Enterprise (self-managed). Sign up for a 14-day free trial of Grafana Pro (Cloud) or download Free (limited) Forever Cloud.
4. cAdvisor
cAdvisor (Container Advisor) is an open-source container monitoring tool (a daemon) developed by Google. It can collect, aggregate, process, and export container-based resource metrics, such as CPU and memory utilization, network stats, and more. cAdvisor can keep track of resource isolation parameters, historical utilization (via histograms), and more. It comes with native support for Docker container monitoring, but you can use it in any containerized environment, from monitoring a single Docker installation to an entire Kubernetes cluster.
Container monitoring with cAdvisor
cAdvisor comes with a Docker image that includes everything you need to start. So, since this daemon agent is deployed on the container, it can collect and export container data immediately. A single cAdvisor instance can also be used to collect and export the entire machine’s data.
For Kubernetes monitoring, cAdvisor is integrated into the Kubelet binary to auto-discover all the containers and collect their metrics. It can also analyze the root container and provide general machine utilization information. cAdvisor works perfectly with other open-source tools like Prometheus and Grafana.
Pricing and download trial
cAdvisor is free and open-source, download it from its GitHub repository.
5. Datadog
Datadog is an all-in-one cloud-based monitoring and analytics platform for IT, DevOps, and development teams. It can monitor containers in addition to infrastructure, application performance (APM), security, network, synthetic, real-user, serverless, databases, and more. Datadog also provides observability capabilities (integrating logs, traces, and metrics) into a single unified platform. Datadog was named a Leader in Gartner’s 2021 MQ (Magic Quadrant) for APMs.
Container monitoring with Datadog
Datadog offers robust Container Monitoring features with real-time insights into the performance and health of containerized environments. It provides a unified view of container-based microservices with correlated metrics, traces, logs, and network data.
Datadog’s container monitoring features include the following:
- Auto-discovery of containers and services
- End-to-end visibility across the infrastructure
- Streamlined collection of cluster-level data
- Monitoring of serverless containers in any cloud
- Notification of anomalous activity
- Integrations from AWS, Azure, and GCP
In addition, you can also quickly monitor serverless containers with distributed tracing and critical metrics on out-of-the-box dashboards.
Pricing and download trial
Datadog’s Infrastructure monitoring software comes in three different plans, Free ($0), Pro ($15 per/host per/month), and Enterprise ($23 per/host per/month). Sign up for a 14-day free trial of Datadog.
6. New Relic
New Relic is an all-in-one cloud-based full-stack monitoring platform. It is designed to help organizations monitor, troubleshoot, manage, and optimize their system with real-time data and intelligence. It provides robust monitoring into applications, infrastructure, Kubernetes & Pixie, networks, browser experience, mobile, synthetics, and serverless. The tool also provides a few basic management capabilities for logs and vulnerabilities.
Container monitoring with New Relic
New Relic comes with native support for Kubernetes-Pixie container monitoring. This feature gives you real-time visibility into clusters and workloads, making it easier to understand the health and performance of your Kubernetes-Pixie infrastructure. The monitoring capabilities provide data such as deployment age, available pods, compare metrics, and logs.
New Relic also supports Docker container monitoring. It gives you complete visibility from a single place into your Docker containers, containerized apps, and server infrastructure.
Pricing and download trial
New Relic comes in three editions, Standard (starts at $0/month), Pro, and Enterprise. Contact New Relic or request a demo for the pricing on other editions. Sign up to New Relic to start the free Standard edition.
7. Dynatrace
Dynatrace is a comprehensive monitoring platform that combines observability, AIOps, automation, and intelligence. It is built on a unified data model to enable increased automation and intelligence. The tool provides automation capabilities, such as auto-scanning, discovering, mapping, and monitoring the complete technology stack. It also comes with Davis, an AI-powered engine that provides insights into application performance, infrastructure, and user experience. In 2021, Dynatrace was recognized as a leader in the Gartner Magic Quadrant for Application Performance Management.
Container monitoring with Dynatrace
Dynatrace is a leader in container monitoring and has been rated highly by users in G2 for this category. The solution provides insights into containerized applications' performance, infrastructure, and user experience. Dynatrace supports Docker container monitoring and Kubernetes/OpenShift full-stack monitoring.
One of the critical benefits of Dynatrace regarding container monitoring is that it requires only one agent to monitor multiple container workloads. The Dynatrace OneAgent automatically discovers containers and creates a real-time topology of the environment.
Pricing and download trial
Dynatrace container monitoring (via infrastructure monitoring) starts at $22 /month /8GB per Host. Sign up to get a free trial.
8. ELK Stack
The ELK Stack (Elasticsearch, Logstash, and Kibana) from Elastic is a powerful open-source solution for managing and analyzing large volumes of data. Elasticsearch is the search and analytics engine for quickly finding and analyzing large datasets. Logstash is a lightweight data processing pipeline for collecting, transforming, and sending data to its final destination. Kibana is the data visualization engine for Elasticsearch.
Container monitoring with ELK Stack
The ELK Stack allows you to monitor containers in a flexible and scalable way. The ELK Stack also comes with the Metricbeat component (a lightweight shipper for metrics) to ingest metrics from running Docker containers and Kubernetes pods.
For Docker containers, Metricbeat can be installed as a Docker image for an accessible collection of metrics. The collected metrics can then be analyzed using the Inventory page. In a Kubernetes environment, Metricbeat can run as a DaemonSet to monitor multiple pods. The autodiscovery feature of Metricbeat ensures that metrics collection continues even when the pod configuration changes.
Pricing and download trial
There are four commercial editions of the software: Standard ($95 per month), Gold ($109 per month), Platinum ($125 per month), and Enterprise. ($175 per month). Register to start your free Elastic Cloud trial.
9. Instana
Instana (by IBM) provides a powerful enterprise-level observability platform designed for monitoring and optimizing application performance. This platform can collect all essential observability data. In addition to collecting metrics, Instana can also trace each request, profile every process, and update application dependency maps in real-time.
Container monitoring with ELK Stack
Instana provides a comprehensive Docker monitoring solution. Instana’s Docker monitoring capabilities go beyond simple container metrics collection. It also offers automatic discovery, deployment, and configuration and covers various monitoring levels, including Docker containers, software components, infrastructure, and applications.
Instana’s agent installs into the virtual or physical host. It automatically discovers all containers and their components and deploys the appropriate monitoring sensors. This sensor automatically collects performance metrics such as CPU, memory, block IO, and network and provides health information about the Docker container.
Pricing and download trial
SaaS prices start at $75 per host/month and are billed annually. The price for self-hosting starts at $93.80 per host/month. Sign up to Instana and get a 14-day free trial.
10. AppDynamics
AppDynamics (by Cisco) is a leading solution in the field of Application Performance Management (APM) and full-stack observability platforms. With AppDynamics, DevOps teams can track the entire technology stack, including business processes, users, applications, infrastructure, networks, and security measures. AppDynamics has received recognition as a leader in the APM market from Gartner in its 2021 Magic Quadrant Report for APM.
Container monitoring with app dynamics
AppDynamics provides robust capabilities for container monitoring using a unified view of all containers and application code. It helps you monitor your containers effectively, whether modernizing a traditional stack or developing a complex cloud-native microservices architecture.
AppDynamics supports Docker container monitoring. It is fully automated, with end-to-end, unified microservices monitoring for all Docker hosts and containers and application code. AppDynamics offers an instant discovery of application topology and performance monitoring with container images in the Docker Store, a trusted registry validated by Docker.
Pricing and download trial
Infrastructure Monitoring Edition (at $6/month /CPU Core) allows container monitoring. Sign up to AppDynamics to get a 15-day trial.
11. Sematext
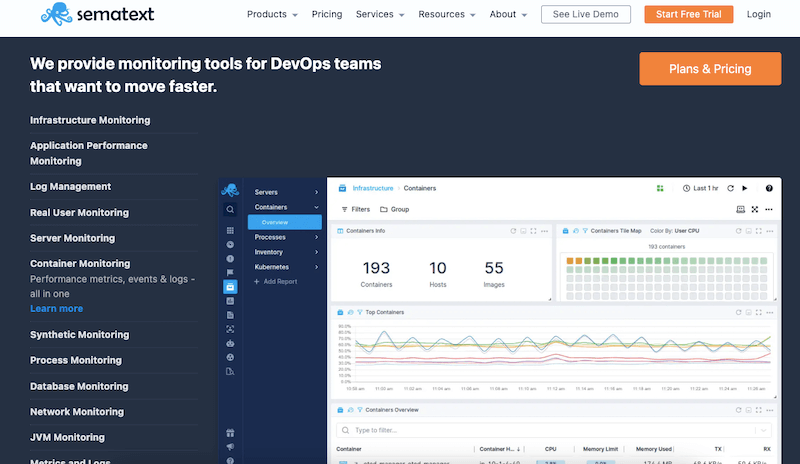
Sematext provides modern and comprehensive IT system monitoring solutions for DevOps, SysAdmins, and SREs. Its offerings include APM, log centralization/management, alert/anomaly detection, and real-user monitoring. Sematext offers Sematext Cloud, their all-in-one observability solution, with complete visibility into logs, metrics, and traces.
Container monitoring with Sematext
Sematext can monitor containers with its scalable and unified solution. With Sematext, you can correlate and monitor container metrics, logs, and traces in a single monitoring dashboard. The solution uses an agent (Sematext Agent), which runs as a lightweight container and collects all host and container metrics, logs, and events. The agent uses an auto-discovery feature to identify and monitor containers automatically.
Sematext supports container monitoring for Docker and Kubernetes. It provides out-of-the-box dashboards for Kubernetes pods, nodes, deployments, storage, and more. It also supports monitoring for Rancher through its Rancher Catalog and for Docker Swarm as a service.
Pricing and download trial
Sematext infrastructure monitoring software solution covers container monitoring. It comes in three editions, Basic ($0/month), Standard ($3.6/month), and Pro ($5.76/month). Register to start with the free trials.

